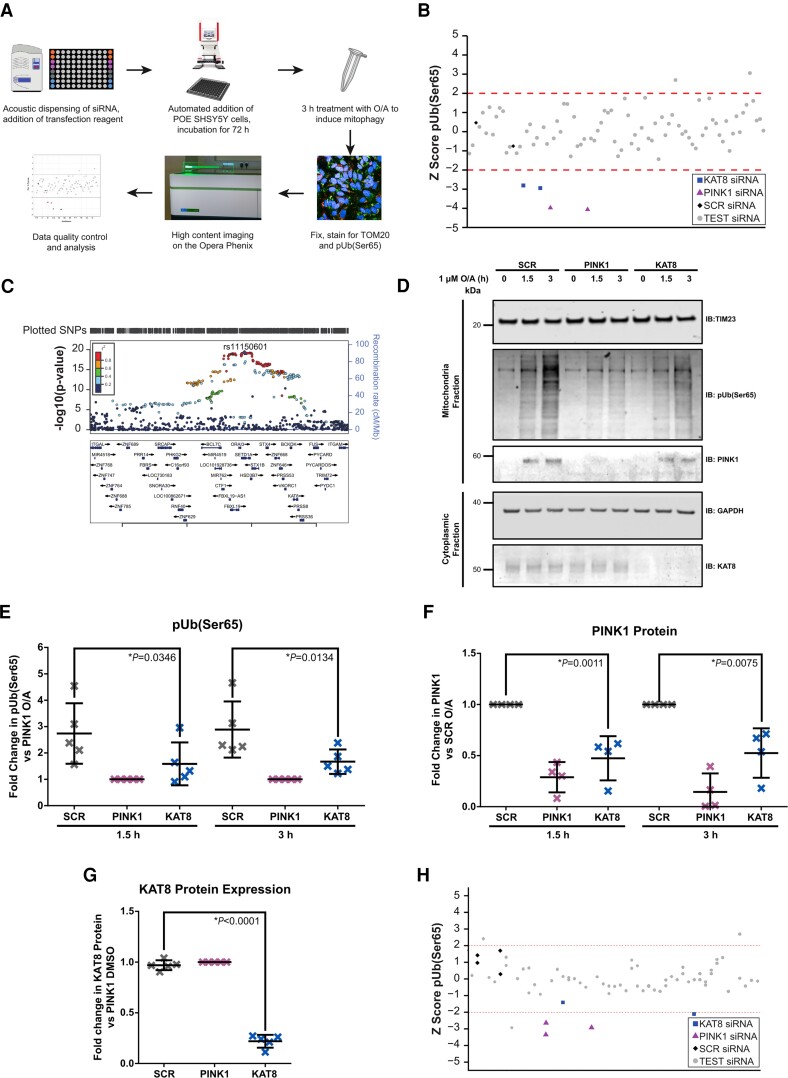
Figure 1.
High-content mitophagy screening of Parkinson’s disease risk genes identifies KAT8 as a modulator of pUb(Ser65) levels. (A) Workflow of the high-content screen for O/A-induced pUb(Ser65) levels. (B) pUb(Ser65) Z scores of one representative mitophagy screen plate. (C) Overview of the Parkinson’s disease GWAS genetic signal at the KAT8 locus. (D) Representative IB of mitochondrial fractions from SCR, PINK1 and KAT8 KD POE SHSY5Y treated with 1 µM O/A for 1.5 or 3 h. (E) Quantification of pUb(Ser65) in E (n = 5, one-way ANOVA with Dunnett’s correction). (F) Quantification of PINK1 in E (n = 4, one-way ANOVA with Dunnett’s correction). (G) Quantification of KAT8 in E (n = 5, one-way ANOVA with Dunnett’s correction). (H) pUb(Ser65) Z scores of one representative lysine acetyltransferase screen plate. See Supplementary Table 5 for the complete list of the genes screened. Data are shown as mean ± SD.

