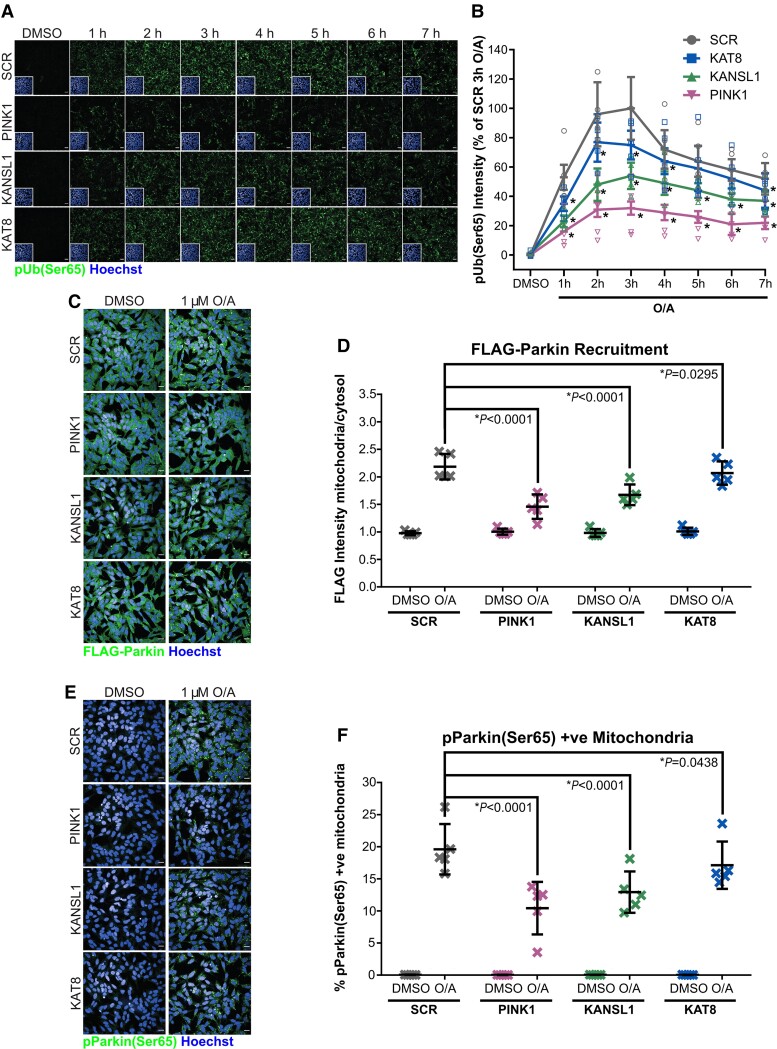
Figure 3.
KAT8 and KANSL1 knockdown decreases PINK1-dependent mitophagy initiation. (A) Representative images of pUb(Ser65) (green) following treatment of SCR, PINK1, KAT8 and KANSL1 KD POE SHSY5Y cells with 1 μM O/A for 0–7 h. Insets show the nuclei (blue) for the same fields. Scale bar = 20 μm. (B) Quantification of pUb(Ser65) in A (n = 6, two-way ANOVA with Dunnett’s correction). For details on the statistical test, see Supplementary Table 6. (C) Representative images of FLAG-Parkin (green) with Hoechst nuclei counterstain (blue) following treatment of SCR, PINK1 and KAT8 siRNA KD POE SHSY5Y with 1 µM O/A for 3 h. Scale bar = 20 µm. (D) Quantification of FLAG-Parkin recruitment to the mitochondria as a ratio of FLAG intensity in the mitochondria and in the cytosol in C (n = 5, two-way ANOVA with Dunnett’s correction). (E) Representative images of pParkin (green) with Hoechst nuclei counterstain (blue) following treatment of SCR, PINK1 and KAT8 siRNA KD POE SHSY5Y with 1 µM O/A for 3 h. Scale bar = 20 µm. (F) Quantification of pParkin levels in E (n = 5, two-way ANOVA with Dunnett’s correction). Data are shown as mean ± SD.

