

Abstract
In the January 2022 issue of BMC Gastroenterology, Chen et al. report an association between serum ferritin levels and the presence of advanced liver fibrosis in patients with treatment-naïve autoimmune hepatitis (AIH). The odds ratio for ferritin in this study was marginally above 1.0. We analyzed our own published data from a German cohort for an association between ferritin levels and the presence of advanced fibrosis in treatment-naïve AIH and were not able to validate the findings of Cheng et al.
Supplementary Information
The online version contains supplementary material available at 10.1186/s12876-022-02588-0.
Keywords: Biochemical remission, Incomplete response, AIH, Iron, Treatment response
To the editor,
We read with greatest interest the recent work by Chen et al. in BMC Gastroenterology [1] that reported a correlation of parameters of iron metabolism with advanced fibrosis in patients with untreated autoimmune hepatitis (AIH). Chen and colleagues identified ferritin levels above 199 µg/L as a non-invasive predictor of advanced fibrosis (≥ F3) in baseline biopsies from pre-treatment AIH patients in a Chinese retrospective single-center study (n = 97). Although ferritin was slightly associated with advanced fibrosis according to the odds ratio (OR) (95% confidence interval (95%-CI) 1.001–1.004), the association according to the area under the curve was moderate (AUC = 0.738, 95%-CI 0.639–0.822).
We analyzed parameters of iron homeostasis in a similarly sized retrospective single-center cohort of untreated German AIH patients [2]. As we did not investigate an association between ferritin and advanced fibrosis in the initial publication, we reanalyzed our data to investigate the findings of Chen et al. in our cohort. A detailed histological scoring of fibrosis was available from 85 of 109 patients in our cohort (Table 1). We defined advanced fibrosis as F4–F6 according to Ishak et al. [3], which should correspond to fibrosis stages F3–F4 according to Batts/Ludwig [4] as applied by Chen et al. We replicated univariate binary logistic regression (“Enter”-method, IBM SPSS Statistics 27) but found no predictive capacity of ferritin for advanced fibrosis (ferritin normalized to the upper limit of normal (ULN) OR: 1.917; 95%-CI 0.943–1.096; p = 0.665 or ferritin as absolute values in µg/L: OR: 1.000; 95%-CI 1.000–1.000; p = 0.963). This was reflected in the ROC analysis with AUCs of 0.574 (95%-CI 0.441–0.708; p = 0.253; absolute ferritin values) and 0.556 (95%-CI 0.424–0.689; p = 0.386; ferritin values normalized to the ULN) respectively in our German cohort (Fig. 1).We generally prefer to use ferritin values normalized to the upper limit of normal as this approach corrects for differences in the normal range related to sex and age which Chen et al. accounted for by including these parameters in the logistic regression analysis. To allow comparison and fair validation, we present both absolute and normalized ferritin values. Of note, AIH has different genetic and environmental risk factors in different age groups and different parts of the world, which could explain differences in clinical presentation at the time point of diagnosis of AIH, i.e. in terms of severity which may affect ferritin levels, too [5–7].
Table 1.
Clinical parameters of patients with or without significant liver fibrosis
| F0-3 | F4-6 | p-value | |
|---|---|---|---|
| Patient number | 53 | 32 | |
| Female sex | 37 (69.8) | 19 (59.4) | 0.353 |
| Age [years] | 52 (17–78) | 59 (20–83) | 0.231 |
| Ferritin [µg/l] | 423 (15–5869) | 755.0 (25.0–7892.0) | 0.253 |
| Ferritin [xULN] | 1.3 (0.1–16.1) | 2.5 (0.1–21.6) | 0.386 |
| TIBC [µmol/l] | 67 (42–378) (n = 39) | 50.0 (24.0–97.0) (n = 24) | < 0.001 |
| Transferrinsaturation [%] | 35.5 (16.0–100.0) (n = 40) | 45.5 (16.0–100.0) (n = 24) | 0.282 |
| Iron [xULN] | 1.1 (0.5–3.7) (n = 42) | 1.0 (0.2–2.3) (n = 26) | 0.767 |
| IgG [xULN] | 1.2 (0.5–3.6) | 1.7 (0.6–4.6) | < 0.001 |
| CRP [mg/l] | 5.0 (1.0–38.0) (n = 51) | 11.5 (1.0–77.0) (n = 28) | 0.066 |
| Hb [g/dl] | 13.6 (11.4–16.5) | 13.1 (9.8–15.8) | 0.091 |
| ANA | 44 (84.6) (n = 52) | 31 (96.9) | 0.143 |
| SMA | 44 (83.0) | 23 (79.3) (n = 29) | 0.768 |
| SLA | 2 (3.8) | 2 (6.3) | 0.630 |
| LKM | 1 (1.9) | 0 (0) | 1.0 |
| AIH Score | 13 (10–21) | 14 (10–21) | 0.728 |
| ALT [xULN] | 20.8 (0.7–68.5) | 15.9 (1.9–118.4) | 0.207 |
| AST [xULN] | 19.1 (1.2–45.1) | 17.2 (2.1–113.2) | 0.964 |
| gGT [xULN] | 3.6 (0.8–23.9) | 5.5 (0.5–34.1) | 0.113 |
| ALP [xULN] | 1.2 (0.3–5.5) | 1.4 (0.5–5.7) (n = 31) | 0.131 |
| Bilirubin [xULN] | 2.1 (0.3–27.8) (n = 51) | 3.7 (0.3–45.2) (n = 31) | 0.207 |
| PT [%] | 78 (44–112) | 63 (39–100) (n = 31) | 0.002 |
| mHAI | 9 (4–15) (n = 49) | 8 (3–15) (n = 24) | 0.214 |
| Ishak F | 1 (0–3) | 5 (4–6) | < 0.001 |
Fisher’s Exact test was used to compare categorical variables and the Mann–Whitney-U test was used to compare continuous variables. Results are displayed as n (%) or median (range) as appropriate. xULN times upper limit of normal; TIBC total iron binding capacity; IgG immunoglobulin G; CRP C-reactive protein; Hb hemoglobin; ANA antinuclear antibodies; anti-SMA anti-smooth muscle actin antibodies; anti-SLA anti-soluble liver antigen antibodies; anti-LKM anti-liver kidney microsomal antibodies; ALT alanine aminotransferase; AST asparatate aminotransferase; gGT gamma-glutamyl transferase; ALP alkaline phosphatase; PT prothrombin time; mHAI modified histologic activity index; Ishak F Fibrosis staging according to Ishak et al
p-values < 0.05 were regarded as significant and are designated in bold
Fig. 1.
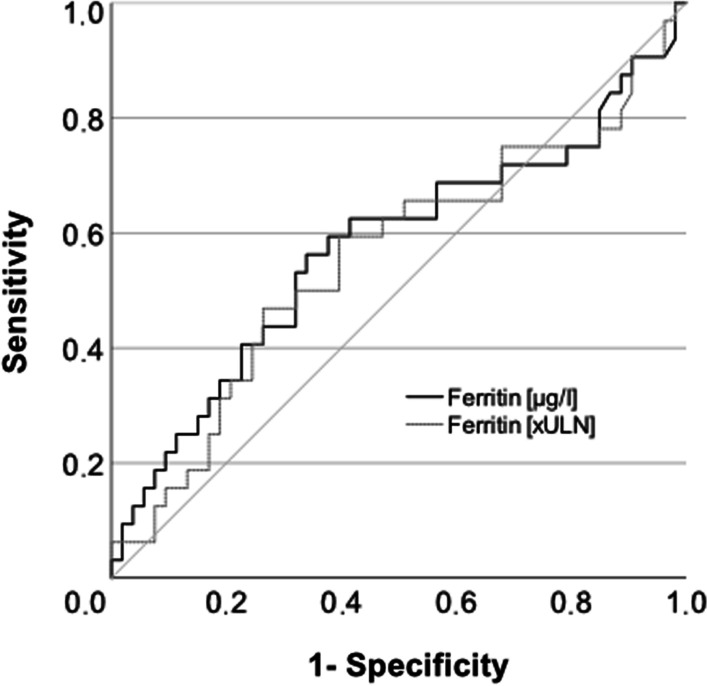
Area under the curve for the association of absolute and normalized ferritin values and advanced fibrosis. xULN times upper limit of normal
Next, we applied the cut-off value for ferritin of 199 µg/l from Chen et al. to divide our cohort into two groups. Remarkably, the parameters of iron metabolism were significantly different between both groups. In addition, parameters of general (C-reactive protein) and liver-specific inflammation (transaminases, cholestasis parameters) were higher in patients with higher ferritin levels. However, the histological fibrosis stages were not significantly different with regard to patients’ ferritin levels (Additional file 1: Table S1). The OR for advanced fibrosis using absolute ferritin levels with a cut-off of 199 µg/l as published by Chen et al. was 1.444 (95%-CI 0.571–3.653) (calculated using a crosstab). Overall, as the findings of Chen et al. and ours contradict each other, further analysis in other cohorts is needed to clarify the relevance of ferritin levels in terms of fibrosis prediction in AIH patients.
The main finding of our analysis of iron homeostasis in untreated AIH patients was the association of elevated ferritin levels (> 2.09 × ULN) with achieving biochemical remission after initiation of immunosuppressive therapy. In addition to elevated ferritin levels, hypergammaglobulinemia below 1.89 xULN was independently associated with achievement of biochemical remission. Finally, we could develop a treatment response score for AIH using both baseline parameters (ferritin and immunoglobulin G (IgG)). This treatment-response score was significantly associated with the achievement of biochemical remission in a training (AUC: 0.75; 95% CI 0.64–0.86) and validation cohort (AUC: 0.74; 95% CI 0.56–0.92). While almost all patients with a score < 1 achieved biochemical remission to standard of care, 20–40% of patients with a score ≥ 1 did not achieve biochemical remission. The advantage of this treatment-response score is its ability at baseline to predict achievement of biochemical remission, while a more recent treatment response score developed in a European retrospective multicenter study used the 80% decline of aspartate aminotransferase after eight weeks of therapy as predictor of biochemical remission at six and twelve months after diagnosis[8]. Interestingly, the predictive capacity of the 80% AST decline was comparable to our treatment response score (AUC (80% AST decline) = 0.65; 95%-CI 0.59–0.71).
Many centers do not measure parameters of iron homeostasis in the initial assessment of acute hepatitis, including AIH, which explains why our treatment response score has not yet been validated. Unfortunately, Chen et al. did not analyze predictors of treatment response in their Chinese cohort. Although we could not replicate the findings by Chen et al., we would be very interested to see if the prediction of treatment response in AIH by baseline ferritin and baseline IgG before starting therapy could be validated in their Chinese cohort.
Supplementary Information
Additional file 1. Table S1 Patients’ characteristics stratified by ferritin levels
Acknowledgements
We thank Konstantinos Iordanidis from the “immune tolerance working group” at Hannover Medical School for technical assistance and sample collection.
Editor's note
The Editors attempted to invite the authors of the published article to which this letter refers to submit a response; however, we did not receive a response from the corresponding email address provided on the original article, and no reply has been submitted at the time of publication of this letter.
Abbreviations
- AIH
Autoimmune hepatitis
- ALP
Alkaline phosphatase
- ALT
Alanine aminotransferase
- ANA
Antinuclear antibodies
- anti-LKM
Anti-liver kidney microsomal antibodies
- anti-SLA
Anti-soluble liver antigen antibodies
- anti-SMA
Anti-smooth muscle actin antibodies
- AST
Aspartate aminotransferase
- CI
Confidence interval
- CRP
C-reactive protein
- gGT
Gamma-glutamyl transferase
- Hb
Hemoglobin
- IgG
Immunoglobulin G
- Ishak F
Fibrosis staging according to Ishak et al.
- mHAI
Modified histologic activity index
- OR
Odds ratio
- PT
Prothrombin time
- TIBC
Total iron binding capacity
- xULN
Times upper limit of normal
Author contributions
BE and RT designed the study, provided administrative, technical or material support, obtained funding, acquired data and performed statistical analyses. BE and RT drafted the manuscript. RT supervised the study. EJ revised the manuscript, supervised the study and provided important intellectual content. EJ provided administrative, technical or material support. All authors read and approved the final manuscript.
Funding
Open Access funding enabled and organized by Projekt DEAL. The work was supported by grants from the German Research Foundation (KFO250 projects 3, 7 and Z1) and EU research consortium RESHAPE. RT was supported by the Young Faculty program and the Core 100 advanced clinician scientist program from Hannover Medical School. BE was supported by the young clinician scientist program (PRACTIS) from Hannover Medical School.
Availability of data and materials
The datasets supporting this article are available from the corresponding author on reasonable request.
Declarations
Ethics approval and consent to participate
The use of retained samples from our clinical laboratories from patients with liver diseases was approved by the local ethical committee (approval number 2817-2015). The study conforms to the ethical guidelines of the 1975 Declaration of Helsinki as reflected in an a priori approval by the institution’s human research committee.
Consent for publication
Not applicable.
Competing interests
The authors report no conflicts of interest regarding this work.
Footnotes
Publisher's Note
Springer Nature remains neutral with regard to jurisdictional claims in published maps and institutional affiliations.
References
- 1.Chen Q, Gao M, Yang H, Mei L, Zhong R, Han P, Liu P, Zhao L, Wang J, Li J. Serum ferritin levels are associated with advanced liver fibrosis in treatment-naive autoimmune hepatitis. BMC Gastroenterol. 2022;22(1):23. doi: 10.1186/s12876-022-02098-z. [DOI] [PMC free article] [PubMed] [Google Scholar]
- 2.Taubert R, Hardtke-Wolenski M, Noyan F, Lalanne C, Jonigk D, Schlue J, Krech T, Lichtinghagen R, Falk CS, Schlaphoff V, et al. Hyperferritinemia and hypergammaglobulinemia predict the treatment response to standard therapy in autoimmune hepatitis. PLoS One. 2017;12(6):e0179074. doi: 10.1371/journal.pone.0179074. [DOI] [PMC free article] [PubMed] [Google Scholar]
- 3.Ishak K, Baptista A, Bianchi L, Callea F, De Groote J, Gudat F, Denk H, Desmet V, Korb G, MacSween RN, et al. Histological grading and staging of chronic hepatitis. J Hepatol. 1995;22(6):696–699. doi: 10.1016/0168-8278(95)80226-6. [DOI] [PubMed] [Google Scholar]
- 4.Batts KP, Ludwig J. Chronic hepatitis. An update on terminology and reporting. Am J Surg Pathol. 1995;19(12):1409–1417. doi: 10.1097/00000478-199512000-00007. [DOI] [PubMed] [Google Scholar]
- 5.Taubert R, Diestelhorst J, Junge N, Kirstein MM, Pischke S, Vogel A, Bantel H, Baumann U, Manns MP, Wedemeyer H, et al. Increased seroprevalence of HAV and parvovirus B19 in children and of HEV in adults at diagnosis of autoimmune hepatitis. Sci Rep. 2018;8(1):17452. doi: 10.1038/s41598-018-35882-7. [DOI] [PMC free article] [PubMed] [Google Scholar]
- 6.Engel B, Laschtowitz A, Janik MK, Junge N, Baumann U, Milkiewicz P, Taubert R, Sebode M. Genetic aspects of adult and pediatric autoimmune hepatitis: a concise review. Eur J Med Genet. 2021;64(6):104214. doi: 10.1016/j.ejmg.2021.104214. [DOI] [PubMed] [Google Scholar]
- 7.Webb GJ, Hirschfield GM, Krawitt EL, Gershwin ME. Cellular and molecular mechanisms of autoimmune hepatitis. Annu Rev Pathol. 2018;13:247–292. doi: 10.1146/annurev-pathol-020117-043534. [DOI] [PubMed] [Google Scholar]
- 8.Pape S, Gevers TJG, Vrolijk JM, van Hoek B, Bouma G, van Nieuwkerk CMJ, Taubert R, Jaeckel E, Manns MP, Papp M, et al. Rapid response to treatment of autoimmune hepatitis associated with remission at 6 and 12 months. Clin Gastroenterol Hepatol Off Clin Pract J Am Gastroenterol Assoc. 2020;18(7):1609–1617. doi: 10.1016/j.cgh.2019.11.013. [DOI] [PubMed] [Google Scholar]
Associated Data
This section collects any data citations, data availability statements, or supplementary materials included in this article.
Supplementary Materials
Additional file 1. Table S1 Patients’ characteristics stratified by ferritin levels
Data Availability Statement
The datasets supporting this article are available from the corresponding author on reasonable request.