

Abstract
Objective
As of January 2022, USMLE Step 1 scores are reported as pass/fail. Historically, Step 1 scores have been a critical component of residency applications, representing one of the few metrics standardized across all applicants independent of the school they attended. In competitive specialties, such as otolaryngology, programs routinely get 100+ applicants for each residency spot and use Step 1 as a screening tool. This study seeks to assess quantifiable metrics in the application that highly competitive residency programs could use for screening in place of Step 1 scores.
Methods
Otolaryngology applications to an academic medical center for the 2019–20 and 2020–21 ERAS cycles were reviewed. Board scores and quantitative research data were extracted. The relationships between Step 1 score and the other metrics were examined by computing Pearson's correlation coefficients and building regression models. Similar analyses were done separately for three different score tiers defined by Step 1 cutoffs at 220 points and 250 points.
Results
Step 2 score was the only variable that had meaningful correlation with Step 1 score (R = .67, p < 2.2e−16). No other objective metric such as journal articles, posters, or oral presentations correlated with Step 1 scores.
Conclusion
Step 1 scores were moderately correlated with Step 2 scores; however, using a Step 2 cutoff instead of a Step 1 cutoff would identify a different cohort of applicants for interview. No other quantifiable application metric had a positive correlation. In future match cycles, highly competitive residency programs will need to adopt new methods to screen candidates.
Level of Evidence: Level 3.
Keywords: identify new metrics, residency application screening, step 1 pass/fail
Step 1 and Step 2 scores were moderately correlated, but using a Step 2 cutoff would identify a different cohort of applicants for interview because the distributions of Step 1 and Step 2 scores are different. No other quantifiable application metric was correlated with Step 1 score.
1. INTRODUCTION
On February 12, 2020, the National Board of Medical Examiners (NBME) announced a monumental change in policy regarding the transition of the United States Medical Licensing Exam (USMLE) Step 1 from the traditional 3‐digit numeric score to a pass/fail reporting system. 1 This change, which became effective as of January 26, 2022, was based on the intention to “reduce some of the current overemphasis on USMLE performance”—thereby reducing burnout among medical students—in evaluating medical student candidacy for residency application. The overemphasis on USMLE performance can be understood by the results from the 2018 National Resident Matching Program (NRMP) Residency Program Director Survey, which found that Step 1 was the factor cited by the greatest number of programs (94%) across all specialties for use in selecting applicants to interview. 2 In fact, 64% of programs reported using a target score when considering which applicants to interview.
While national board scores have been numerically reported since their inception, the NBME initially cautioned against their use for residency selection, stating “it is important to understand, however, that the examinations have not been developed for the purpose of assessing preparation for postgraduate education.” 3 This debate regarding their utility and the premise of pass/fail reporting is not new by any means, spanning decades worth of discourse. 4 , 5 As national board scores represent the only metric standardized across all applicants, program directors have highlighted its necessity for objectively filtering the ever‐increasing vast number of applications received. 6 Multiple studies have justified the use of Step 1 scores for resident selection based on its association with resident success on in‐service examinations and the likelihood of passing board examinations, particularly on their first attempt. 7 , 8 , 9 , 10 , 11 , 12 , 13 However, multiple studies have also demonstrated that there is not a clear association between Step 1 performance and the more subjective indicators of success in residency, such as supervisor and faculty evaluations, considering that much of the basic foundational science covered in Step 1 may not be particularly relevant to practice of most physicians. 13 , 14 , 15
The disproportionate emphasis on numeric Step 1 scores in the evaluation of residency applications has been attributed to the lack of standardization across medical school transcripts, particularly in regards to grade inflation (or a switch to pass/fail course grades) and the lack of class standing in many Deans' Letters. 6 As highlighted by Puscas et al., these trends have made medical student applications increasingly indistinguishable. 16 In an ideal world, programs would holistically and objectively evaluate all applicants in determining ideal fits for residency spots; however, this is simply not feasible. In the two application cycles we studied, there were nearly 1000 applicants for eight spots within the otolaryngology residency program at our institution. With the restructuring of Step 1 score reporting to pass/fail without addressing a means by which to reduce the number of applications residency programs receive, programs will naturally be seeking alternative metrics to screen candidates. Prior research examining the relationship between Step 1 and Step 2 scores found that 79% of residency applicants had Step 2 scores at the time of application and that there was a strong correlation between the two (r = .675). 17 The purpose of this study was to conduct an in‐depth analysis comparing the distributions of Step 1 and Step 2 scores and to investigate the relationships between Step 1 score and other objective markers of success in the ERAS application. To our knowledge, this is the first study to examine not only Step 1 and Step 2's score distributions but also Step 1 score's relationships with other components of residency applications beyond Step 2 score.
2. METHODS
2.1. Study design, setting, and population
This study was a retrospective analysis of all residency applications submitted to the University of North Carolina Otolaryngology/Head and Neck Surgery Department during the 2019–2020 and 2020–2021 cycles. The study was approved by the organization's institutional review board. Electronic Residency Application Service (ERAS) files were pulled from internal department archives by an administrative coordinator and applicants were anonymized with an assigned unique study identification number. Demographic information (including self‐reported gender, race, and ethnicity) as well as board scores and quantitative research data were extracted.
2.2. Statistical analysis
Nine hundred and twenty‐eight (n = 928) residency applications from cycles 2019–2020 and 2020–2021 were included to assess the relationship between Step 1 score and nine other objective metrics. Pearson correlation coefficients were computed to measure the strength of each relationship. Metrics with significant correlation were identified, and a linear regression model was built to further examine their mathematical relation with Step 1 score. To assess whether students perform consistently across Step 1 and Step 2 exams or whether low performance on Step 1 was compensated for by excellent Step 2 scores, score ranges were divided into three brackets marked by thresholds at 220 and 250. Individuals without either Step 1 score or Step 2 score were excluded, with a total of nine applicants being excluded. All analyses were conducted using R 4.1.2 (R Core Team; Vienna, Austria) and p values <.05 were considered statistically significant.
3. RESULTS
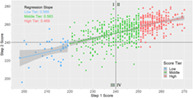
The statistics of Step 1 score and nine other metrics were included in Table 1, with a more detailed version included in Table S1. Applicant demographics can be found in Tables S2 and S3. Computation of Pearson's correlation coefficient revealed the relationship between Step 1 and Step 2 scores to be moderate, positive, and statistically significant [r(796) = .67, p < .001] (Table 2; Figure 1A). To assess if applicants with low Step 1 scores tended to significantly increase their Step 2 scores, the applicant pool was broken down into three tiers based on Step 1 scores: low—scores below 220; middle—scores between 220 and 250; and high—scores >250. In these three tiers, the relationship between Step 1 and Step 2 remains positive and statistically significant. The subgroup regression slopes were 0.566, 0.583, and 0.469 for low, middle, and high tier, respectively (Figure 2).
TABLE 1.
Statistics of potential screening metrics (n = 928)
| Variable | Value |
|---|---|
| Number of Applicants with a Step 1 Score | 921 (99%) |
| Step 1 Score; mean (SD) | 245.11 (12.76) |
| Number of Applicants with a Step 2 Score | 798 (86%) |
| Step 2 Score; mean (SD) | 253.02 (12.37) |
| Peer Reviewed Journal Articles/Abstracts; mean (SD) | 3.17 (3.82) |
|
Peer Reviewed Journal Articles/Abstracts (Other than Published); mean (SD) |
2.64 (2.98) |
| Book Chapter (Peer Reviewed); mean (SD) | 0.13 (0.51) |
| Poster Presentation; mean (SD) | 4.53 (4.40) |
| Oral Presentation; mean (SD) | 2.55 (2.85) |
| Online Publication (Peer Reviewed); mean (SD) | 0.19 (0.67) |
| Online Publication (Non‐Peer Reviewed); mean (SD) | 0.18 (0.61) |
| Other Articles; mean (SD) | 0.28 (1.41) |
TABLE 2.
Correlation of metrics with Step 1 score
| Variable | Pearson's correlation coefficient, p value |
|---|---|
| Step 2 Score | .67, <2.2e−16 |
| Peer Reviewed Journal Articles/Abstracts | −.00072, .982 |
| Peer Reviewed Journal Articles/Abstracts (Other than Published) | .015, .648 |
| Book Chapter (Peer Reviewed) | −.083, .012 |
| Poster Presentation | −.03, .361 |
| Oral Presentation | −.072, .029 |
| Online Publication (Peer Reviewed) | −.062, .062 |
| Online Publication (Non‐Peer Reviewed) | −.055, .095 |
| Other Articles | −.051, .124 |
FIGURE 1.

Step 1 score only correlated with Step 2 score. (A) Correlation coefficient for Step 1 and Step 2 was R = .67, p < .001. (B) There was no correlation between Step 1 score and peer reviewed abstracts (R = .00072, p = .982). (C) No correlation was noted for Step 1 scores and number of oral presentations (R = .072, p = .029). (D) Step 1 scores were not correlated with poster presentation (R = −.03, p = .361)
FIGURE 2.

Applicants performed consistently across Step 1 and Step 2 exams. When the applicant pool was broken down into low, middle, and high Step 1 score tiers at scores 220 and 250, the regression slopes were comparable, suggesting that applicants with high Step 1 scores performed well on Step 2 and refuting our hypothesis that applicants with low step 1 scores would compensate with extraordinary Step 2 scores
Given that a Step 1 cutoff at 240 is frequently used by programs for screening applicants, we were also interested in seeing if Step 2 scores had similar distribution centered around the 240 cutoff that could be used as a reference for programs that decide to put more weight on Step 2 scores for applicant evaluation going forward. The number of applicants above the 240 cutoff was very similar for the two exams. There were 665 applicants who had a Step 1 score above 240, and there were 693 applicants above the same cutoff on the Step 2 exam. For Step 2, a total of 678 applicants had scores above 241 and 665 applicants above 242. In other words, Step 2 cutoff at 242 would give the same number of applicants as Step 1 cutoff at 240 for the applicant pool we assessed.
A linear regression model was used to further assess the mathematical relationship between Step 1 and Step 2 scores. All of the assumptions for linear regression were checked and met, including linearity of the data, normality of residuals, homoscedasticity, and independence of residual errors. See Figure S1 for diagnostic plots. After fitting the regression model, we found that Step 2 score could be used to predict Step 1 score reliably (β = 0.69, p < 2e−16). The overall model is
with statistical significance (R 2 = 0.44, F[1, 796] = 632.6, p < 2.2e−16).
Although Step 1 and Step 2 scores presented moderately strong linear relationship that would allow one to interpolate the latter using the former, Step 1 scores had little to no collinearity with any of the other research‐related metrics, including the number of peer reviewed abstracts [r(919) = −.00072, p = .982], the number of oral presentations [r(919) = −.072, p = .029], or the number of poster presentations [r(919) = −.03, p = .361] (Table 2, Figure 1B–D). A comprehensive analysis of correlation between all pairs of metrics was also performed, and the summary of which can be found in Figure S2.
4. DISCUSSION
In the past, Step 1 score has been used as the gold standard cutoff for screening applicants by competitive residency programs. In response to Step 1 becoming pass/fail, competitive residency programs will need to adopt new strategies to screen their applicant pools for a limited number of interview spots. Among all the objective variables we analyzed, Step 2 score appeared to be the only one that correlated with Step 1 score. The correlation between the two was only moderate (r = .67), which is consistent with prior literature. 17 We originally hypothesized that due to our sample consisting only of applicants to a highly competitive specialty, students who scored lower on Step 1 might score higher on Step 2 in an effort to compensate. On the other hand, we theorized that Step 2 scores could be lower for those who scored well on Step 1, as those applicants may not have felt as motivated or thought they had less to prove. However, the data showed otherwise. The subgroup regression slopes (0.566, 0.583, and 0.469 for low, middle, and high tier, respectively) were all very similar to the slope of the overall regression (0.69), suggesting that students tend to perform consistently across the two exams.
Analysis of the applicant distributions centered on a cutoff of 240 for both Step 1 and Step 2 revealed that screening applicants based on a Step 2 cutoff of 240 would result in a different pool of candidates being selected than that from a Step 1 cutoff of 240. Out of the 928 applications, a total of 798 applicants had both Step 1 and Step 2 scores (7 applicants had neither Step 1 or Step 2 score, and 123 applicants had Step 1 but no Step 2 score). Table 3 outlined the number of applicants in each quadrant defined in Figure 2. If using Step 1 score at 240 as cutoff, 562 (Q2 + Q4) applicants would be selected, which constitutes 70.43% [562/798] of total applicants. If using Step 2 score at 240 as cutoff, 155 applicants (Q1) will be added to the pool, representing 19.42% [155/798] of total applicants, while 24 applicants (Q4) will be excluded from the pool, which is 3% [24/798] of total applicants. Compared to the pool selected using Step 1 cutoff of 240, there would be a 23.3% [(155–24)/562] increase in the number of selected candidates when using Step 2 cutoff of 240.
TABLE 3.
Using a Step 2 cutoff of 240 would rseult in a candidate pool that is about 23.3% more than a pool selected using a Step 1 cutoff of 240
| Quadrant | Score range | Number of applicants |
|---|---|---|
| Quadrant I (Q1) | Step 1 < 240, Step 2 ≥ 240 | 155 |
| Quadrant II (Q2) | Step 1 ≥ 240, Step 2 ≥ 240 | 538 |
| Quadrant III (Q3) | Step 1 < 240, Step 2 < 240 | 81 |
| Quadrant IV (Q4) | Step 1 ≥ 240, Step 2 < 240 | 24 |
| Total applicants with both Step 1 and Step 2 scores | 798 | |
Note: Compared to the pool selected based on a Step 1 cutoff of 240, using Step 2 score at 240 as cutoff would result in an additional 155 applicants (Q1) but a reduction of 24 applicants (Q4), amounting to a 23.3% [(Q1 − Q4)/(Q2 + Q4)] increase in the number of selected candidates.
To obtain a similar number of applicants from Step 2 screening as that from Step 1, we had to raise the cutoff for Step 2 by almost 10 points from the 240 benchmark—561 applicants had Step 2 scores at or above a cutoff of 249. However, obtaining a similar number of applicants using an adjusted Step 2 cutoff does not imply that programs can squarely replace Step 1 with Step 2 scores in their screening of candidates and expect to receive the same applicant pool as before. Table 4 outlines the number of applicants in the respective quadrants defined in Figure 2 except with Step 1 cutoff of 240 and Step 2 cutoff of 249. If using Step 2 score at 249 as cutoff, 89 applicants (Q1′), or 11.15% [89/798] of total applicants, will be added to the pool, and 90 applicants (Q4′), or 11.28% [90/798] of total applicants, will be excluded from the pool. Taken together, using Step 2 cutoff of 249 would result in barely any change—0.13% decrease—in the number of selected candidates with respect to the pool selected using Step 1 cutoff of 240. This result suggests that given a future Step 2 score distribution, there likely will be a Step 2 cutoff that could lead to a similar number of applicants using the original Step 1 cutoff of 240. However, because the numbers of applicants in Quadrants I′ and IV′ are non‐zero, screening applicants based on the adjusted Step 2 cutoff would still result in a different pool of applicants compared to that from a Step 1 cutoff of 240.
TABLE 4.
Screening applicants using a Step 2 cutoff of 249 would result in an applicant pool that is similar in size—but different in composition—compared to the pool from Step 1 cutoff of 240
| Quadrant | Score range | Number of applicants |
|---|---|---|
| Quadrant I′ (Q1′) | Step 1 < 240, Step 2 ≥ 249 | 89 |
| Quadrant II′ (Q2′) | Step 1 ≥ 240, Step 2 ≥ 249 | 472 |
| Quadrant III′ (Q3′) | Step 1 < 240, Step 2 < 249 | 147 |
| Quadrant IV′ (Q4′) | Step 1 ≥ 240, Step 2 < 249 | 90 |
| Total applicants with both Step 1 and Step 2 scores | 798 | |
Note: There were 562 applicants (Q2′ + Q4′) with Step 1 scores at or above 240 and 561 applicants (Q1′ + Q2′) with Step 2 scores at or above 249. Although the similar number of applicants in Quadrant I′ and Quadrant IV′—89 and 90, respectively—rendered the resulting two applicant pools to be similar in size, the fact that they are non‐zero indicates that the candidates chosen using Step 2 cutoff at 249 would be different from that using Step 1 cutoff at 240.
While one of the major reasons cited for transitioning Step 1 to pass/fail was to reduce stress and burnout in medical students, we are concerned this may have the opposite effect, especially for those applying to competitive specialties. For one, students who did poorly on Step 1 no longer have a “second chance” by improving on Step 2. In the realm of standardized assessment, students now only have one test to prove their test‐taking abilities to their prospective residency programs. Additionally, the time for a candidate to determine whether they are competitive enough for their desired specialty becomes severely compressed, as most students do not take Step 2 until after their third year of medical school—just a few months before ERAS applications are due. Furthermore, medical school pedigree will likely be more heavily scrutinized in the absence of Step 1 score. Candidates from smaller institutions with less name recognition hoping to apply to competitive specialties will no longer be able to stand out with a high Step 1 score, putting more weight on a program's name and ranking. Despite the potential stressors associated with changing Step 1 to pass/fail, we can see this transition as an opportunity to adjust our selection criteria to a broader and more holistic paradigm that would better screen applicants for preparedness for residency programs. For example, programs can put more emphasis on applicants' clinical proficiency, research performance, and leadership experiences. In particular, increasing the breadth and depth of research will likely become an especially important factor for applicants who aspire to join institutions with a mission to train academicians. With Step 1 being pass/fail, students will be able to devote more energy on strengthening their critical thinking and problem‐solving skills through research outside of the standard medical curriculum.
The major limiting factor of our study was that the applications we analyzed were composed solely of applications to the UNC Otolaryngology/Head and Neck Surgery residency program. However, the UNC Otolaryngology/Head and Neck Surgery residency program receives applications from the majority (85%) of all Otolaryngology/Head and Neck Surgery residency applicants in the country. As such, our result and conclusion are applicable to Otolaryngology/Head and Neck Surgery residency programs and to other highly competitive specialties. Another limitation was that not all applicants had Step 2 score, as it was not mandatory for residency application. About 86% of the applications had Step 2 scores.
Future studies can investigate how the composition of future residency candidates and the accepted cohorts compare to their corresponding groups prior to Step 1 changing to pass/fail. For otolaryngology programs, one could assess residents' scores on the Otolaryngology Training Exam and the board passing rate to see how residents' performances are affected. It could also be valuable to examine whether and how the new selection paradigm affects the training of future clinicians.
5. CONCLUSION
In future match cycles, residency programs will need to adopt new methods to screen candidates. Step 1 scores were moderately correlated with Step 2 scores, but not with any other variable. With Step 1 becoming pass/fail, Step 2 stands to be the only standardized and objective metric that remains on residency applications. However, utilizing Step 2 scores for screening will result in selection of a different applicant pool. Programs are encouraged to adopt broader and more holistic screening paradigms that would better select applicants for preparedness for residency programs.
CONFLICT OF INTEREST
No authors have any financial conflicts of interest.
Supporting information
Figure S1: Diagnostic plots for linear regression between Step 1 and Step 2 scores
Figure S2: Correlation coefficients between all metrics
Table S1: Statistics of potential screening metrics, all applicants (n = 928)
Table S2: Applicant demographics, combined cycles
Table S3: Applicant characteristics by cycle
Table S4: Potential screening metrics
ACKNOWLEDGMENTS
The project described was supported by National Institutes of Health grants KL2TR002490 to AJK. The content is solely the responsibility of the authors and does not necessarily represent the official views of the NIH.
Berk GA, Ho TD, Stack‐Pyle TJ, et al. The next step: Replacing step 1 as a metric for residency application. Laryngoscope Investigative Otolaryngology. 2022;7(6):1756‐1761. doi: 10.1002/lio2.947
Garrett A. Berk and Tiffany D. Ho: Co‐first authors.
Christine E. DeMason, Adam J. Kimple and Brent A. Senior: Co‐senior contributing authors.
Funding information National Institutes of Health, Grant/Award Number: KL2TR002490 to AJK
REFERENCES
- 1. United States Medical Licensing Examination . Invitational conference on USMLE scoring. Change to Pass/Fail Score Reporting for Step 1. https://www.usmle.org/incus/#decision.
- 2. Results of the 2018 NRMP Program Director Survey . 2018. https://www.nrmp.org/wp-content/uploads/2018/07/NRMP-2018-Program-Director-Survey-for-WWW.pdf.
- 3. National Board of Medical Examiners . National board examinations, use of scores in residency selection, and staff changes. Natl Board Exam. 1988;35:3. [Google Scholar]
- 4. Nungester RJ, Dawson‐Saunders B, Kelley PR, Volle RL. Score reporting on NBME examinations. Acad Med. 1990;65(12):723‐729. doi: 10.1097/00001888-199012000-00002 [DOI] [PubMed] [Google Scholar]
- 5. Bowles LT, Melnick DE, Nungester RJ, et al. Review of the score‐reporting policy for the United States medical licensing examination. Acad Med. 2000;75(5):426‐431. doi: 10.1097/00001888-200005000-00008 [DOI] [PubMed] [Google Scholar]
- 6. Rozenshtein A, Mullins ME, Marx MV. The USMLE step 1 pass/fail reporting proposal: the APDR position. Acad Radiol. 2019;26(10):1400‐1402. doi: 10.1016/j.acra.2019.06.004 [DOI] [PubMed] [Google Scholar]
- 7. Fening K, Vander Horst A, Zirwas M. Correlation of USMLE step 1 scores with performance on dermatology in‐training examinations. J Am Acad Dermatol. 2011;64(1):102‐106. doi: 10.1016/j.jaad.2009.12.051 [DOI] [PubMed] [Google Scholar]
- 8. Thundiyil JG, Modica RF, Silvestri S, Papa L. Do United States medical licensing examination (USMLE) scores predict in‐training test performance for emergency medicine residents? J Emerg Med. 2010;38(1):65‐69. doi: 10.1016/j.jemermed.2008.04.010 [DOI] [PubMed] [Google Scholar]
- 9. Spurlock DR Jr, Holden C, Hartranft T. Using United States medical licensing examination(®) (USMLE) examination results to predict later in‐training examination performance among general surgery residents. J Surg Educ. 2010;67(6):452‐456. doi: 10.1016/j.jsurg.2010.06.010 [DOI] [PubMed] [Google Scholar]
- 10. Kenny S, McInnes M, Singh V. Associations between residency selection strategies and doctor performance: a meta‐analysis. Med Educ. 2013;47(8):790‐800. doi: 10.1111/medu.12234 [DOI] [PubMed] [Google Scholar]
- 11. Grewal SG, Yeung LS, Brandes SB. Predictors of success in a urology residency program. J Surg Educ. 2013;70(1):138‐143. doi: 10.1016/j.jsurg.2012.06.015 [DOI] [PubMed] [Google Scholar]
- 12. Shellito JL, Osland JS, Helmer SD, Chang FC. American Board of Surgery examinations: can we identify surgery residency applicants and residents who will pass the examinations on the first attempt? Am J Surg. 2010;199(2):216‐222. doi: 10.1016/j.amjsurg.2009.03.006 [DOI] [PubMed] [Google Scholar]
- 13. Sutton E, Richardson JD, Ziegler C, Bond J, Burke‐Poole M, McMasters KM. Is USMLE step 1 score a valid predictor of success in surgical residency? Am J Surg. 2014;208(6):1029‐1034. doi: 10.1016/j.amjsurg.2014.06.032 [DOI] [PubMed] [Google Scholar]
- 14. Burish MJ, Fredericks CA, Engstrom JW, Tateo VL, Josephson SA. Predicting success: what medical student measures predict resident performance in neurology? Clin Neurol Neurosurg. 2015;135:69‐72. doi: 10.1016/j.clineuro.2015.05.007 [DOI] [PubMed] [Google Scholar]
- 15. Harfmann KL, Zirwas MJ. Can performance in medical school predict performance in residency? A compilation and review of correlative studies. J Am Acad Dermatol. 2011;65(5):1010‐1022.e2. doi: 10.1016/j.jaad.2010.07.034 [DOI] [PubMed] [Google Scholar]
- 16. Puscas L. Viewpoint from a program director they Can't all walk on water. J Grad Med Educ. 2016;8(3):314‐316. doi: 10.4300/JGME-D-16-00237.1 [DOI] [PMC free article] [PubMed] [Google Scholar]
- 17. Bigach SD 2nd, Johnson DJ, Patt JC, Beal MD. Rate of USMLE step 2 CK scores included on orthopedic surgery applications and associations with step 1 score. Cureus. 2021;13(5):e15008. doi: 10.7759/cureus.15008 [DOI] [PMC free article] [PubMed] [Google Scholar]
Associated Data
This section collects any data citations, data availability statements, or supplementary materials included in this article.
Supplementary Materials
Figure S1: Diagnostic plots for linear regression between Step 1 and Step 2 scores
Figure S2: Correlation coefficients between all metrics
Table S1: Statistics of potential screening metrics, all applicants (n = 928)
Table S2: Applicant demographics, combined cycles
Table S3: Applicant characteristics by cycle
Table S4: Potential screening metrics