

Abstract
Objective
The COVID‐19 pandemic drove the need for remote audiometric testing in the form of mobile applications for hearing assessment. This study sought to determine the accuracy of two smartphone‐based hearing assessment applications, Mimi and uHear, against the gold standard of in‐clinic audiometric testing.
Methods
One hundred patients that presented to clinic for hearing assessment were randomly assigned to take either the Mimi or uHear hearing test alongside standard audiometric testing. Hearing thresholds measured using mobile applications were compared to those from audiometric testing to assess validity. Patient satisfaction was measured using a questionnaire that queried if the app met the user's need, if they would recommend the app to others, and how likely they were to use the app again.
Results
Using Mimi, there were no differences in average hearing levels measured at any frequency when compared to standard audiometric testing. uHear overestimated hearing loss at 500 and 1000 Hz (p < .001 for both) by 5–10 Hz, and underestimated hearing loss at 6000 Hz (p < .001) by 5–10 Hz compared to standard audiometric testing. When stratified by level of hearing impairment, uHear overestimated impairment in those with normal hearing (p < .001). Mimi had higher sensitivity (0.971) and specificity (0.912) for hearing loss (defined as a pure tone average for 500, 1000, 2000, and 4000 Hz greater than 25 dB) than uHear (0.914 and 0.780, respectively). However, uHear outranked Mimi on all three questions in the satisfaction questionnaire (p = .01, p = .03, and p = .02, respectively).
Conclusion
Mimi appears to be a reasonable substitute for standard audiometric testing when individuals cannot present to clinic for gold standard testing; however, the Mimi user experience can be improved.
Level of evidence
Level II.
Keywords: audiometry, hearing loss, hearing test, mobile applications, validation
The COVID‐19 pandemic drove the need for remote audiometric testing in the form of mobile applications for hearing assessment. The objective of this study is to validate two smartphone‐based hearing assessment applications, Mimi and uHear, against the gold standard of in‐clinic audiometric testing. Overall, Mimi appears to be a reasonable substitute for standard audiometric testing when individuals are unable to present to clinic for gold standard testing; however, the user experience can be further improved.
1. INTRODUCTION
Hearing loss is extremely prevalent with increasing age, affecting over 25% of patients older than 70 years and over 40% of patients older than 80 years of age. 1 This disabling condition causes a significant social and economic burden, and is thus important to identify and address. 2 Formal audiometric testing is the gold standard for diagnosing hearing loss and monitoring treatment. However, conducting this assessment requires in‐person attendance at an audiology clinic, which creates accessibility issues for many individuals, including those in rural settings, 3 older adults with reduced mobility/resources, and those from marginalized socioeconomic groups, such as migrant agricultural workers. 4 Furthermore, the COVID‐19 pandemic resulted in the closure of many outpatient audiology and otolaryngology offices, exacerbating existing barriers in access to audiometric testing and driving the need for remote audiometric testing. 5
Many practices turned to smartphone‐based hearing applications during the COVID‐19 pandemic, allowing patients to assess their hearing at home and send the results of the examination to the physician for next steps. 5 However, few applications have been validated against the gold standard method. In fact, a recent study reported that just seven of a total of 44 mobile applications available for hearing testing on iOS/Android platforms have been validated. 5 Given that these mobile applications have a high potential for continued use due to the expansion of telehealth in audiology and otology‐neurotology, there is a need to establish accuracy of existing remote hearing testing platforms, and also determine potential limitations of the existing technology to drive future research and development.
The primary aim of this study is to validate the two smartphone‐based hearing assessment applications most commonly used by otolaryngologists/audiologists at our institution, Mimi and uHear, against the gold standard of in‐clinic audiometric testing. Whereas the uHear application has been previously studied, the accuracy of the Mimi application has never before been measured. 6 , 7 This study will help determine whether remote hearing assessment can become a more standard fixture of otolaryngology practices; this could improve and expand access to hearing loss testing. A secondary aim of this study is to identify shortcomings/potential areas for improvement from both patient and provider perspectives in these widely‐used smartphone applications as a basis for the future development of better, more robust smartphone hearing assessment applications.
2. MATERIALS AND METHODS
2.1. Study design/participants
This is a Johns Hopkins School of Medicine Institutional Review Board‐approved prospective cross‐sectional investigation of patients presenting to the Johns Hopkins Department of Otolaryngology Head & Neck Surgery clinic, which offers comprehensive hearing care, hearing testing, and hearing aids/assisted listening devices to patients with hearing loss. One hundred adult participants (N = 100) were divided into two groups: one group completed the audiometric booth test and the Mimi application (Mimi Hearing Technologies, Berlin, Germany) hearing screening (N = 50) and the second group completed the audiometric booth test and the uHear application (Unitron, Kitchener, Ontario) hearing screening (N = 50). Only iOS mobile applications were tested in this study due to better calibration with the Apple earbuds used by the team. 5 Participants for this study were recruited by two study team audiologists from the Johns Hopkins Department of Otolaryngology Head & Neck Surgery, Division of Audiology. All participants were unpaid volunteers and signed the Johns Hopkins Institutional Review Board approved consent form prior to participation. All testing was completed at the Johns Hopkins Department of Otolaryngology Head & Neck Surgery clinic in Baltimore, Maryland.
Selection criteria included the following: (1) age 18 years or older; (2) free of active otologic disease as determined by tympanometry results classified according to ASHA (1900) standards; (3) unoccluded ears on the day of testing based on otoscopy; (4) normal hearing or any degree of sensorineural hearing loss, based on audiometric booth testing for the frequencies of 250–8000 Hz bilaterally (ASHA 1978); 8 and (5) ability to perform audiometric tasks (English‐speaking, no language impairments).
2.2. Study procedure
All participants were free of active otologic disease on the day of testing based on otoscopy and tympanometry results. Otoscopy was completed by utilizing a handheld otoscope with a disposable speculum and placed at the opening of the external auditory canal (EAC). Study team audiologists visualized participants' tympanic membranes (TMs) to confirm that they were intact bilaterally, with no swelling or redness on the TMs, EACs, or auricles. Tympanometry was performed using two Grason‐Stadler (GSI) Tympstar Model 33 tympanometers (serial numbers AL083928 and GS0045589). The tympanometers were calibrated in October of 2020. All participants were tested while seated in a double‐walled, sound‐treated booth. Two, two‐channel GSI Audiostar Pro audiometers (serial numbers GS0078454 and GS0078457), calibrated in October of 2020, were used to determine pulsed, pure‐tone air conduction thresholds. Thresholds were measured for the frequencies of 250, 500, 1000, 2000, 3000, 4000, 6000, and 8000 Hz bilaterally utilizing ER‐3A insert earphones for each participant. The pulsed, pure‐tones were presented using the descending method as described in 1978 ASHA guidelines for pure‐tone air conduction threshold audiometry. Bone conduction thresholds were completed in the same manner for frequencies at 500, 1000, 2000, and 4000 Hz with appropriate masking when necessary.
2.3. Smartphone‐based hearing screening
Individuals that agreed to participate in the study were then asked at random to either complete the Mimi smartphone‐based application hearing test or uHear smartphone‐based application hearing test. The applications were pre‐downloaded from the Apple Store onto an iPhone X or iPhone 11 Pro with Apple earbuds that were provided by the study team. The participants were placed in a relatively quiet location (but not in the soundproof booth, to better approximate conditions at home where participants would normally take the smartphone‐based app test) within the clinic to complete the test. The participants followed the application instructions for completion of the smartphone‐based hearing screening. The Mimi Pure Tone Threshold test determines the lowest intensity sound that the participant can detect in the absence of any other masking noise. The test utilizes the Békésy method, requiring the user to press and hold down a button for as long as they can hear a tone that is played, and to release the button when they can no longer hear the tone. The results are displayed for the frequencies of 250, 500, 1000, 2000, 4000, and 8000 Hz for the right and left ear independently. The uHear hearing sensitivity test also emulates audiometric booth testing by determining the quietest sounds the user can hear. The user is instructed to tap a button every time they hear a tone. The results are displayed for the frequencies of 500, 1000, 2000, 4000, and 6000 Hz for the right and left ear independently.
2.4. Questionnaire
Upon completion of the hearing tests, a subset of participants (the 20 participants following the 10th participant in each group) was administered three questions from the Client Satisfaction Questionnaire to assess user satisfaction with the mobile applications: (1) Did the Mimi/uHear screening app meet your need of assessing hearing sensitivity?; (2) How likely are you to recommend a family member or friend to use this app?; (3) How likely are you to use this app again? These questions were scored on a 4‐point scale whereby higher scores indicated greater satisfaction: 1 = my need was not met, quite dissatisfied; 2 = my need was only partially met, mildly dissatisfied; 3 = my need was mostly met, mostly satisfied; 4 = my need was fully met, very satisfied. 9 Participants were also queried for qualitative feedback on their experience with the Mimi and uHear screening applications. The questionnaire was administered to a subset of 20 participants for each screening application rather than the whole sample to explore participant responses, to limit overall participant burden. In addition to the questionnaire, qualitative verbal and written commentary on user preferences were collected from any participants that had further thoughts that they wanted to share.
2.5. Statistical analysis
All analyses were completed using StataCorp version 16.1 (StataCorp, College Station, TX). Paired Student t‐tests were used to compare average hearing threshold results at the different frequencies for various study samples (audiometric testing results vs. uHear mobile application testing results for the right and left ear separately, for example) and to compare respective pure tone averages (PTAs), which were calculated by averaging the decibel level measured at 500, 1000, 2000, and 4000 Hz. 10 Student t‐tests were used to compare the average results of each rating question in the questionnaire. Sensitivity, specificity, positive predictive value (PPV), and negative predictive value (NPV) of the two mobile applications for identifying hearing loss were determined based on PTA hearing test results. Hearing loss was determined for the right and left ears separately, and was defined as a PTA greater than 25 dB. In the calculations for sensitivity, specificity, PPV, and NPV, the true positives for hearing loss were taken as those who were determined to have hearing loss based on standard audiometric testing PTAs; that is, audiometric testing was considered the gold standard. The two‐tailed threshold for statistical significance was 0.05.
3. RESULTS
3.1. Demographics of the whole cohort
Descriptive statistics of the cohort are presented in Table 1. The cohort consisted of 100 adult participants with a mean age (SD) of 52.9 (17.1) years. The participants who took the uHear smartphone hearing application test had a mean age (SD) of 56.4 (17.3) years and those who took the Mimi smartphone hearing application test had a mean age (SD) of 49.4 (16.3) years. Participants who took the uHear hearing test were significantly older than those who took the Mimi test (p = .04). Of the 100 total participants, 68 (68.0%) were female. Of the 50 participants that participated in hearing testing using uHear, 35 (70.0%) were female, whereas 33 (66.0%) of the participants who took Mimi were female.
TABLE 1.
Characteristics of patients (n = 100)
| Age—mean (SD) | 52.9 (17.1) |
| uHear | 56.4 (17.3) |
| Mimi | 49.4 (16.3) |
| Female sex— n (%) | 68 (68%) |
| uHear | 35 (70%) |
| Mimi | 33 (66%) |
3.2. Standard audiometric testing versus Mimi mobile application testing
The hearing level results for the group of participants that took the Mimi mobile application hearing test are presented in Tables 2 and 3, stratified by right and left ear, respectively. Their results from standard audiometric testing were compared to their results from the Mimi mobile application. For both the right and left ears, whereas there appears to be a small difference of 2–3 dB at lower frequencies (250, 500, and 1000 Hz), there was no significant difference between the average hearing levels measured using standard audiometric testing or using the Mimi mobile application at any frequency. Figure 1 displays the data as Bland–Altman plots, which better portrays the mild disagreement between audiometric testing and the Mimi app at lower frequencies, but also shows that at higher frequencies, Mimi estimates hearing thresholds well (the average difference line lies at or very close to 0 for 1000 Hz and above).
TABLE 2.
Right ear results (dB) with standard audiometric testing (gold standard) versus Mimi hearing test app (n = 50)
| Audiometric testing (n = 50) | Mimi mobile app (n = 50) | p value | |
|---|---|---|---|
| 250 Hz—mean (95% CI) | 19.2 (0.0–41.8) | 20.9 (0.0–51.1) | .22 |
| 500 Hz—mean (95% CI) | 20.0 (0.0–43.0) | 22.2 (0.0–51.0) | .12 |
| 1000 Hz—mean (95% CI) | 20.4 (0.0–45.8) | 22.2 (0.0–50.8) | .16 |
| 2000 Hz—mean (95% CI) | 25.7 (0.0–61.5) | 27.1 (0.0–63.7) | .25 |
| 4000 Hz—mean (95% CI) | 31.3 (0.0–78.1) | 31.4 (0.0–74.0) | .93 |
| 8000 Hz—mean (95% CI) | 35.3 (0.0–86.7) | 34.8 (0.0–82.6) | .75 |
| PTA a —mean (95% CI) | 24.7 (0.0–55.3) | 26.0 (0.0–58.0) | .21 |
Pure tone average (average decibel level for 500, 1000, 2000, and 4000 Hz).
TABLE 3.
Left ear results (dB) with standard audiometric testing (gold standard) versus Mimi hearing test app (n = 49)
| Audiometric testing (n = 49) | Mimi mobile app (n = 49) | p value | |
|---|---|---|---|
| 250 Hz—mean (95% CI) | 20.7 (0.0–50.7) | 22.8 (0.0–58.2) | .14 |
| 500 Hz—mean (95% CI) | 20.7 (0.0–47.1) | 23.4 (0.0–57.4) | .07 |
| 1000 Hz—mean (95% CI) | 21.6 (0.0–51.2) | 23.6 (0.0–60.8) | .16 |
| 2000 Hz—mean (95% CI) | 27.6 (0.0–64.8) | 28.0 (0.0–68.2) | .67 |
| 4000 Hz—mean (95% CI) | 31.3 (0.0–73.9) | 31.6 (0.0–76.0) | .73 |
| 8000 Hz—mean (95% CI) | 33.8 (0.0–85.4) | 31.8 (0.0–81.0) | .11 |
| PTA a —mean (95% CI) | 25.8 (0.0–58.8) | 27.1 (0.0–64.7) | .18 |
Pure tone average (average decibel level for 500, 1000, 2000, and 4000 Hz).
FIGURE 1.
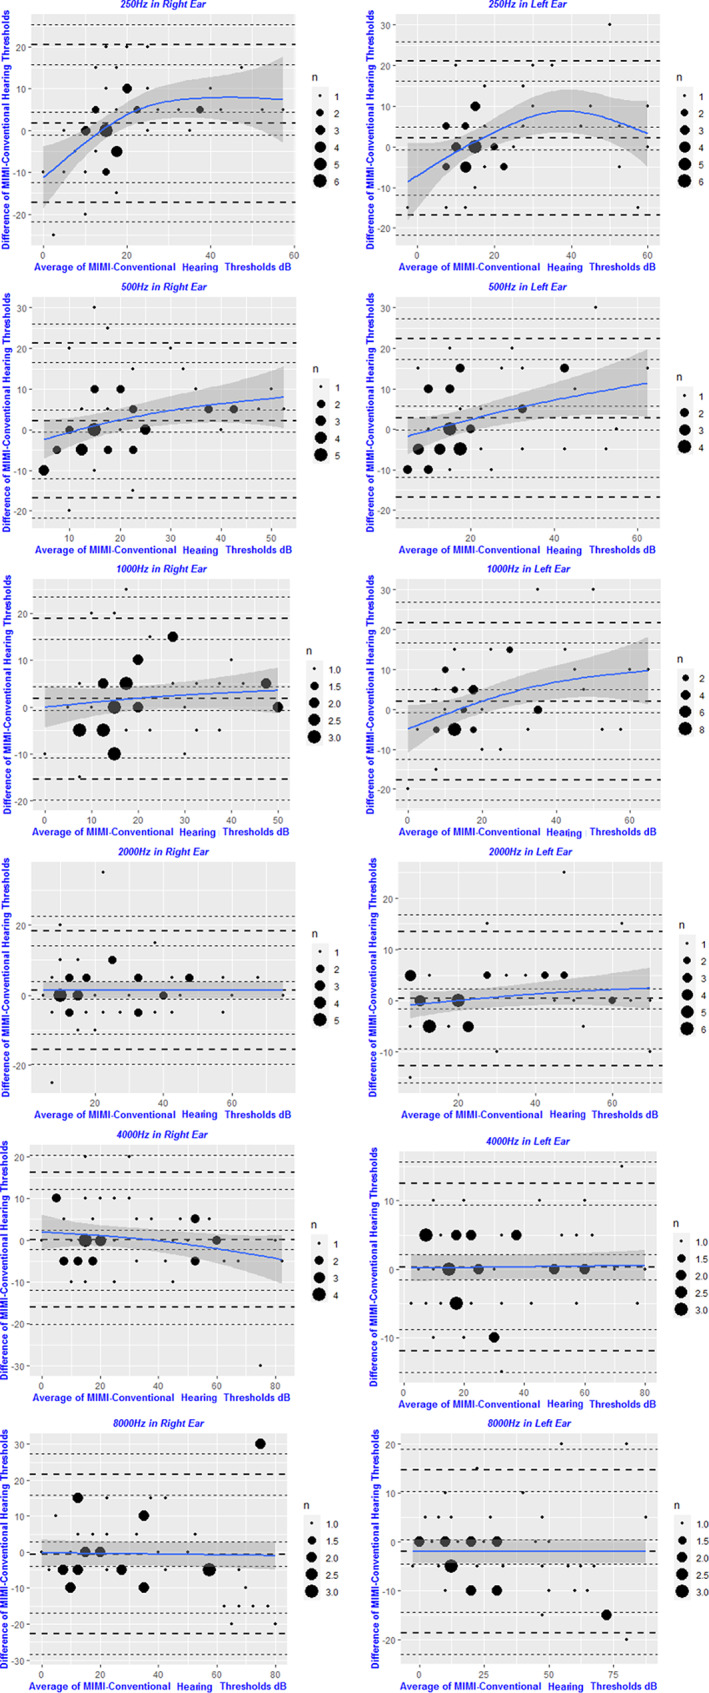
Bland–Altman plots comparing audiometric results for standard audiometric testing versus the Mimi hearing test app, for both right and left ears. There is slightly more disagreement between audiometric testing and the Mimi app at lower frequencies (250–1000 Hz). At higher frequencies, the Mimi app appears to estimate hearing thresholds well
3.3. Standard audiometric testing versus uHear mobile application testing
The hearing levels for the group of participants that took the uHear mobile application hearing test are presented in Tables 4 and 5, stratified by right and left ear, respectively. Their results from standard audiometric testing were compared to their results from the uHear mobile application. For both the right and left ears, the uHear mobile application measured a significantly higher hearing threshold at 500 Hz (p < .001 for both ears) and 1000 Hz (p < .001 for both ears) compared to standard audiometric testing, thus overestimating hearing loss at these frequencies. In contrast, at 6000 Hz, the uHear mobile application measured a significantly lower hearing threshold relative to standard audiometric testing, thus underestimating hearing loss at the highest frequency (p < .001 for both ears). When comparing the PTA for the right and left ears, uHear measured a significantly higher PTA than standard audiometric testing, thus overestimating hearing impairment (p < .001 for both ears). Figure 2 displays the data as Bland–Altman plots. At 250–1000 Hz, uHear appears to systematically overestimate hearing loss by 5–10 Hz. At 2000 Hz, uHear appears to estimate hearing thresholds well. Above 2000 Hz, there is more disagreement between audiometric testing and the uHear app, and uHear appears to generally underestimate hearing loss at these higher frequencies, because the average difference line lies below 0.
TABLE 4.
Right ear results (dB) with standard audiometric testing (gold standard) versus uHear hearing test app (n = 50)
| Audiometric testing (n = 50) | uHear mobile app (n = 50) | p value | |
|---|---|---|---|
| 500 Hz—mean (95% CI) | 16.5 (0.0–34.5) | 25.3 (0.0–57.3) | <.001 |
| 1000 Hz—mean (95% CI) | 19.8 (0.0–44.6) | 26.0 (0.0–71.4) | <.001 |
| 2000 Hz—mean (95% CI) | 21.6 (0.0–51.2) | 21.1 (0.0–49.7) | .69 |
| 4000 Hz—mean (95% CI) | 24.3 (0.0–59.9) | 24.3 (0.0–56.9) | >.99 |
| 6000 Hz—mean (95% CI) | 27.1 (0.0–69.1) | 20.8 (0.0–63.4) | <.001 |
| PTA a —mean (95% CI) | 20.6 (0.0–43.8) | 24.2 (0.0–48.0) | <.001 |
Note: Bold values significes p < 0.05.
Pure tone average (average decibel level for 500, 1000, 2000, and 4000 Hz).
TABLE 5.
Left ear results (dB) with standard audiometric testing (gold standard) versus uHear hearing test app (n = 50)
| Audiometric testing (n = 50) | uHear mobile app (n = 50) | p value | |
|---|---|---|---|
| 500 Hz—mean (95% CI) | 22.3 (0.0–60.3) | 29.1 (0.0–70.1) | <.001 |
| 1000 Hz—mean (95% CI) | 23.2 (0.0–59.8) | 32.0 (0.0–65.8) | <.001 |
| 2000 Hz—mean (95% CI) | 23.8 (0.0–59.6) | 24.8 (0.0–58.0) | .42 |
| 4000 Hz—mean (95% CI) | 28.8 (0.0–68.4) | 27.1 (0.0–65.1) | .06 |
| 6000 Hz—mean (95% CI) | 30.7 (0.0–75.7) | 21.8 (0.0–61.2) | <.001 |
| PTA a —mean (95% CI) | 24.5 (0.0–57.3) | 28.3 (0.0–60.1) | <.001 |
Note: Bold values significes p < 0.05.
Pure tone average (average decibel level for 500, 1000, 2000, and 4000 Hz).
FIGURE 2.
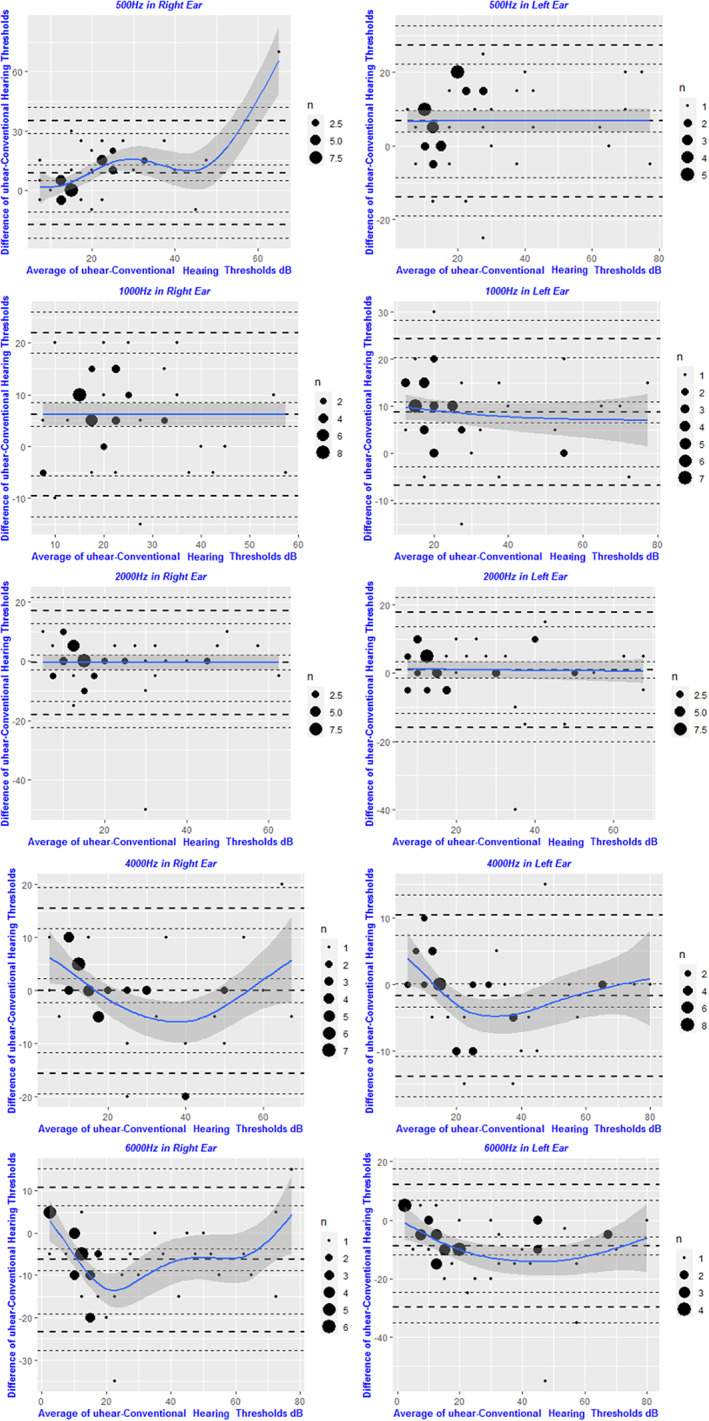
Bland–Altman plots comparing audiometric results for standard audiometric testing versus uHear hearing test app, for both right and left ears. At 250–1000 Hz, uHear appears to systematically overestimate hearing loss by 5–10 Hz. At 2000 Hz, uHear appears to estimate hearing thresholds well. Above 2000 Hz, there is more disagreement between audiometric testing and the uHear app, and uHear appears to generally underestimate hearing loss at these higher frequencies
3.4. PTAs stratified by level of hearing loss
PTAs for participants using standard audiometric testing versus PTAs using the Mimi mobile application, stratified by level of hearing impairment, are presented in Table 6. Similarly, PTAs using the uHear mobile application compared to PTAs using standard audiometric testing, again stratified by level of hearing impairment, are presented in Table 7. Based on ASHA guidelines, normal hearing was defined as a PTA below 25 dB, mild hearing loss was defined as 25 dB < PTA < 40 dB, moderate hearing loss was defined as 40 dB < PTA < 70 dB, and profound hearing loss was defined as a PTA greater than 70 dB. No significant differences were found between the participants' PTAs calculated from the Mimi mobile application results and the PTAs calculated from their corresponding standard audiometric test results at any level of hearing impairment. In contrast, the PTAs calculated from the uHear mobile application in individuals with normal hearing were significantly higher than PTAs calculated from standard audiometric tests, thus overestimating hearing impairment in those with normal hearing (p < .001 for both left and right ears).
TABLE 6.
PTA (dB) with standard audiometric testing (gold standard) versus Mimi hearing test app for different hearing loss levels (n = 50 b )
| Audiometric testing (n = 50 b ) | Mimi mobile app (n = 50 b ) | Difference between Mimi and audiometry | p value | |
|---|---|---|---|---|
| Normal hearing a (right side n = 31, left side n = 30) | ||||
| Right ear PTA—mean (95% CI) | 14.2 (2.8–25.6) | 15.8 (0.0–32.8) | 1.6 | .32 |
| Left ear PTA—mean (95% CI) | 14.9 (4.1–25.7) | 15.2 (0.0–30.8) | 0.3 | .80 |
| Mild hearing loss a (right side n = 10, left side n = 9) | ||||
| Right ear PTA—mean (95% CI) | 34.6 (26.6–42.6) | 35.8 (26.2–45.4) | 1.2 | .44 |
| Left ear PTA—mean (95% CI) | 32.2 (21.0–43.4) | 33.9 (13.9–53.9) | 1.7 | .44 |
| Moderate hearing loss a (right side n = 9, left side n = 10) | ||||
| Right ear PTA—mean (95% CI) | 49.7 (36.3–63.1) | 50.3 (31.9–68.7) | 0.6 | .68 |
| Left ear PTA—mean (95% CI) | 50.7 (37.1–64.3) | 55.4 (35.8–75.0) | 4.7 | .11 |
Abbreviation: PTA, pure tone average.
Normal hearing = PTA < 25 dB; mild hearing loss = 25 dB < PTA < 40 dB, moderate hearing loss = 40 dB < PTA < 70 dB, profound hearing loss = PTA > 70 dB.
n = 49 for left side (one patient missing data for left side).
TABLE 7.
PTA (dB) with standard audiometric testing (gold standard) versus uHear hearing test app for different hearing loss levels (n = 50)
| Audiometric testing (n = 50) | uHear mobile app (n = 50) | Difference between uHear and audiometry | p value | |
|---|---|---|---|---|
| Normal hearing (right side n = 37, left side n = 33) | ||||
| Right ear PTA—mean (95% CI) | 14.5 (4.3–24.7) | 18.8 (7.0–30.6) | 4.3 | <.001 |
| Left ear PTA—mean (95% CI) | 15.0 (2.6–27.4) | 19.4 (7.8–31.0) | 4.4 | <.001 |
| Mild hearing loss (right side n = 9, left side n = 8) | ||||
| Right ear PTA—mean (95% CI) | 34.9 (26.1–43.7) | 39.2 (14.0–64.4) | 4.3 | .28 |
| Left ear PTA—mean (95% CI) | 30.5 (22.9–38.1) | 34.5 (22.5–46.5) | 4 | .22 |
| Moderate hearing loss (right side n = 4, left side n = 9) | ||||
| Right ear PTA—mean (95% CI) | 44.4 (37.2–51.6) | 40.3 (21.1–59.5) | −4.1 | .29 |
| Left ear PTA—mean (95% CI) | 54.2 (34.8–73.6) | 55.1 (26.7–83.5) | 0.9 | .73 |
Note: Bold values significes p < 0.05.
Abbreviation: PTA, pure tone average.
3.5. Sensitivity and specificity of uHear versus Mimi
The sensitivity and specificity of the hearing test mobile applications for identifying a hearing loss, stratified by right and left ear, are presented as a series in Table 8. For example, the sensitivity of Mimi in the right ear was 0.941, and was greater than the sensitivity of uHear in the right ear at 0.900. Similarly, the specificity of Mimi in the right ear was 0.909, which was greater than uHear's specificity of 0.825 in the right ear. These trends were preserved in the left ear as well. Overall, Mimi had a higher average sensitivity of 0.971 when compared to uHear's average sensitivity of 0.914. Mimi also had a greater average specificity of 0.9117 compared to uHear's average specificity of 0.7802. The average PPV of Mimi at 0.833 was also greater than uHear's average PPV at 0.577. Finally, Mimi's average NPV was 0.984, which was also greater than uHear's average NPV of 0.968.
TABLE 8.
Sensitivity/specificity analysis
| Sensitivity | Specificity | PPV | NPV | |
|---|---|---|---|---|
| Mimi test | ||||
| Right ear | 0.9412 | 0.9091 | 0.8421 | 0.9677 |
| Left ear | 1.0000 | 0.9143 | 0.8235 | 1.0000 |
| Average | 0.9706 | 0.9117 | 0.8328 | 0.9839 |
| uHear test | ||||
| Right ear | 0.9000 | 0.8250 | 0.5625 | 0.9706 |
| Left ear | 0.9286 | 0.7353 | 0.5909 | 0.9643 |
| Average | 0.9143 | 0.7802 | 0.5767 | 0.9675 |
Abbreviations: NPV, negative predictive value; PPV, positive predictive value.
3.6. Participant satisfaction with mobile applications
The results of the Client Satisfaction Questionnaire that was administered to a subset of the total participants are presented in Table 9. uHear significantly outperformed and outranked Mimi on all three questions in the survey (p = .01, p = .03, and p = .02 for question 1, 2, and 3, respectively). This user preference for uHear over Mimi aligned with verbal and written commentary that was collected from participants as well; many participants expressed that they preferred the test style of uHear over Mimi, as the beeping sounds they heard were similar to diagnostic audiometric testing. Participants that used the Mimi mobile application expressed that the test made them feel self‐conscious. Specifically, when the tone had to get louder because the patient could not hear it, the app would automatically pause and ask the participant if they were still present and actively taking the test when in actuality, the participant could simply not hear the tone. Additionally, participants seemed to appreciate the shorter test length of the uHear test (less than 5 min) compared to the longer length of the Mimi test (5–7 min). As a point of reference, standard audiometric testing typically takes 10–15 min.
TABLE 9.
uHear versus Mimi Client Satisfaction Questionnaire results (n = 40) a
| Mimi mobile app (n = 20) | uHear mobile app (n = 20) | p value | |
|---|---|---|---|
| Question 1—mean (SD) | 3.1 (0.8) | 3.7 (0.7) | .01 |
| Question 2—mean (SD) | 3.0 (0.9) | 3.6 (0.8) | .03 |
| Question 3—mean (SD) | 2.6 (1.0) | 3.4 (0.9) | .02 |
Note: Bold values significes p < 0.05.
These questions were scored on a 4‐point scale whereby higher scores indicated greater satisfaction: 1 = my need was not met, quite dissatisfied; 2 = my need was only partially met, mildly dissatisfied; 3 = my need was mostly met, mostly satisfied; 4 = my need was fully met, very satisfied.
Questionnaire consisted of the following three questions: (1) Did the Mimi/uHear screening app meet your need of assessing hearing sensitivity?; (2) How likely are you to recommend a family member or friend to use this app?; (3) How likely are you to use this app again?
4. DISCUSSION
The purpose of this study was to assess the accuracy of two widely‐used remote hearing testing platforms, uHear and Mimi, and also to determine potential limitations of the existing technology to drive future research and development. The results of this study illustrated that the Mimi application is more accurate than the uHear application, and should be considered for remote hearing testing, although at this time only for Apple iOS users because the Android version of the Mimi application was not studied. Of note, based on the patient satisfaction questionnaire that was administered, users preferred the uHear application experience over that of Mimi. Thus, research and development into future mobile applications for hearing testing could benefit from combining the accuracy of the Mimi algorithm with an improved user interface/experience inspired by desired features from uHear.
This is the first study to our knowledge assessing the accuracy of the Mimi mobile application for hearing testing as compared to standard audiometric testing. The results demonstrated that Mimi had a high sensitivity, specificity, PPV, and NPV, and no significant differences between the hearing levels it measured compared to those measured by standard audiometric testing, rendering it an accurate mobile application to use for remote hearing assessment. Interestingly, whereas the Mimi application had no statistically significant differences between the hearing level thresholds it measured and audiometric testing results (even when stratified by level of hearing loss), the application slightly overestimated hearing impairment at lower frequencies. This could be due to the fact that, because there are many different types of earbuds/headphones that are readily available to the user, not all types of these transducers are appropriately calibrated to the Mimi mobile application. Positioning of the earbud in the ear canal can also vary due to user placement and can sometimes create sound leakage due to an improper seal of the ear canal. Whereas the Apple earbuds that were used in this particular study were calibrated to the Apple iOS device that was used, the output could have been manipulated by earbud placement. The level of calibration that is coded into the Mimi application for particular earbud/phone operating system pairings is unknown. Further, whether the Mimi application standardizes for varying acoustic properties of each user's ear canals is also unknown. The Mimi application does utilize a calibration measure for phone output by instructing the user to adjust the phone volume to 50%, but this may be imperfect. Additionally, the middle ear cavity contains a small quantity of air that is much less compressible than ambient air, and thus has a higher acoustic impedance, or is “stiffer.” 11 This results in higher resistance to low frequency sounds, and thus reduces the amplitudes of low frequency sounds. This finding is more pronounced in frequencies below 500 Hz, but might still result in some attenuation at the lower frequencies measured by Mimi. Standard audiometry is calibrated to account for this phenomenon, but the Mimi application may not have the same level of sophistication, resulting in a corresponding slight overestimation of hearing loss at lower frequencies.
The uHear mobile application was both less sensitive to and less specific for hearing loss than the Mimi mobile application. The lower specificity was likely due to the high false positive rate that uHear was prone to. The uHear application tended to overestimate hearing impairment at lower frequencies by a clinically significant difference of greater than 5 dB. This might be due to the same reasons that the Mimi application overestimated hearing impairment at lower frequencies, including middle ear anatomical properties and a lack of headphone calibration, as discussed previously. Additionally, the uHear application did not specify an iPhone volume output as the Mimi application did, which could have contributed to inconsistency in testing. At 6000 Hz, the relationship flips and uHear underestimates hearing loss. Whereas there is no clear reason why uHear's relationship with audiometric testing might reverse, it is possible that the user interface of uHear might have prompted this bias. The uHear application has an indicator that flashes a red light when a tone is missed; because hearing is generally worse at higher frequencies, the indicator light could have been flashing more frequently at high frequencies, prompting users to react and press the button indicating that they heard a tone, even when they did not hear a tone. The increased frequency of button pressing at 6000 Hz in reaction to visual stimulus might have increased false positive rates for tones being detected and skewed uHear to underestimate hearing loss at 6000 Hz. Indeed, this was a common user concern that many participants in the study made note of to the researcher at the completion of the screening.
The uHear app has been tested for accuracy in many studies, producing mixed results. In this study, we measured a 91% sensitivity and a 78% specificity for uHear. Several studies reported findings similar to ours. Al‐Abri et al. (n = 70) reported that uHear was inconsistent even in a soundproof audiometric booth and lacked specificity in the range of normal hearing. 12 These results align with our findings; in addition to recording a moderate specificity of 78%, we found that when patients were stratified by level of hearing impairment, uHear significantly overestimated hearing impairment in those with normal hearing. Livshitz et al. (n = 60) determined that uHear did not accurately assess hearing thresholds, specifically in the elderly population. 13 Additionally, Abu‐Ghanem et al. (n = 26) determined that uHear was inaccurate at determining level of hearing loss, tending to an overestimate of hearing impairments at most frequencies. 14 Similar to the previous two studies, we found that the PTA measured using uHear indicated worse hearing impairment than the PTA measured using standard audiometric testing. Interestingly, several studies also reported results differing from ours. Lycke et al. (n = 33) found that uHear had a low specificity of 36.4% but a perfect sensitivity of 100%. 6 Szudek et al. (n = 100) determined that uHear was a reasonable screening test with 98% sensitivity and 82% specificity, greater than the sensitivity and specificity measured in this study. 7 However, they also reported that hearing thresholds were overestimated in those with normal hearing, which aligns with our findings. Handzel et al. (n = 32), along with Peer et al. (n = 25) and Wang et al. (n = 60), also found that hearing thresholds were more accurate at mid and high frequencies (2000, 4000, and 6000 Hz); our results corroborate the findings at mid‐frequencies, but not at 6000 Hz. 15 , 16 , 17 This level of variability in the results published on the accuracy of the uHear application suggests that the hearing sensitivity test it offers may not be suitable in its current state as a standard fixture of remote hearing assessment.
Despite the superiority of the Mimi mobile application over the uHear mobile application for accurate hearing testing, according to the results of the user satisfaction questionnaire, participants were more satisfied with the uHear application in terms of user interface and user experience than the Mimi application. This might have been due in part to the faster and simpler testing experience that the uHear application provided and the similar test format (pulse tone testing) to a standard audiometric booth test. On the other hand, the Mimi application tested hearing using a sweeping tone presentation in which a tone was played continuously at varying volumes. The user was instructed, as per the Békésy method, to press a button when they started hearing the tone, and release once they stopped hearing the tone. This was more complex than simply pressing the button upon hearing a pulsed tone, and was thus not as user‐friendly; however, this method may have improved accuracy. The Mimi application had a longer testing time due to frequent pop‐up messages that ascertained whether participants were consistently engaged in the hearing assessment. Whereas this frequent pop‐up interruption may have frustrated users, it also might have allowed for more accurate testing results from Mimi overall.
There were a number of limitations in this study. The accuracy of smartphone‐based mobile applications for hearing testing is dependent on the characteristics and quality of factors such as earbuds used for testing and ambient noise in the surrounding test environment. Thus, variability in these factors may preclude the generalization of some analyses presented in this study. However, the testing of both individuals with normal hearing and hearing‐impaired individuals in this study using the same equipment contrastingly strengthens the external validity. The use of foam inserts fitted to the earbuds might have improved the accuracy of the results attained from mobile application‐based hearing testing, as a more robust seal between the EAC and the surrounding environment would have been achieved. However, this would render the application less user‐friendly/accessible, as not all users would have such equipment available for remote hearing assessment. Further, we did not note whether participants had undertaken a hearing test before; this could be important due to a potential learning effect. Whereas this was somewhat nullified by the fact that app testing always took place after standard booth testing, there could still be a learning effect for both apps, and it could be different between both apps. On a separate note, the uHear application did not test hearing at frequencies above 6000 Hz, resulting in a relative lack of information on hearing at high frequencies. Finally, this study did not consider the Android version of the Mimi application (uHear is not available for Android devices). Future studies of the Mimi application can extend findings to Android devices to achieve a complete understanding of its accuracy for remote hearing assessment.
5. CONCLUSION
This study is the first to validate the Mimi mobile application for hearing testing and adds to the body of literature assessing the accuracy of the uHear mobile application. Further, to our knowledge, this is the only study characterizing user satisfaction with these mobile applications for hearing testing. Overall, Mimi appears to be a reasonable substitute for standard audiometric testing when individuals are unable to present to clinic for gold standard testing. Future development of mobile applications for hearing testing could aim to emulate Mimi's test accuracy but improve the user interface and user experience according to feedback from participants as presented in this study.
AUTHOR CONTRIBUTIONS
All authors participated in the design and conduct of the study and analysis of the data.
FUNDING INFORMATION
None.
CONFLICT OF INTEREST
None.
ACKNOWLEDGMENTS
None.
Yesantharao LV, Donahue M, Smith A, Yan H, Agrawal Y. Virtual audiometric testing using smartphone mobile applications to detect hearing loss. Laryngoscope Investigative Otolaryngology. 2022;7(6):2002‐2010. doi: 10.1002/lio2.928
Presented at: 2022 Triological Society Annual Meeting at COSM; Dallas, TX, USA; April 27–May 1, 2022.
REFERENCES
- 1. World Health Organization . World Report on Hearing. 2021. Accessed June 20, 2022. https://apps.who.int/iris/bitstream/handle/10665/339913/9789240020481-eng.pdf?sequence=1
- 2. Brown CS, Emmett SD, Robler SK, Tucci DL. Global hearing loss prevention. Otolaryngol Clin N Am. 2018;51(3):575‐592. doi: 10.1016/J.OTC.2018.01.006 [DOI] [PubMed] [Google Scholar]
- 3. Brennan‐Jones CG, Taljaard DS, Brennan‐Jones SEF, Bennett RJ, Swanepoel DW, Eikelboom RH. Self‐reported hearing loss and manual audiometry: a rural versus urban comparison. Aust J Rural Health. 2016;24(2):130‐135. doi: 10.1111/AJR.12227 [DOI] [PubMed] [Google Scholar]
- 4. Rabinowitz PM, Sircar KD, Tarabar S, Galusha D, Slade MD. Hearing loss in migrant agricultural workers. J Agromedicine. 2008;10(4):9‐17. doi: 10.1300/J096V10N04_04 [DOI] [PubMed] [Google Scholar]
- 5. Iracia AL, Sharma RK, Reed NS, Golub JS. Smartphone‐based applications to detect hearing loss: a review of current technology. J Am Geriatr Soc. 2021;69(2):307‐316. doi: 10.1111/JGS.16985 [DOI] [PMC free article] [PubMed] [Google Scholar]
- 6. Lycke M, Boterberg T, Martens E, et al. Implementation of uHear™—an iOS‐based application to screen for hearing loss—in older patients with cancer undergoing a comprehensive geriatric assessment. J Geriatr Oncol. 2016;7(2):126‐133. doi: 10.1016/J.JGO.2016.01.008 [DOI] [PubMed] [Google Scholar]
- 7. Szudek J, Ostevik A, Dziegielewski P, et al. Can Uhear me now? Validation of an iPod‐based hearing loss screening test. J Otolaryngol Head Neck Surg. 2012;31:78‐84. doi: 10.5001/OMJ.2016.27 [DOI] [PubMed] [Google Scholar]
- 8. Guidelines for manual pure‐tone threshold audiometry. ASHA. 1978;20(4):297‐301. [PubMed] [Google Scholar]
- 9. Larsen DL, Attkisson CC, Hargreaves WA, Nguyen TD. Assessment of client/patient satisfaction: development of a general scale. Eval Program Plann. 1979;2(3):197‐207. doi: 10.1016/0149-7189(79)90094-6 [DOI] [PubMed] [Google Scholar]
- 10. What the numbers mean: an epidemiological perspective on hearing | NIDCD. https://www.nidcd.nih.gov/health/statistics/what-numbers-mean-epidemiological-perspective-hearing.
- 11. Musiek FE, Baran JA. In: Dragin SD, ed. The Auditory System: Anatomy, Physiology, and Clinical Correlates. Pearson Eduation, Inc.; 2007:60‐63. [Google Scholar]
- 12. Al‐Abri R, Al‐Balushi M, Kolethekkat A, et al. The accuracy of IOS device‐based uHear as a screening tool for hearing loss: a preliminary study from the Middle East. Oman Med J. 2016;31(2):142‐145. doi: 10.5001/OMJ.2016.27 [DOI] [PMC free article] [PubMed] [Google Scholar]
- 13. Livshitz L, Ghanayim R, Kraus C, et al. Application‐based hearing screening in the elderly population. Ann Otol Rhinol Laryngol. 2017;126(1):36‐41. doi: 10.1177/0003489416672873 [DOI] [PubMed] [Google Scholar]
- 14. Abu‐Ghanem S, Handzel O, Ness L, Ben‐Artzi‐Blima M, Fait‐Ghelbendorf K, Himmelfarb M. Smartphone‐based audiometric test for screening hearing loss in the elderly. Eur Arch Otorhinolaryngol. 2016;273(2):333‐339. doi: 10.1007/S00405-015-3533-9 [DOI] [PubMed] [Google Scholar]
- 15. Peer S, Fagan JJ. Hearing loss in the developing world: evaluating the iPhone mobile device as a screening tool. S Afr Med J. 2015;105(1):35‐39. doi: 10.7196/SAMJ.8338 [DOI] [PubMed] [Google Scholar]
- 16. Wang JC, Zupancic S, Ray C, Cordero J, Demke JC. Hearing test app useful for initial screening, original research shows. Hear J. 2014;67(10):32. doi: 10.1097/01.HJ.0000455839.29274.D6 [DOI] [Google Scholar]
- 17. Handzel O, Ben‐Ari O, Damian D, Priel MM, Cohen J, Himmelfarb M. Smartphone‐based hearing test as an aid in the initial evaluation of unilateral sudden sensorineural hearing loss. Audiol Neurootol. 2013;18(4):201‐207. doi: 10.1159/000349913 [DOI] [PubMed] [Google Scholar]