

ABSTRACT
A critical barrier to codevelopment of tuberculosis (TB) regimens is a limited ability to identify optimal drug and dose combinations in early-phase clinical testing. While pharmacokinetic-pharmacodynamic (PKPD) target attainment is the primary tool for exposure-response optimization of TB drugs, the PD target is a static index that does not distinguish individual drug contributions to the efficacy of a multidrug combination. A PKPD model of bedaquiline-pretomanid-pyrazinamide (BPaZ) for the treatment of pulmonary TB was developed as part of a dynamic exposure-response approach to regimen development. The model describes a time course relationship between the drug concentrations in plasma and their individual as well as their combined effect on sputum bacillary load assessed by solid culture CFU counts and liquid culture time to positivity (TTP). The model parameters were estimated using data from the phase 2A studies NC-001-(J-M-Pa-Z) and NC-003-(C-J-Pa-Z). The results included a characterization of BPaZ activity as the most and least sensitive to changes in pyrazinamide and bedaquiline exposures, respectively, with antagonistic activity of BPa compensated by synergistic activity of BZ and PaZ. Simulations of the NC-003 study population with once-daily bedaquiline at 200 mg, pretomanid at 200 mg, and pyrazinamide at 1,500 mg showed BPaZ would require 3 months to attain liquid culture negativity in 90% of participants. These results for BPaZ were intended to be an example application with the general approach aimed at entirely novel drug combinations from a growing pipeline of new and repurposed TB drugs.
KEYWORDS: tuberculosis regimen, combination chemotherapy, pharmacometrics, clinical trial, dose selection, killing kinetics
INTRODUCTION
Treatment of pulmonary tuberculosis (TB) requires combination chemotherapy with at least three drugs and minimum durations of 4 to 9 months (1, 2). These treatments, however, are considered too long, too toxic, and insufficiently efficacious; and a major goal of current TB research is to expand treatment options with improved combination regimens (3). While new and repurposed TB drugs are increasingly available (4), the clinical development of novel regimens by conventional means is a decades-long process of drug addition and substitution in an existing combination (5). Regulatory guidance for codevelopment provides for acceleration of this process (6) but presents a new problem of how to systematically advance a novel multidrug regimen, as a unit, from early-phase to late-phase trials.
Current pathways from first-in-patient to confirmatory trials for TB regimens include phase 2A studies to assess early bactericidal activity (EBA), phase 2B/C studies to assess culture conversion after 8 weeks, and phase 3 studies to assess treatment failure and relapse (7, 8). For single drugs, phase 2 dose-finding based on experimentally determined exposure-response relationships is critical to optimal dosing for phase 3 trials. For regimens, the exponential increase in dose combinations with each added drug makes factorial dose-ranging measurements impractical. Early phase trials that support pharmacokinetic-pharmacodynamic (PKPD) model development could mitigate this limitation. Such models, in their general form, can account for individual drug contributions to efficacy and safety of the regimen, generate predictions for minimum treatment duration, and simulate effects of incomplete adherence; all of which can inform the design of late-phase trials (9, 10).
While no regimens that consist entirely of investigational new antimycobacterial drugs have advanced to clinical testing, there are several that contain the novel diarlyquinoline bedaquiline (B, BDQ), and one of the new nitroimidazoles pretomanid (Pa) or delamanid (DLM) (4). With respect to regimen components, the most complete early phase results have been obtained for bedaquiline-pretomanid-pyrazinamide (BPaZ), which included treatment arms (across multiple trials) for each drug alone and all pairwise combinations (11–15). Although pyrazinamide (Z, PZA) is a first-line TB drug, it continues to be tested in new regimens and remains a focus of research to improve its use (16).
The present study described a PKPD model of Mycobacterium tuberculosis killing kinetics during the first 14 days of treatment with BPaZ in adult patients with drug-susceptible pulmonary TB, which was developed as part of a model-informed approach to dose selection for combination regimens. A dynamic exposure-efficacy relationship between the component drug concentrations in plasma and their individual and combined effect on sputum mycobacterial load was established using single-drug PKPD models linked through pairwise antimicrobial interaction terms. The model parameters were estimated using Bayesian hierarchical analysis with experimental data from the phase 2A studies NC-001-(J-M-Pa-Z) (NC001) (ClinicalTrials registration no. NCT01215851) and NC-003-(C-J-Pa-Z) (NC003) (ClinicalTrials registration no. NCT01691543). Model simulations were used to assess goodness-of-fit, investigate the component drug effects on the three-drug combination, and generate predictions of efficacy outcomes for a range of doses and treatment durations. The results included quantitative measures of drug interactions, a rank order for the sensitivity of bactericidal activity to the component drugs, and negative culture probabilities for a phase 2B trial. The methods are general and have potential application to clinical trial designs throughout the various phases of current and proposed pathways for TB regimen development.
RESULTS
NC001 and NC003 participant data.
Data from 44 of 45 participants in the NC001 bedaquiline-pretomanid (BPa), bedaquiline-pyrazinamide (BZ), and pretomanid-pyrazinamide (PaZ) groups, and 28 of 30 in the NC003 pyrazinamide (Z) and BPaZ groups were used for analysis. The data were collected from 2 days preceding treatment and throughout the 14 consecutive treatment days and consisted of body weights, plasma drug concentrations, sputum solid culture CFU counts, and liquid culture time to positivity (TTP). Participant characteristics and data records for the combination groups are summarized in Table 1 and 2. The Z group data are described in Table S1 and S2 in Supplemental File 1. Data from one participant in BPa and two in BPaZ were excluded from the analysis due to inconsistent sputum culture growth in accordance with the initial reports (13, 15). There was one below the lower limit of quantification (BLQ) value for pretomanid in BPaZ, one for bedaquiline in BPa, and five for pyrazinamide in BZ. These were treated as missing data. The negative cultures were from a solid medium.
TABLE 1.
Baseline characteristics of the study participants included for analysis
| Characteristic | BPaa | BZ | PaZ | BPaZb |
|---|---|---|---|---|
| No. of participants | 14 | 15 | 15 | 13 |
| No. male (%) | 11 (73)c | 13 (87) | 8 (57) | 11 (85) |
| Age (yrs) | 31 (19–46) | 25 (19–42) | 38 (20–50) | 29 (19–56) |
| Body wt (kg) | 54 (44–79) | 49 (44–71) | 55 (42–72) | 48 (40–66) |
| BMI (kg/m2)d | 19 (15–26) | 18 (15–27) | 18 (15–23) | 18 (16–22) |
| No. HIV+ (%) | 2 (14) | 0 (0) | 1 (7) | 1 (7) |
| Log10 CFU/mLe | 6.96 (5.06–7.69) | 6.03 (4.66–7.09) | 5.96 (4.02–7.33) | 5.5 (4.63–6.65) |
| TTP (days)e | 3.68 (3.0–5.12) | 4.34 (3.09–5.12) | 3.84 (2.69–7.24) | 3.5 (2.93–5.31) |
BPa, bedaquiline-pretomanid; BZ, bedaquiline-pyrazinamide; PaZ, pretomanid-pyrazinamide.
BPaZ, bedaquiline-pretomanid-pyrazinamide.
Data are median (range) unless indicated otherwise.
BMI, body mass index; HIV+, human immunodeficiency virus-positive; TTP, time to positivity.
CFU and TTP values were calculated from the average of the two pretreatment measurements.
TABLE 2.
Data counts for body weights, drug concentrations, and sputum bacillia
| Group | BWb | BDQb | Pab | PZAb | CFU | TTPc | CNc |
|---|---|---|---|---|---|---|---|
| BPa (n = 14)c | 210 (7) | 168 (10) | 168 (9) | NA | 224 (17) | 224 (13) | 2 |
| BZ (n = 15) | 225 (3) | 180 (7) | NA | 180 (12) | 240 (9) | 240 (4) | 6 |
| PaZ (n = 15) | 225 (11) | NA | 360 (16) | 360 (16) | 240 (23) | 240 (13) | 1 |
| BPaZ (n = 13) | 195 (0) | 273 (0) | 273 (1) | 273 (0) | 208 (7) | 208 (5) | 12 |
Data counts, total (missing); NA, not applicable.
BW, body weight; BDQ, bedaquiline; Pa, pretomanid; PZA, pyrazinamide.
TTP, time to positivity; CN, sputum culture-negative; n, number of participants.
Mathematical model.
The BPaZ model equations were based on empirical mass balance compartments for plasma PK, and logistic growth with hyperbolic drug effect for sputum PD. The drug concentrations were functions of dosage, body weight, and time. Antimicrobial interactions were included in a quadratic response term. The model consisted of rate equations for each drug in transit , absorption , central , and peripheral compartments which represented the plasma PK; and for CFU (N) and TTP (T) which represented the sputum PD. The following equations were used.
Here, t denotes time. The indices i and j are drug labels (i, j = B, Pa, Z). The dosage was specified by discrete doses of each drug administered at elapsed times from the start of sputum collection. This specification provided for a pretreatment interval, and for drugs administered as monotherapy, in pairs, or all three at once with any defined or random pattern such as relative offsets in time or missing doses. For pretomanid and pyrazinamide, there were three transit compartments , and for bedaquiline, there were six . Peripheral compartments were used only for bedaquiline (two compartments, ), with pretomanid and pyrazinamide concentrations accounted for using a single (central) compartment. The and are drug kill rates and interaction coefficients, respectively, with the latter included only once for each pair (denoted by ) in the summation. The initial conditions for drug mass and concentration were equal to zero. For CFU and TTP, they were pretreatment values. A model diagram is shown in Fig. S1 in Supplemental File 1.
The PK parameters for each drug consisted of an oral bioavailability , a transit compartment rate constant , an oral absorption rate constant , a central volume of distribution , and a systemic clearance . The peripheral compartments for bedaquiline were parameterized by separate volumes (V2 and V3) and intercompartmental clearances (Q2 and Q3) (17). For pretomanid, the oral bioavailability was described by a saturable dose-dependent term parameterized by a maximum value , a half-maximum effective dose , and a food-effect coefficient equal to 1 for a fasted state and 0 for a fed state (18). The maximum values for bioavailability were set equal to 1 for each drug. The volume and clearance parameters for all drugs were allometrically scaled with a normalized body weight (as a function of time) , where was the observed weight (kilograms) at the time of the nth dose, , and 70 kg was the standard adult weight (19). The scaling relations were , where are allometric normalization constants.
The PD kill rates were parameterized by a maximum kill rate constant and a half-maximum effective drug concentration as,
For bedaquiline, a delayed onset of activity with monotherapy was accounted for by a decay term multiplying the maximum kill rate constant, , with decay constant (17). The remaining PD parameters were a sputum mycobacterial accumulation rate constant and carrying capacity , the initial conditions and , and a liquid culture time constant for the relation between CFU and TTP (20).
Parameter estimates.
The unmeasured model parameters were assigned lognormal (LN) distributions with mean and variance estimated as joint population and individual distributions conditioned on the observed plasma concentrations (with body weights as covariates) and the sputum CFU and TTP. Table 3 and 4 show the BPaZ population geometric mean (GM), variance, and expected value distributions. The variance, which represents interindividual variability, was expressed as a percent coefficient of variation (%CV). Each marginal distribution was summarized by an arithmetic mean and SD. Precision, as a percent relative SD (%RSD) was 10% or less for all population expected value estimates. For the interaction coefficients, the highest density intervals of the posterior GM distributions were far from the zero-interaction values and with percentiles that fell well within the prior ranges. The population marginal median (2.5, 97.5) percentiles were: , −88 (−110, −73) (h); , 135 (110, 160) (h); and , 130 (110, 150) (h). Relative to the sum of single-drug effects, the negative values for represent antagonism and the positive values for and represent synergy. Summary statistics of the population and individual distributions for the drug pairs are shown in Table S3 to S6 in Supplemental File 1.
TABLE 3.
BPaZ population PK parameters: summary statistics of the marginal posterior distributionsa
| Parameter (units) | GM | %CV | Expected valueb |
|---|---|---|---|
| BWc (kg) | 50 (0.49) | 13 (0.64) | 51 (0.51) |
| (1/h) | 3.2 (0.24) | 35 (8) | 3.4 (0.27) |
| (1/h) | 1 (0.089) | 30 (11) | 1 (0.098) |
| (L) | 130 (9) | 29 (8.5) | 140 (9.8) |
| (L) | 83 (7.5) | 27 (11) | 86 (8.2) |
| (L) | 830 (74) | 32 (11) | 870 (82) |
| (L/h) | 7.6 (0.7) | 31 (11) | 8 (0.78) |
| (L/h) | 8.3 (0.7) | 47 (7.6) | 9.2 (0.82) |
| (L/h) | 7.6 (0.48) | 28 (6.4) | 7.9 (0.52) |
| (1/h) | 2.3 (0.19) | 40 (8.9) | 2.5 (0.22) |
| (1/h) | 0.82 (0.07) | 36 (12) | 0.87 (0.081) |
| (L) | 100 (3.6) | 9.7 (5) | 100 (3.6) |
| (L/h) | 3.4 (0.19) | 26 (5.7) | 3.5 (0.2) |
| (1/h) | 3.3 (0.26) | 44 (7.4) | 3.6 (0.3) |
| (1/h) | 3.4 (0.32) | 31 (11) | 3.6 (0.35) |
| (L) | 36 (2) | 23 (5.8) | 37 (2.1) |
| (L/h) | 3.5 (0.21) | 25 (5.8) | 3.6 (0.22) |
Data are the distribution mean (SD), sample size = 10,000.
Expected value, , where is the geometric mean (GM), and is the variance with CV the coefficient of variation.
BW calculated from bootstrap mean and SD distributions (n = 10,000) generated from observed values.
TABLE 4.
BPaZ population PD parameters: summary statistics of the marginal posterior distributionsa
| Parameter (units) | GM | %CV | Expected valueb |
|---|---|---|---|
| (CFU/mL) | 5.78 (0.12) | 11 (0.026) | 6.31 (0.30) |
| (h) | 92 (3) | 19 (4.8) | 94 (3.2) |
| (h) | 28 (2.3) | 31 (8.8) | 29 (2.5) |
| (1/h) | 0.024 (0.0023) | 29 (11) | 0.025 (0.0025) |
| (1/h) | 0.019 (0.0018) | 28 (12) | 0.02 (0.002) |
| (mg/L) | 1.4 (0.13) | 29 (11) | 1.5 (0.15) |
| (1/h) | 0.016 (0.0014) | 45 (9.4) | 0.018 (0.0016) |
| (mg/L) | 0.76 (0.072) | 29 (11) | 0.79 (0.079) |
| (1/h) | 0.012 (0.0011) | 31 (11) | 0.013 (0.0012) |
| (mg/L) | 66 (6.2) | 30 (12) | 69 (6.8) |
| (h) | −89 (8.4) | 28 (11) | −92 (9.1) |
| (h) | 140 (13) | 37 (10) | 150 (15) |
| (h) | 130 (12) | 29 (11) | 140 (13) |
Data are the distribution mean (SD), sample size = 10,000.
Expected value, , where is the geometric mean (GM), and is the variance with CV the coefficient of variation.
Visual predictive checks.
Monte Carlo (MC) simulations of time course profiles for the plasma drug concentrations and the sputum CFU and TTP are shown with the observed data for each drug pair in Fig. 1. For BPaZ, they are in Fig. 2. The drug concentrations are shown for day 14, and the CFU and TTP from pretreatment through day 14. They were summarized by the 5th, median, and 95th percentiles. The mean and SE of the observed BPaZ culture data and the corresponding simulation mean profiles are also shown. Observed and predicted exposure-efficacy profiles of the first seven participants in the BPaZ group are shown in Fig. 3. The patterns of error with respect to peak values, inflection points, and ranges of the percentile curves did not indicate substantive changes to the model. The simulations were considered an adequate representation of the observed interindividual variation and kinetic features of the individual and population profiles.
FIG 1.
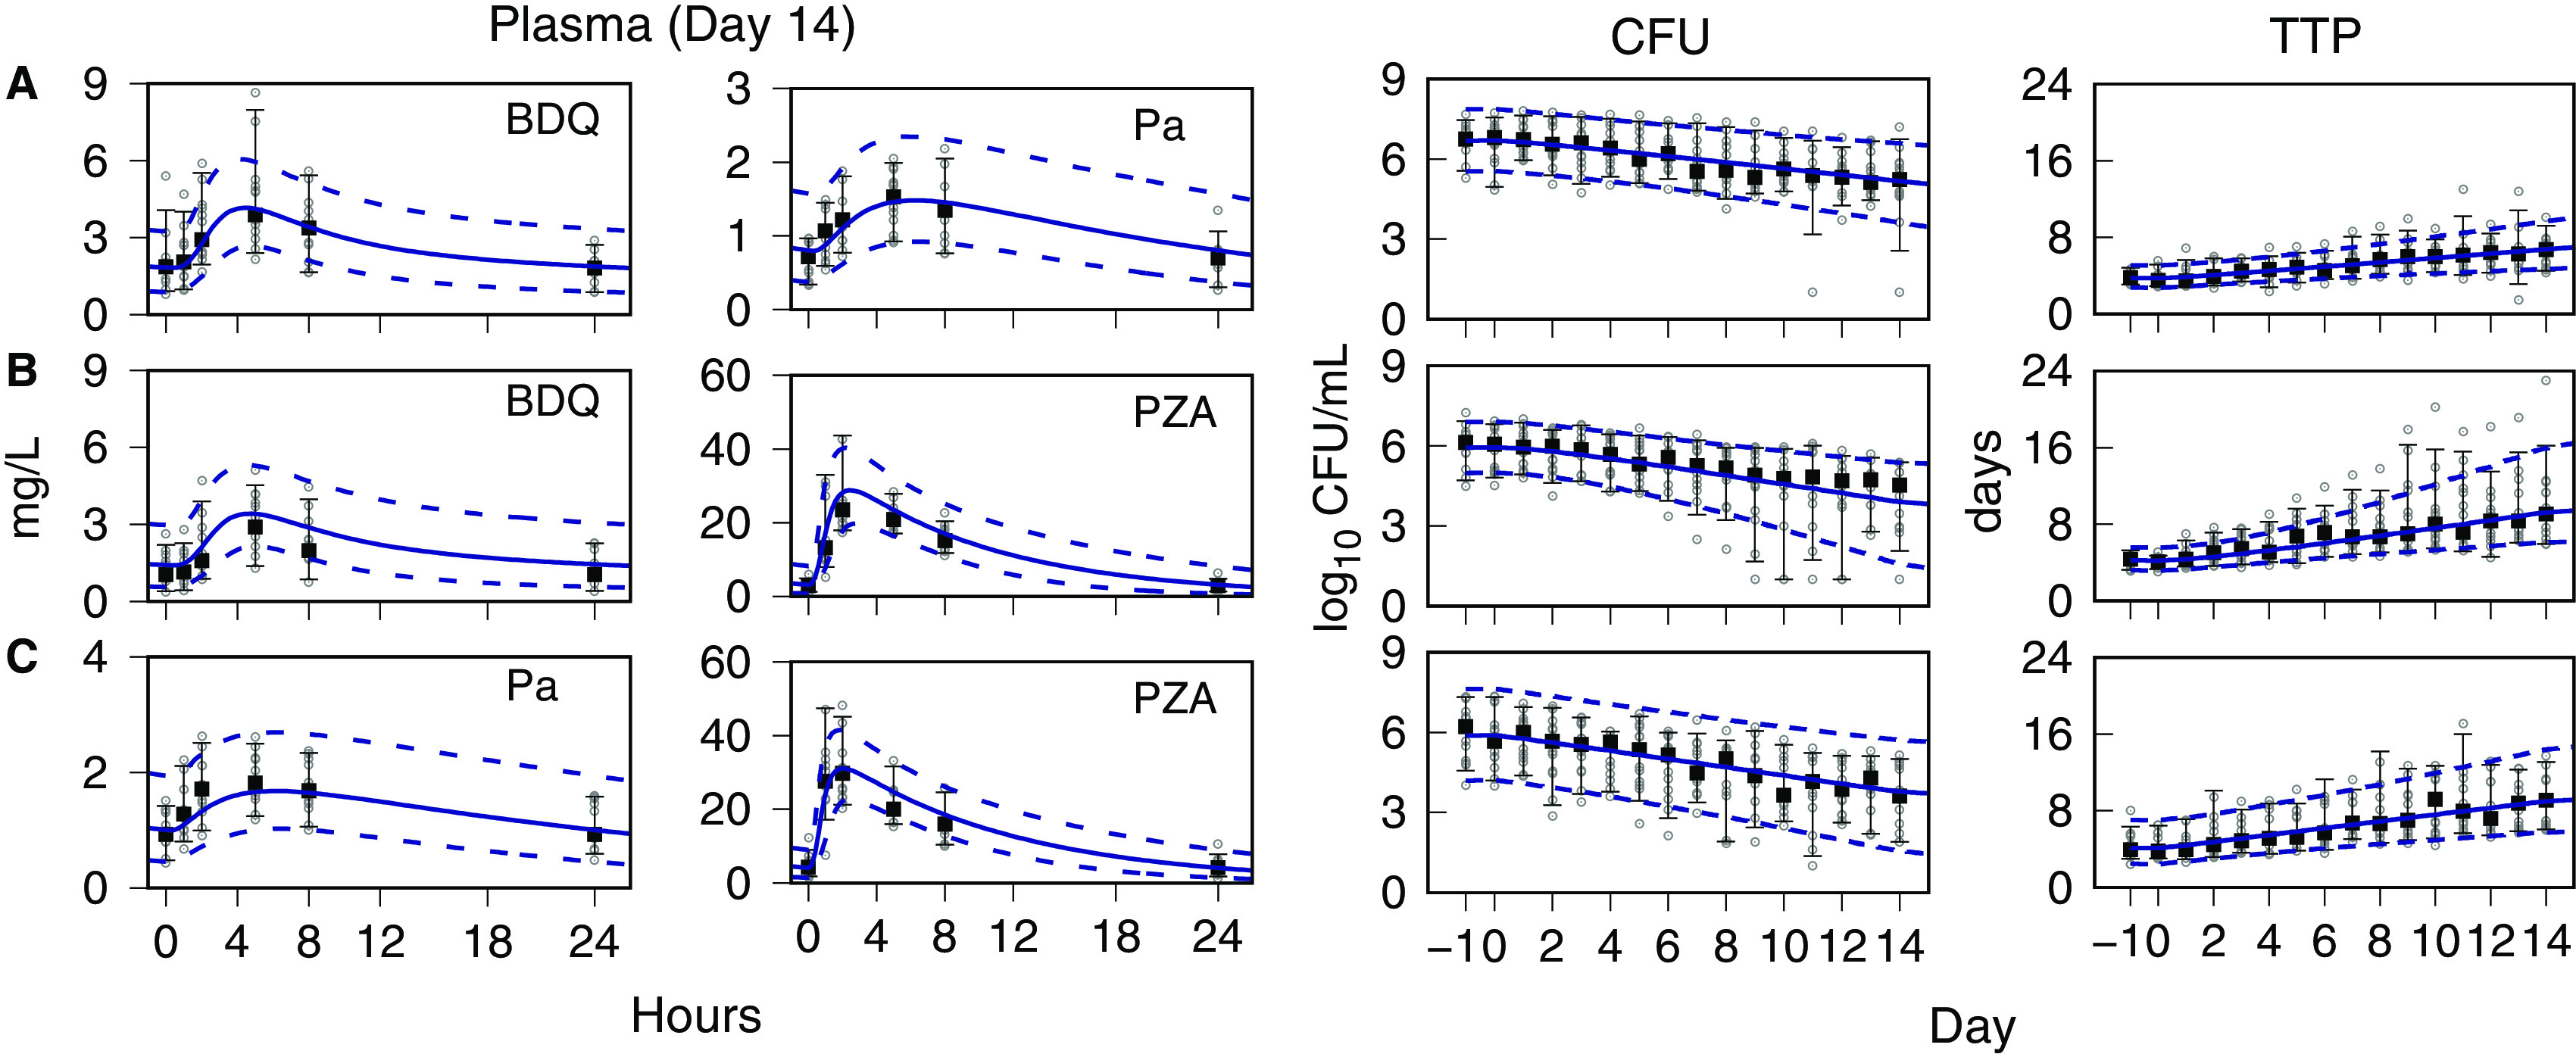
NC001 drug pairs. Visual predictive check for population data and PKPD model simulations. Day 14 plasma concentrations for bedaquiline (BDQ), pretomanid (Pa), and pyrazinamide (PZA). Days −1 to 0 (pretreatment) and days 1 to 14 sputum CFU and time to positivity (TTP). (A) Bedaquiline-pretomanid, (B) bedaquiline-pyrazinamide, and (C) pretomanid-pyrazinamide. Observed data (points); median (square point), 5th and 95th percentiles (error bars). Model predictions are shown as Monte Carlo (MC) distribution summaries (sample size equal to 10,000), median (solid line), and 5th and 95th percentiles (dashed lines).
FIG 2.

NC003 BPaZ combination. Visual predictive check for population data and PKPD model simulations. Day 14 plasma concentrations for bedaquiline (BDQ), pretomanid (Pa), and pyrazinamide (PZA). Days −1 to 0 (pretreatment) and days 1 to 14 sputum CFU and time to positivity (TTP). Observed data (points), median (square point), 5th and 95th percentiles (error bars) for the CFU and TTP mean (triangle) and SE (error bars). Model predictions are shown as Monte Carlo (MC) distribution summaries (sample size equal to 10,000), median (solid line), and 5th and 95th percentiles (dashed lines), and for the mean CFU and TTP (solid line).
FIG 3.
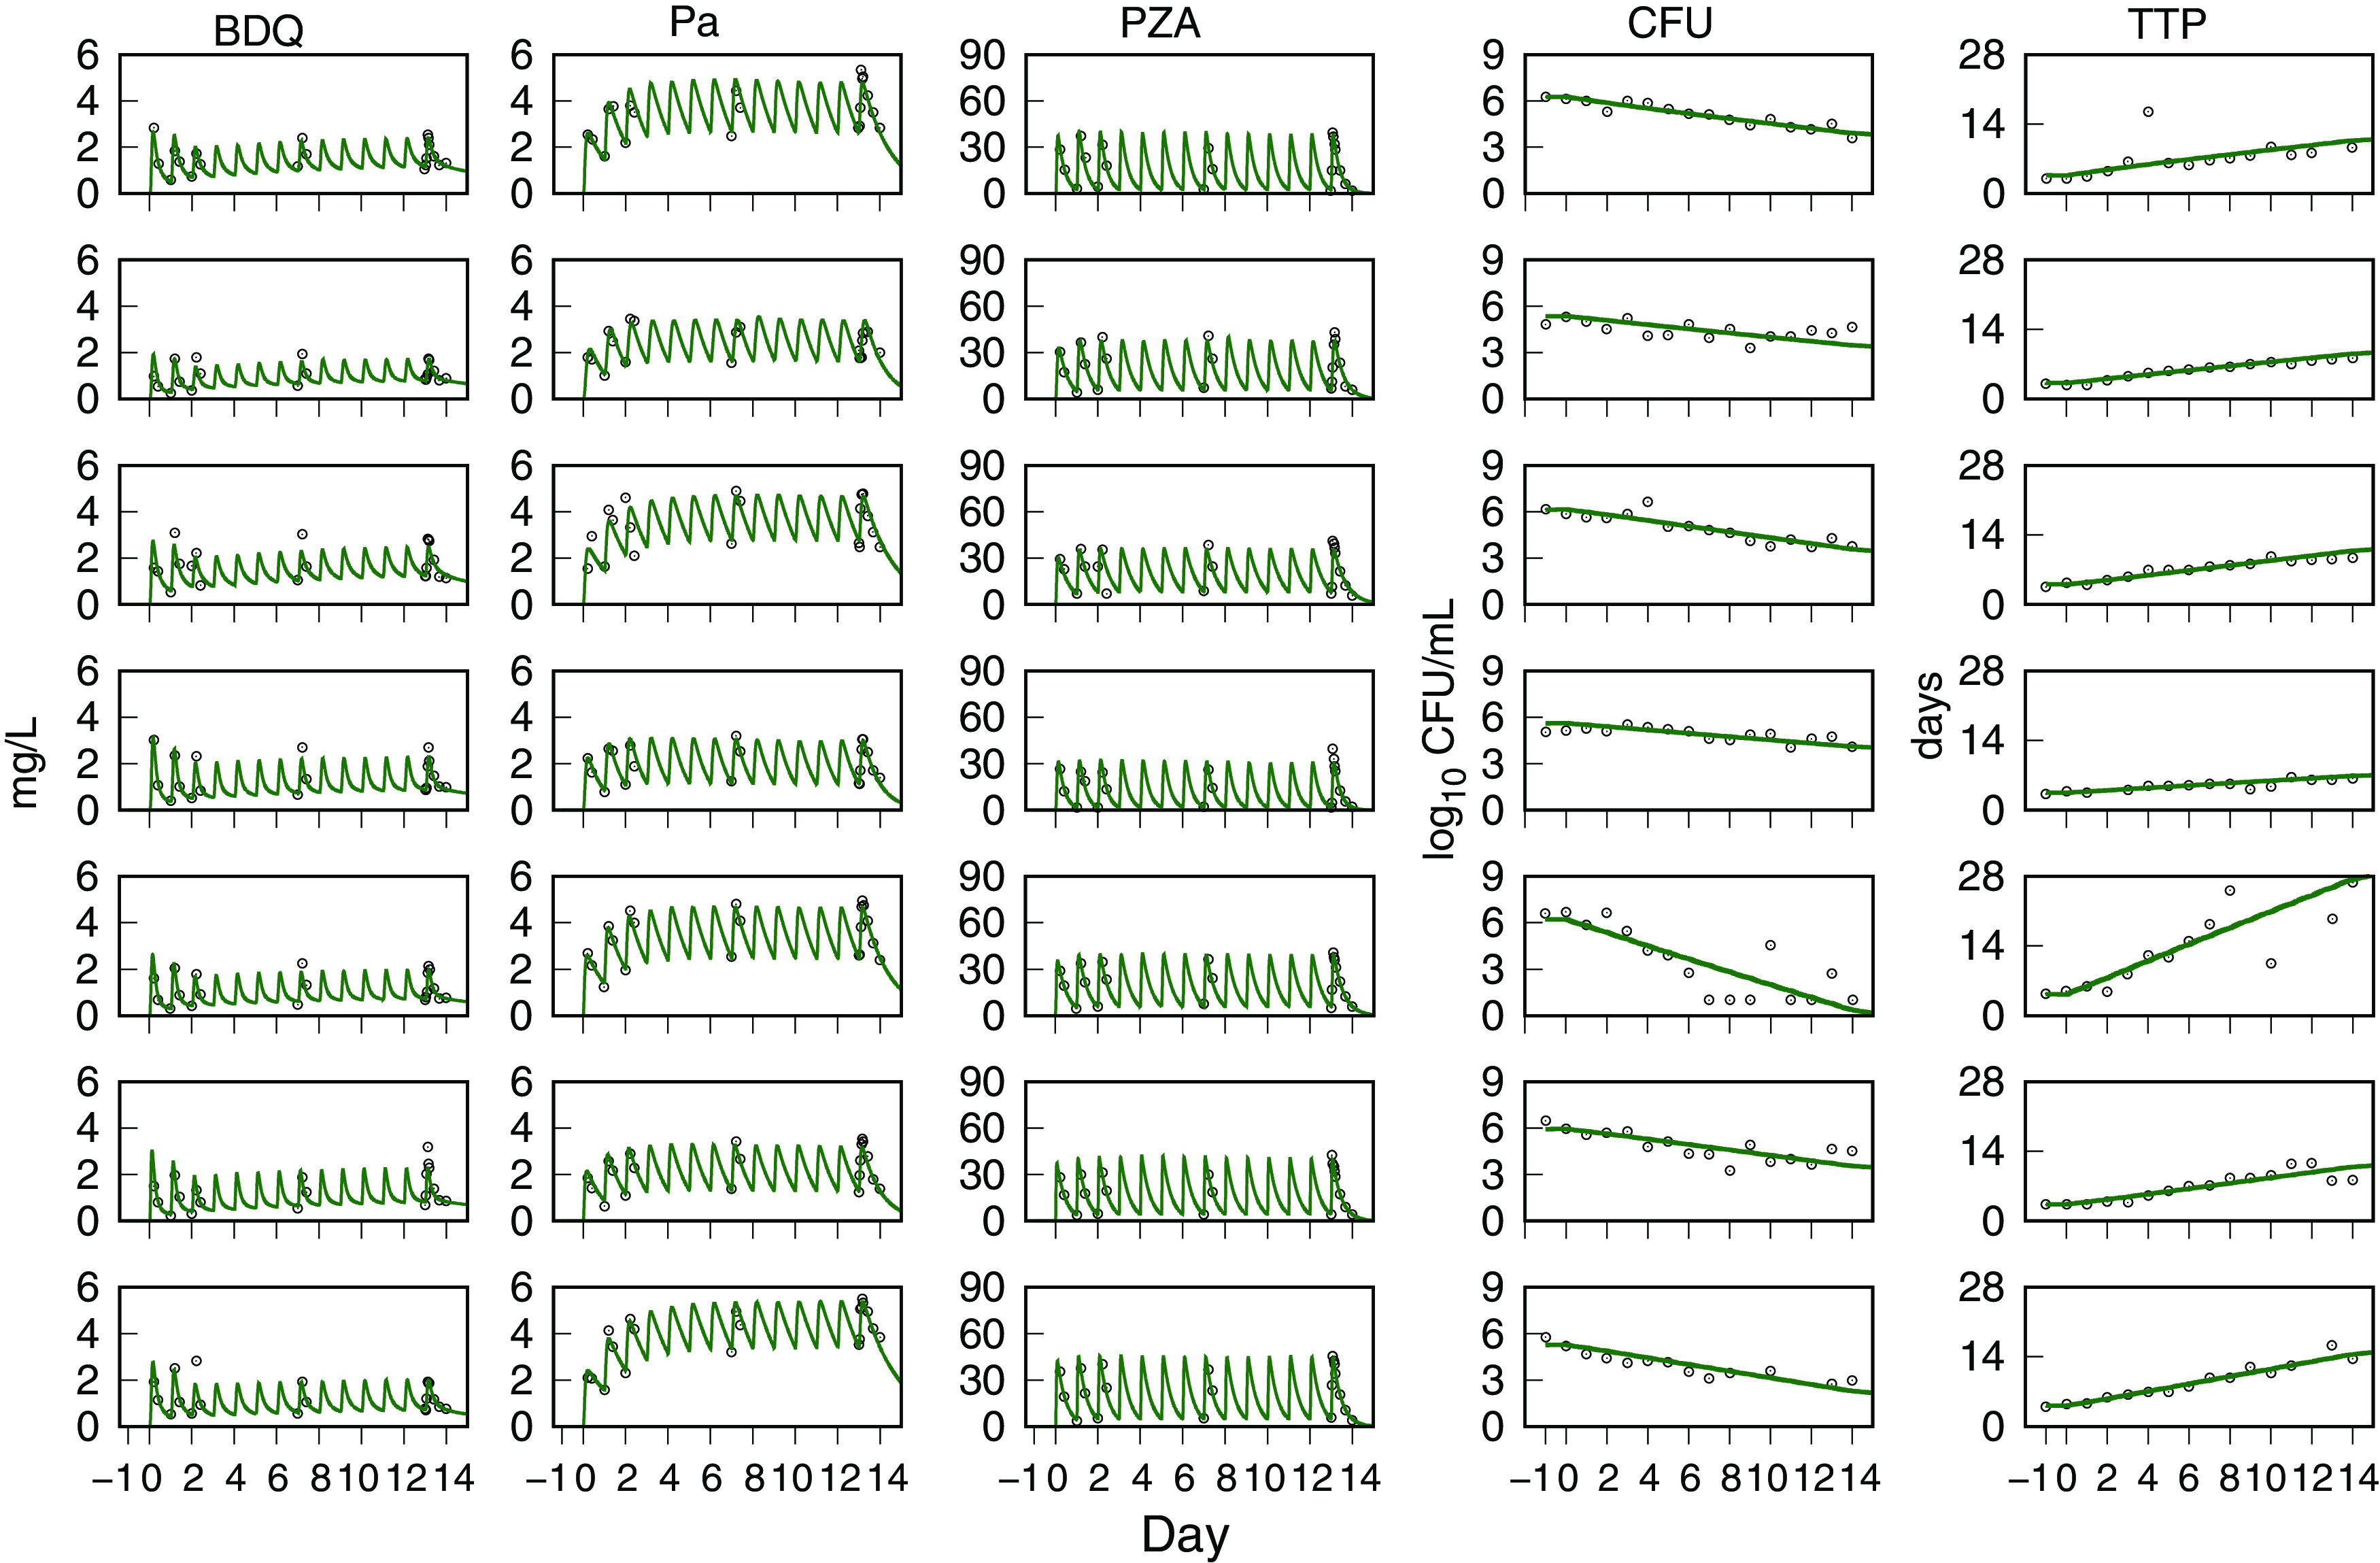
NC003 BPaZ combination. Visual predictive check for individual data and PKPD model simulations. Day 1 to 14 plasma concentrations for bedaquiline (BDQ), pretomanid (Pa), and pyrazinamide (PZA). Days −1 to 0 (pretreatment) and days 1 to 14 sputum culture CFU and time to positivity (TTP). Observed data (points) and model-predicted mean profiles (lines). The day 9 and day 11 observed TTP values for the fifth row (from the top) participant are not shown but were equal to 31.6 days and 36.2 days, respectively.
Component drug effects.
The single-drug contributions to the efficacy of BPaZ were investigated using MC simulations of the 14-day EBA (as the change in log10[CFU] and TTP over the 2-week treatment interval). Once-daily doses of each drug were varied, one drug at a time, over a wide range with the other two drugs fixed at once daily 200 mg for bedaquiline, 200 mg for pretomanid, or 1,500 mg for pyrazinamide. The results were summarized as model fits (by least squares regression) to the mean values of the simulated distributions using with E as the EBA, D as the drug dose as an independent variable, as the baseline value, as the maximum effect of the varied drug, and as the half-maximum effective dose. The values for each simulated dosage are shown in Table 5 and the corresponding plots in Fig. 4. The plots show each varied drug (over a plausible range) and their effect on the combination together with the output for the same drug as monotherapy. Pyrazinamide showed an approximate dose-proportional increase in the activity of BPaZ, while there was little corresponding change with increases in bedaquiline and pretomanid. Among the three drugs, the pattern of activity for pretomanid as monotherapy most closely matched its effect in the BPaZ combination. The Emax values showed the smallest contribution to BPaZ from bedaquiline and the largest from pyrazinamide. The parameters for each drug as monotherapy versus their values in the three-drug combination showed the potency of bedaquiline and pyrazinamide increased in BPaZ relative to monotherapy, while that for pretomanid did not substantially change.
TABLE 5.
Emax model parametersa for the population mean profiles generated from Monte Carlo (MC) PKPD model simulations of the 14-day EBA for once daily BPaZ dosing
| EBA0−14 (CFU)b |
EBA0−14 (TTP)b |
|||||
|---|---|---|---|---|---|---|
| E0 c | Emax | D50 | E0 c | Emax | D50 | |
| Drug (regimen) | (log10 CFU/mL/d) | (log10 CFU/mL/d) | (mg) | (h/d) | (h/d) | (mg) |
| BDQ (BPaZ)d | 0.22 | 0.029 | 170 | 15 | 2.1 | 260 |
| BDQ (Mono)e | 0 | 0.17 | 300 | 0 | 11 | 300 |
| Pa (BPaZ) | 0.13 | 0.13 | 50 | 9 | 8.7 | 60 |
| Pa (Mono) | 0 | 0.18 | 60 | 0 | 12 | 60 |
| PZA (BPaZ) | 0.11 | 0.30 | 2,100 | 7.4 | 32 | 4,300 |
| PZA (Mono) | 0 | 0.12 | 4,500 | 0 | 8.3 | 4,500 |
Least squares estimate, dose range 0 to 64,000 mg, MC sample size = 10,000.
EBA0−14, day 0 to day 14 EBA calculated using CFU or time to positivity (TTP).
E0, baseline; Emax, maximum; D50, half-maximum effective dose.
BPaZ, bedaquiline-pretomanid-pyrazinamide; BDQ, bedaquiline; Pa, pretomanid; PZA, pyrazinamide.
Mono, monotherapy.
FIG 4.

Single-drug dose ranging for bedaquiline (BXPaZ), pretomanid (BPaXZ), and pyrazinamide (BPaZX), where X denotes the varied drug. Monte Carlo (MC) simulations of the early bactericidal activity (EBA), calculated for log10(CFU) and time to positivity (TTP) with 14 days of once-daily BPaZ dosing. The solid and dashed curves are Emax model fits to the MC distribution mean (sample size equal to 10,000). The horizontal axis for the dose is shown with logarithm scale increments.
The component drug contributions to BPaZ were also illustrated with time-kill profiles generated using the expected values from Table 3 and 4, and the BPaZ dosages in the 8-week phase 2B trial NC-005-(J-M-Pa-Z) (NC005) (ClinicalTrials registration no. NCT02193776). Fig. 5 shows population-typical CFU and TTP profiles for pretomanid at 200 mg once daily, pyrazinamide at 1,500 mg once daily, the two different bedaquiline dosages (200 mg once daily [B200], and 400 mg once daily for 2 weeks [as a loading dose] followed by 200 mg three times per week [Bload]), and their BPaZ combinations. Although the bedaquiline profiles for the daily and loading dosages differed as monotherapy, they resulted in nearly identical outcomes for the BPaZ combination. Fig. 6 shows the contributions of the drug pairs with antagonistic interaction between bedaquiline and pretomanid and the synergistic interactions between pyrazinamide and bedaquiline and between pyrazinamide and pretomanid. Combining pyrazinamide with BPa and pretomanid with BZ, resulted in increased activity, while the activity of PaZ and BPaZ were nearly identical.
FIG 5.

PKPD model simulations of CFU and time to positivity (TTP) versus time for 8 weeks of the NC005 BPaZ combinations, and the individual components. BloadPaZ and B200PaZ denote bedaquiline 400 mg once daily for 2 weeks (loading dose) then 200 mg three times per week, and bedaquiline 200 mg once daily, respectively, together with once daily pretomanid (Pa) at 200 mg and pyrazinamide (Z) at 1,500 mg.
FIG 6.

PKPD model simulations of CFU and time to positivity (TTP) versus time for 8 weeks of treatment with once-daily dosing at 200 mg bedaquiline (B), 200 mg pretomanid (Pa), and 1,500 mg pyrazinamide (Z). (A) Single drugs were combined into pairs: BPa, BZ, and PaZ. (B) Drug pairs combined with the remaining single drug.
Predicted treatment duration.
In Fig. 7, the NC003 population mean profile of the MC simulation output for log10(TTP) with the NC005 dosages is shown together with the reported mean and SD values from Tweed et al. (21). The simulations for both bedaquiline dosages accounted for the observed time course profiles within the range of measured variability. Fig. 8 shows probabilities of negative culture (NC) calculated from MC simulations of CFU and TTP outcomes for once-daily bedaquiline at 200 mg, pretomanid at 200 mg, and pyrazinamide at 1,500 mg and 3,000 mg, as a function of treatment duration, together with the observed day 56 outcome for B200PaZ reported by Tweed et al. (21). The probabilities were calculated as the percentage of participants with log10(CFU) < 1 and TTP values greater than 19 days (calculated from (17), using the expected values for and in Table 4). The results showed that the B200PaZ regimen would require 3 months (90 days) to attain liquid culture negativity in 90% of the study population (2 months if assessed by solid culture CFU), and that doubling the pyrazinamide daily dose, from 1,500 mg to 3,000 mg, would shorten treatment by approximately 10 days.
FIG 7.

Time to positivity (TTP) versus time for the 8-week NC005 BPaZ regimens. Data are the observed (OBS) mean (points) and SD (error bars) reported by Tweed et al. (21), and the NC003 PKPD model-forecasted data (lines). Bload PaZ and B200PaZ denote bedaquiline 400 mg once daily for 2 weeks (loading dose) then 200 mg three times per week, and bedaquiline 200 mg once daily, respectively, together with once daily pretomanid at 200 mg and pyrazinamide at 1,500 mg.
FIG 8.

NC003 PKPD model-forecasted probability of negative sputum culture (NC) versus days of treatment with once-daily BPaZ (bedaquiline 200 mg, pretomanid 200 mg, and pyrazinamide 1,500 mg or 3,000 mg), for solid culture CFU and liquid culture time to positivity (TTP). The dashed horizontal line denotes probability equal to 0.9, the observed data (OBS) are the day 56 NC005 BPaZ mean (points) and SD (error bars) results reported by Tweed et al. (21), and the solid and dashed curves are the probabilities calculated from Monte Carlo (MC) simulation of CFU and TTP outcomes for each dosage (sample size = 10,000).
DISCUSSION
Conventional approaches to TB regimen development are based on single-drug optimization against a background of existing drugs and are limited in their ability to efficiently identify optimal drug and dose combinations in early-phase clinical testing (22). Although exposure-response relationships provide a quantitative basis for these approaches (23), their extension to drug combinations with antimicrobial interactions is not generally considered for the analysis of TB drug trial data. A dynamic exposure-response relationship for BPaZ was developed as a PKPD model of plasma concentration and sputum culture data (for solid and liquid media) using phase 2A trial results for the two- and three-drug combinations. The model provided time-kill profiles and probabilities of negative cultures as functions of dosage, body weight, and treatment duration. The results supplement the previously reported statistical summaries of EBA parameters for BPaZ (15) and add details on component drug contributions to the efficacy of the combination, interindividual variability, and use of the phase 2A data to inform a subsequent phase 2B trial.
With respect to efficacy, pyrazinamide was found to be a key drug in the BPaZ combination with synergistic interactions in the BZ and PaZ pairs that compensated for antagonism between bedaquiline and pretomanid. From a component-drug perspective, BPaZ can be characterized as most sensitive (or least robust) to changes in pyrazinamide exposure, and least sensitive (or most robust) to changes in bedaquiline exposure, with pretomanid intermediate in these effects. This is in contrast to the response of these drugs with increasing doses as monotherapy, where there is a substantial potential increase in efficacy for bedaquiline and a relatively small potential increase for pyrazinamide. This also illustrates a need to consider dose optimization in the context of a specified combination in addition to monotherapy.
The NC003 BPaZ-calibrated model predictions of the 8-week NC005 treatment outcomes were examples of clinical trial simulations that could inform a phase 2A-to-phase 2B transition. Time-course profiles for log10(TTP) were generated as the primary outcome measure for efficacy together with probabilities of negative culture as a function of treatment duration to identify the time needed to meet a specified threshold. These simulations were based solely on the phase 2A data and could inform expectations for outcomes with various dosages in the design of a next-phase study. The availability of the NC005 results (21) provided for comparison between the observed and predicted (or forecasted) data, and the extent of agreement can be viewed as an assessment of the generalizability of the observed phase 2A outcomes to the larger and more geographically widespread phase 2B study population.
While a PKPD analysis based on time-kill profiles may be considered standard in a general context (24), including examples with more detailed modeling (25, 26) and for drug combinations in nonclinical systems (27–29), the most commonly employed application for TB drugs is probability of target attainment (PTA) (30–32). MC simulations of a population PK model are used to generate distributions of plasma drug concentrations for a set of test dosages, which are then assessed by their probability (fraction of simulated individuals) to attain specified PD target exposures that are determined by nonclinical or clinical correlates with efficacy and toxicity. For drug combinations, the drug and metabolite concentrations in plasma retain their identity as a mixture. Drug-drug interactions that may alter the PK profiles can be accounted for by updating the PK parameters for each drug against a background of the other drugs, and dose adjustments can then be made to maintain the desired exposures (33). The PD target, however, is a static value that leaves this form of PKPD modeling without predictive ability for treatment duration. Additionally, the efficacy outcome for drug combinations is a composite effect of the component drugs, and specification of the target exposure becomes ambiguous without a defined relationship between the drug exposure and antimicrobial effect. These limitations of PTA were addressed by the general PKPD model framework with the kinetic drug-kill profiles replacing the PD target as the primary difference between the two methods.
The quadratic approximation of the antimicrobial interactions was a simplifying assumption from an otherwise general nonmechanistic regression analysis (34). The neglect of higher-order antimicrobial effects (a three-drug interaction in this case) was motivated by the antibiotic combination modeling results of Wood et al. (35). In their study, growth inhibition of bacteria exposed to three- and four-drug combinations were predicted from mechanism-independent effect terms for the single drugs and their pairwise combinations. Similar results have been described using different mathematical functions and parameterizations for large combinations of cancer drugs (36), antimycobacterial drugs (37), cellular immune responses (38), protein dynamics (39), and mixtures of antibodies (40). While these studies were aimed at predicting the combination effects from single and pairwise data, the aim here was to identify a minimal function that could systematically fit data from single-drug and pairwise treatment groups. Final model calibration to observed data from the full multidrug combination was then made to inform subsequent testing of the same specified drug combination. Although the quadratic approximation did not lessen the number of studies needed to specify the PKPD parameters for this three-drug combination, its application to a four-drug combination would omit four three-drug studies, and to a five-drug combination would omit 10 three-drug and five four-drug studies.
There are several limitations to this analysis. Fundamentally, the PKPD model equations are empirical and the analysis is descriptive, and model predictions for different test conditions represent uncertain extrapolations of the data used for model calibration. The model was developed with a minimal number of parameters that were estimated from a rich set of experimental data, and the simulations were limited to interpolations between a range of doses in the modeled phase 2A studies and extended treatment duration for a phase 2A-to-phase 2B transition where the patient cohorts were similar and the drug combinations were the same. However, observations of drug penetration throughout the lung-lesion environment (41) show that plasma PK provides an incomplete accounting of drug exposure at target sites. There are additional limitations in accounting for the amplification or suppression of less-susceptible clones (42) and in the use of early-phase sputum cultures to predict long-term treatment outcomes (43). The analysis becomes more uncertain if applied to nonclinical systems to extrapolate to a clinical setting, where site-of-action PKPD (44) and systems pharmacology approaches would be more appropriate (45).
The combination model was developed from the single-drug models with minimal additional structure for drug-drug interactions. For the PK component, there was no optimization of the transit compartments or consideration of alternative absorption scenarios (46). Although PK variability was accounted for in the parameter value distributions, its source in drug-drug interactions (47) was not investigated. There is little mechanistic basis for the quadratic approximation used for the PD component, and the evaluation of only this model structure is a limitation that could be partly addressed by comparisons with alternative models (48, 49). A more detailed treatment based on drug target binding kinetics (50, 51) may provide a drug-specific description to better support hypotheses regarding the underlying PD processes. Another limitation is the inability of the concentration-independent interaction coefficients to account for variable strength across the entire interaction surface. This is a potential source of uncertainty in the characterization of the interactions as synergistic or antagonistic in the typical context of Bliss independence or Loewe additivity (49). In addition, the experimental requirements are front-loaded in phase 2A testing with the modeling best informed by a large enough dose range to identify nonlinearity in the PK and PD outcomes, and a missing treatment arm for any drug pair leaves the identification of the interaction coefficients highly uncertain.
The agreement between the NC003-BPaZ model predictions of the mean TTP profile and the corresponding observed outcomes in the phase 2B NC005 study was not expected. There was instead an expectation of significant modeling errors with the longer treatment duration that would arise, for example, from subpopulations of bacilli with possibly different kill rates due to genetic and phenotypic variation (52). The errors would then inform an updated model that would be recalibrated with the new data as a next step in the advancement of the regimen. The absence of such errors in these 8-week results does not preclude their appearance in longer-duration phase 3 studies. The 10-day difference between the population mean outcomes for the daily 1,500 mg and 3,000 mg pyrazinamide doses over 3 months of treatment is small, and such long extrapolations beyond the modeled data are highly uncertain. Model calibration to the 8-week NC005 data would reduce this uncertainty for these predictions.
This PKPD analysis was developed to provide quantitative testable predictions of efficacy outcomes for a TB drug combination based on phase 2A trial data. The results represent model-based hypotheses that require evaluation (for example, with additional nonclinical or phase 2A studies) before advancing to later-stage development. The next step for BPaZ is to update the PKPD model by calibration to the available NC005 data and to combine it with models for adverse events and resistance (53, 54). Such a composite model defines a therapeutic potential for the regimen that can be optimized with respect to trade-offs between safety and efficacy (55). The approach is general, and can be applied to an arbitrary combination in an iterative workflow that starts with phase 2A study results, models the outcomes to identify optimal dosages, and then repeats through each successive stage of development. This framework is aimed at addressing barriers to codevelopment of entirely novel regimens that are anticipated with newly approved compounds and the growing pipeline of new chemical entities for TB treatment (56).
MATERIALS AND METHODS
Notation.
The natural and base-10 logarithms of a positive number, , were denoted as log(x) and log10(x), respectively. Lognormal (LN) distributions for a parameter, , were specified by the normal (N) distribution mean and variance as or , with geometric mean (GM) = , coefficient of variation (CV) = , and expected value .
NC-001-(J-M-Pa-Z) and NC-003-(C-J-Pa-Z).
NC001 and NC003 were published phase 2A trials of the first 14 days of TB treatment with combinations of bedaquiline (J, B, BDQ), pretomanid (Pa), moxifloxacin (M), clofazimine (C), and pyrazinamide (Z, PZA) (13, 15). Both studies enrolled adult patients with newly diagnosed, sputum smear-positive pulmonary TB and were conducted in Cape Town, South Africa, from 2010 to 2011 (NC001) and 2012 to 2013 (NC003). The trial data were obtained from the TB-Platform Aggregation of Clinical TB Studies (TB-PACTS) (https://c-path.org/programs/tb-pacts).
Only those treatment arms that contained bedaquiline, pretomanid, and pyrazinamide combinations (without moxifloxacin and clofazimine) were included for analysis. Drugs were orally administered once daily in tablet form after a meal (except for pretomanid, and pyrazinamide plus pretomanid, administered in a fasted state in NC001) (Table S7 in Supplemental File 1). Body weights were measured daily before dosing. Blood PK sampling was conducted on days 1, 2, 3, 8, and 14, with timings that varied across drugs and treatment groups (Table S8 in Supplemental File 1). Drug concentrations in plasma were measured using liquid chromatography-tandem mass spectrometry, with a lower limit of quantification of 10 ng/ml for pretomanid, 1 ng/mL in NC001 and 5 ng/mL in NC003 for bedaquiline, and 0.5 or 0.05 mg/L in NC001 and 0.5 mg/L in NC003 for pyrazinamide. Daily sputum samples from 16 h overnight collections were assessed by parallel solid culture CFU counts per milliliter sputum and liquid culture time to positivity (TTP) (MGIT, mycobacterial growth indicator tube). Negative cultures were included for analysis by setting log10(CFU) = 1 or TTP = 42 d as limits of detection (13).
Mathematical modeling and parameter estimation.
The PKPD model was based on published single-drug models for bedaquiline (17), pretomanid (18, 20, 57), and pyrazinamide (25, 58, 59), and a two-drug antimicrobial interaction model (60). Data used to develop the single-drug models were from separate phase 2A monotherapy studies of pretomanid (11, 12) and bedaquiline (14), and from the pyrazinamide monotherapy arm of the NC003 study. These studies were all conducted using similar trial designs, protocols, and patient populations.
The model parameters were treated as random variables estimated from observed data using a Bayesian hierarchical model with population and individual levels (17, 61). Prior population distributions for each unmeasured parameter (Table S9 to S11 in Supplemental File 1) were updated to a joint population and individual posterior distribution conditioned on drug concentration and efficacy data using Bayes’ rule with a lognormal likelihood and log uniform (LU) SD residual error for each measurement type. The PK distributions were updated first, with the resulting individual marginal posterior means then used as covariates for the subsequent estimation of the PD parameters. The posterior distributions were sampled using Markov chain Monte Carlo (MCMC) simulation with 10 independent sampling chains of at least 60,000 iterations each and with every 20th iteration of the last 20,000 retained and aggregated for a final sample of 10,000 iterations. Missing data were ignored in all calculations. Convergence and mixing were assessed by inspection of trace plots, the Gelman-Rubin potential scale reduction factor, and effective sample size (61).
The prior distributions were specified for bedaquiline and pretomanid parameters from the single-drug modeling results, and for pyrazinamide by updating the literature values using the NC003 Z group data (with details provided in Supplemental File 1). Priors for the initial conditions of sputum bacillary load were specified from bootstrap mean and SD distributions (sample size equal to 10,000) generated from the NC001 and NC003 pretreatment CFU and TTP data. Prior distributions for the sputum accumulation rate constant and carrying capacity were not updated but were sampled as covariates. Priors for the antimicrobial interaction coefficients (for each drug pair) were specified using the maximum kill rates () and an interaction parameter () (60) as
Values for were specified relative to the added effects when equal to 1 (), with synergy when greater than 1, and antagonism when less than 1 (62). Assumptions of antagonism between bedaquiline and pretomanid (), and synergy between bedaquiline and pyrazinamide, and pretomanid and pyrazinamide (), were based on published mouse study results (63, 64), with the rationale being a similarity between PD parameters of antimicrobial drugs in animal models and humans (65).
Model simulations.
The model equations were solved numerically for specified dosages of bedaquiline, pretomanid, and pyrazinamide. Population simulations were conducted as Monte Carlo (MC) simulations (10,000 iterations) with the population parameter values sampled from the MCMC posterior distribution and with body weights sampled with replacement from the complete set of observed values. Simulations of each study participant used the observed daily body weights and the individual marginal posterior mean values for each model parameter. Simulations for a population-typical participant used the posterior population marginal expected values.
Software.
All data handling and computational methods were implemented using general-purpose software, which consisted of SQLite (version 3.16.2; SQLite Development Team; https://www.sqlite.org), the GNU MCSim Modeling and Simulation Suite (66) (version 6.2.0; http://www.gnu.org/software/mcsim), the R statistical software (version 3.3.3; R Development Team; https://www.R-project.org) with the CODA package (version 0.18; https://cran.r-project.org/web/packages/coda) and gnuplot (Version 5.0; http://www.gnuplot.info/). The operating system was Linux (version 3.16.0-4-amd64; Debian distribution; https://www.debian.org).
ACKNOWLEDGMENTS
I thank Anne Lenaerts (Colorado State University, CSU) and Gregory Robertson (CSU) for their comments and suggestions on the manuscript.
The National Institutes of Health (NIH National Institute of Allergy and Infectious Diseases (NIAID) provided funding to M.A. Lyons under grant number R01AI125454.
I declare no conflict of interest.
Footnotes
[Changes in wording were made to the article on 22 November 2022.]
Supplemental material is available online only.
REFERENCES
- 1.Dorman SE, Nahid P, Kurbatova EV, Phillips PPJ, Bryant K, Dooley KE, Engle M, Goldberg SV, Phan HTT, Hakim J, Johnson JL, Lourens M, Martinson NA, Muzanyi G, Narunsky K, Nerette S, Nguyen NV, Pham TH, Pierre S, Purfield AE, Samaneka W, Savic RM, Sanne I, Scott NA, Shenje J, Sizemore E, Vernon A, Waja Z, Weiner M, Swindells S, Chaisson RE, Tuberculosis Trials Consortium . 2021. Four-month rifapentine regimens with or without moxifloxacin for tuberculosis. N Engl J Med 384:1705–1718. 10.1056/NEJMoa2033400. [DOI] [PMC free article] [PubMed] [Google Scholar]
- 2.Conradie F, Diacon AH, Ngubane N, Howell P, Everitt D, Crook AM, Mendel CM, Egizi E, Moreira J, Timm J, McHugh TD, Wills GH, Bateson A, Hunt R, Van Niekerk C, Li M, Olugbosi M, Spigelman M, Mvuna N, Upton C, Vanker N, Greyling L, Eriksson M, Fabiane SM, Canseco JO, Solanki P, Nix-TB Trial Team . 2020. Treatment of highly drug-resistant pulmonary tuberculosis. N Engl J Med 382:893–902. 10.1056/NEJMoa1901814. [DOI] [PMC free article] [PubMed] [Google Scholar]
- 3.Lienhardt C, Nahid P, Rich ML, Bansbach C, Kendall EA, Churchyard G, Gonzalez-Angulo L, D’Ambrosio L, Migliori GB, Raviglione M. 2017. Target regimen profiles for treatment of tuberculosis: a WHO document. Eur Respir J 49:1602352. 10.1183/13993003.02352-2016. [DOI] [PMC free article] [PubMed] [Google Scholar]
- 4.Black TA, Buchwald UK. 2021. The pipeline of new molecules and regimens against drug-resistant tuberculosis. J Clin Tuberc Other Mycobact Dis 25:100285. 10.1016/j.jctube.2021.100285. [DOI] [PMC free article] [PubMed] [Google Scholar]
- 5.Ginsberg AM, Spigelman M. 2007. Challenges in tuberculosis drug research and development. Nat Med 13:290–294. 10.1038/nm0307-290. [DOI] [PubMed] [Google Scholar]
- 6.US Food and Drug Administration Center for Drug Evaluation and Research. 2013. Guidance for industry: codevelopment of two or more new investigational drugs for use in combination.
- 7.Phillips PPJ. 2017. Setting tuberculosis regimen development on a firm foundation. Clin Infect Dis 65:55–56. 10.1093/cid/cix250. [DOI] [PubMed] [Google Scholar]
- 8.Davies G, Boeree M, Hermann D, Hoelscher M, PLoS M. 2019. The transition of new tuberculosis drug combinations from Phase II to Phase III trials: new technologies and innovative designs. PLoS Med 16:e1002851. 10.1371/journal.pmed.1002851. [DOI] [PMC free article] [PubMed] [Google Scholar]
- 9.Dooley KE, Hanna D, Mave V, Eisenach K, Savic RM. 2019. Advancing the development of new tuberculosis treatment regimens: the essential role of translational and clinical pharmacology and microbiology. PLoS Med 16:e1002842. 10.1371/journal.pmed.1002842. [DOI] [PMC free article] [PubMed] [Google Scholar]
- 10.Kimko HC, Duffull SB. 2002. Simulation for designing clinical trials. Marcel Dekker Incorporated. [Google Scholar]
- 11.Diacon AH, Dawson R, Hanekom M, Narunsky K, Maritz SJ, Venter A, Donald PR, van Niekerk C, Whitney K, Rouse DJ, Laurenzi MW, Ginsberg AM, Spigelman MK. 2010. Early bactericidal activity and pharmacokinetics of PA-824 in smear-positive tuberculosis patients. Antimicrob Agents Chemother 54:3402–3407. 10.1128/AAC.01354-09. [DOI] [PMC free article] [PubMed] [Google Scholar]
- 12.Diacon AH, Dawson R, Du Bois J, Narunsky K, Venter A, Donald PR, van Niekerk C, Erondu N, Ginsberg AM, Becker P, Spigelman MK. 2012. Phase II dose-ranging trial of the early bactericidal activity of PA-824. Antimicrob Agents Chemother 56:3027–3031. 10.1128/AAC.06125-11. [DOI] [PMC free article] [PubMed] [Google Scholar]
- 13.Diacon AH, Dawson R, von Groote-Bidlingmaier F, Symons G, Venter A, Donald PR, van Niekerk C, Everitt D, Winter H, Becker P, Mendel CM, Spigelman MK. 2012. 14-day bactericidal activity of PA-824, bedaquiline, pyrazinamide, and moxifloxacin combinations: a randomised trial. Lancet 380:986–993. 10.1016/S0140-6736(12)61080-0. [DOI] [PubMed] [Google Scholar]
- 14.Diacon AH, Dawson R, Von Groote-Bidlingmaier F, Symons G, Venter A, Donald PR, Conradie A, Erondu N, Ginsberg AM, Egizi E, Winter H, Becker P, Mendel CM. 2013. Randomized dose-ranging study of the 14-day early bactericidal activity of bedaquiline (TMC207) in patients with sputum microscopy smear-positive pulmonary tuberculosis. Antimicrob Agents Chemother 57:2199–2203. 10.1128/AAC.02243-12. [DOI] [PMC free article] [PubMed] [Google Scholar]
- 15.Diacon AH, Dawson R, von Groote-Bidlingmaier F, Symons G, Venter A, Donald PR, van Niekerk C, Everitt D, Hutchings J, Burger DA, Schall R, Mendel CM. 2015. Bactericidal activity of pyrazinamide and clofazimine alone and in combinations with pretomanid and bedaquiline. Am J Respir Crit Care Med 191:943–953. 10.1164/rccm.201410-1801OC. [DOI] [PubMed] [Google Scholar]
- 16.Zhang N, Savic RM, Boeree MJ, Peloquin CA, Weiner M, Heinrich N, Bliven-Sizemore E, Phillips PPJ, Hoelscher M, Whitworth W, Morlock G, Posey J, Stout JE, Mac Kenzie W, Aarnoutse R, Dooley KE. 2021. Optimising pyrazinamide for the treatment of tuberculosis. Eur Respir J 58:2002013. 10.1183/13993003.02013-2020. [DOI] [PMC free article] [PubMed] [Google Scholar]
- 17.Lyons MA. 2022. Pharmacodynamics and bactericidal activity of bedaquiline in pulmonary tuberculosis. Antimicrob Agents Chemother 66:e0163621. 10.1128/AAC.01636-21. [DOI] [PMC free article] [PubMed] [Google Scholar]
- 18.Lyons MA. 2018. Modeling and simulation of pretomanid pharmacokinetics in pulmonary tuberculosis patients. Antimicrob Agents Chemother 62:e02359-17. 10.1128/AAC.02359-17. [DOI] [PMC free article] [PubMed] [Google Scholar]
- 19.Anderson BJ, Holford NH. 2008. Mechanism-based concepts of size and maturity in pharmacokinetics. Annu Rev Pharmacol Toxicol 48:303–332. 10.1146/annurev.pharmtox.48.113006.094708. [DOI] [PubMed] [Google Scholar]
- 20.Lyons MA. 2019. Modeling and simulation of pretomanid pharmacodynamics in pulmonary tuberculosis patients. Antimicrob Agents Chemother 63:e00732-19. 10.1128/AAC.00732-19. [DOI] [PMC free article] [PubMed] [Google Scholar]
- 21.Tweed CD, Dawson R, Burger DA, Conradie A, Crook AM, Mendel CM, Conradie F, Diacon AH, Ntinginya NE, Everitt DE, Haraka F, Li M, van Niekerk CH, Okwera A, Rassool MS, Reither K, Sebe MA, Staples S, Variava E, Spigelman M. 2019. Bedaquiline, moxifloxacin, pretomanid, and pyrazinamide during the first 8 weeks of treatment of patients with drug-susceptible or drug-resistant pulmonary tuberculosis: a multicentre, open-label, partially randomised, phase 2B trial. Lancet Respir Med 7:1048–1058. 10.1016/S2213-2600(19)30366-2. [DOI] [PMC free article] [PubMed] [Google Scholar]
- 22.Lienhardt C, Nunn A, Chaisson R, Vernon AA, Zignol M, Nahid P, Delaporte E, Kasaeva T. 2020. Advances in clinical trial design: weaving tomorrow’s TB treatments. PLoS Med 17:e1003059. 10.1371/journal.pmed.1003059. [DOI] [PMC free article] [PubMed] [Google Scholar]
- 23.US Food and Drug Administration Center for Drug Evaluation and Research. 2003. Guidance for industry: exposure-response relationships-study design, data analysis, and regulatory applications.
- 24.Sy SK, Zhuang L, Derendorf H. 2016. Pharmacokinetics and pharmacodynamics in antibiotic dose optimization. Expert Opin Drug Metab Toxicol 12:93–114. 10.1517/17425255.2016.1123250. [DOI] [PubMed] [Google Scholar]
- 25.Fors J, Strydom N, Fox WS, Keizer RJ, Savic RM. 2020. Mathematical model and tool to explore shorter multi-drug therapy options for active pulmonary tuberculosis. PLoS Comput Biol 16:e1008107. 10.1371/journal.pcbi.1008107. [DOI] [PMC free article] [PubMed] [Google Scholar]
- 26.Wicha SG, Chen C, Clewe O, Simonsson USH. 2017. A general pharmacodynamic interaction model identifies perpetrators and victims in drug interactions. Nat Commun 8:2129. 10.1038/s41467-017-01929-y. [DOI] [PMC free article] [PubMed] [Google Scholar]
- 27.Drusano GL, Neely MN, Kim S, Yamada WM, Schmidt S, Duncanson B, Nole J, Mtchedlidze N, Peloquin CA, Louie A. 2020. Building optimal three-drug combination chemotherapy regimens. Antimicrob Agents Chemother 64:e01610-20. 10.1128/AAC.01610-20. [DOI] [PMC free article] [PubMed] [Google Scholar]
- 28.Drusano GL, Kim S, Almoslem M, Schmidt S, D’Argenio DZ, Myrick J, Duncanson B, Nole J, Brown D, Peloquin CA, Neely M, Yamada W, Louie A. 2021. The funnel: a screening technique for identifying optimal two-drug combination chemotherapy regimens. Antimicrob Agents Chemother 65:e02172-20. 10.1128/AAC.02172-20. [DOI] [PMC free article] [PubMed] [Google Scholar]
- 29.Kim S, Yamada WM, Duncanson B, Nole J, Rogers S, Parker S, Bacci M, Mtchedlidze N, Peloquin CA, Louie A, Schmidt S, Drusano GL, Neely MN. 2021. Building optimal three-drug combination chemotherapy regimens to eradicate Mycobacterium tuberculosis in its slow-growth acid phase. Antimicrob Agents Chemother 65:e0069321. 10.1128/AAC.00693-21. [DOI] [PMC free article] [PubMed] [Google Scholar]
- 30.Savic RM, Weiner M, MacKenzie WR, Engle M, Whitworth WC, Johnson JL, Nsubuga P, Nahid P, Nguyen NV, Peloquin CA, Dooley KE, Dorman SE, Tuberculosis Trials Consortium of the Centers for Disease Control and Prevention . 2017. Defining the optimal dose of rifapentine for pulmonary tuberculosis: exposure-response relations from two phase II clinical trials. Clin Pharmacol Ther 102:321–331. 10.1002/cpt.634. [DOI] [PMC free article] [PubMed] [Google Scholar]
- 31.Alghamdi WA, Al-Shaer MH, An G, Alsultan A, Kipiani M, Barbakadze K, Mikiashvili L, Ashkin D, Griffith DE, Cegielski JP, Kempker RR, Peloquin CA. 2020. Population pharmacokinetics of linezolid in tuberculosis patients: dosing regimen simulation and target attainment analysis. Antimicrob Agents Chemother 64:e01174-20. 10.1128/AAC.01174-20. [DOI] [PMC free article] [PubMed] [Google Scholar]
- 32.Drusano GL, Preston SL, Hardalo C, Hare R, Banfield C, Andes D, Vesga O, Craig WA. 2001. Use of preclinical data for selection of a phase II/III dose for evernimicin and identification of a preclinical MIC breakpoint. Antimicrob Agents Chemother 45:13–22. 10.1128/AAC.45.1.13-22.2001. [DOI] [PMC free article] [PubMed] [Google Scholar]
- 33.Svensson EM, Aweeka F, Park JG, Marzan F, Dooley KE, Karlsson MO. 2013. Model-based estimates of the effects of efavirenz on bedaquiline pharmacokinetics and suggested dose adjustments for patients coinfected with HIV and tuberculosis. Antimicrob Agents Chemother 57:2780–2787. 10.1128/AAC.00191-13. [DOI] [PMC free article] [PubMed] [Google Scholar]
- 34.Lee SI. 2010. Drug interaction: focusing on response surface models. Korean J Anesthesiol 58:421–434. 10.4097/kjae.2010.58.5.421. [DOI] [PMC free article] [PubMed] [Google Scholar]
- 35.Wood K, Nishida S, Sontag ED, Cluzel P. 2012. Mechanism-independent method for predicting response to multidrug combinations in bacteria. Proc Natl Acad Sci USA 109:12254–12259. 10.1073/pnas.1201281109. [DOI] [PMC free article] [PubMed] [Google Scholar]
- 36.Zimmer A, Katzir I, Dekel E, Mayo AE, Alon U. 2016. Prediction of multidimensional drug dose responses based on measurements of drug pairs. Proc Natl Acad Sci USA 113:10442–10447. 10.1073/pnas.1606301113. [DOI] [PMC free article] [PubMed] [Google Scholar]
- 37.Katzir I, Cokol M, Aldridge BB, Alon U. 2019. Prediction of ultra-high-order antibiotic combinations based on pairwise interactions. PLoS Comput Biol 15:e1006774. 10.1371/journal.pcbi.1006774. [DOI] [PMC free article] [PubMed] [Google Scholar]
- 38.Pandey S, Gruenbaum A, Kanashova T, Mertins P, Cluzel P, Chevrier N. 2020. Pairwise stimulations of pathogen-sensing pathways predict immune responses to multi-adjuvant combinations. Cell Syst 11:495–508.e10. 10.1016/j.cels.2020.10.001. [DOI] [PMC free article] [PubMed] [Google Scholar]
- 39.Geva-Zatorsky N, Dekel E, Cohen AA, Danon T, Cohen L, Alon U. 2010. Protein dynamics in drug combinations: a linear superposition of individual-drug responses. Cell 140:643–651. 10.1016/j.cell.2010.02.011. [DOI] [PubMed] [Google Scholar]
- 40.Einav T, Bloom JD. 2020. When two are better than one: modeling the mechanisms of antibody mixtures. PLoS Comput Biol 16:e1007830. 10.1371/journal.pcbi.1007830. [DOI] [PMC free article] [PubMed] [Google Scholar]
- 41.Irwin SM, Prideaux B, Lyon ER, Zimmerman MD, Brooks EJ, Schrupp CA, Chen C, Reichlen MJ, Asay BC, Voskuil MI, Nuermberger EL, Andries K, Lyons MA, Dartois V, Lenaerts AJ. 2016. Bedaquiline and pyrazinamide treatment responses are affected by pulmonary lesion heterogeneity in mycobacterium tuberculosis infected C3HeB/FeJ mice. ACS Infect Dis 2:251–267. 10.1021/acsinfecdis.5b00127. [DOI] [PMC free article] [PubMed] [Google Scholar]
- 42.Jumbe N, Louie A, Leary R, Liu W, Deziel MR, Tam VH, Bachhawat R, Freeman C, Kahn JB, Bush K, Dudley MN, Miller MH, Drusano GL. 2003. Application of a mathematical model to prevent in vivo amplification of antibiotic-resistant bacterial populations during therapy. J Clin Invest 112:275–285. 10.1172/JCI200316814. [DOI] [PMC free article] [PubMed] [Google Scholar]
- 43.Horne DJ, Royce SE, Gooze L, Narita M, Hopewell PC, Nahid P, Steingart KR. 2010. Sputum monitoring during tuberculosis treatment for predicting outcome: systematic review and meta-analysis. Lancet Infect Dis 10:387–394. 10.1016/S1473-3099(10)70071-2. [DOI] [PMC free article] [PubMed] [Google Scholar]
- 44.Ernest JP, Sarathy J, Wang N, Kaya F, Zimmerman MD, Strydom N, Wang H, Xie M, Gengenbacher M, Via LE, Barry CE, Carter CL, Savic RM, Dartois V. 2021. Lesion penetration and activity limit the utility of second-line injectable agents in pulmonary tuberculosis. Antimicrob Agents Chemother 65:e0050621. 10.1128/AAC.00506-21. [DOI] [PMC free article] [PubMed] [Google Scholar]
- 45.Benson N. 2019. Quantitative systems pharmacology and empirical models: friends or foes? CPT Pharmacometrics Syst Pharmacol 8:135–137. 10.1002/psp4.12375. [DOI] [PMC free article] [PubMed] [Google Scholar]
- 46.Zhou H. 2003. Pharmacokinetic strategies in deciphering atypical drug absorption profiles. J Clin Pharmacol 43:211–227. 10.1177/0091270002250613. [DOI] [PubMed] [Google Scholar]
- 47.Rosenbaum SE. 2016. Basic Pharmacokinetics and Pharmacodynamics: an Integrated Textbook and Computer Simulations. Wiley. [Google Scholar]
- 48.Brill MJE, Kristoffersson AN, Zhao C, Nielsen EI, Friberg LE. 2018. Semi-mechanistic pharmacokinetic-pharmacodynamic modelling of antibiotic drug combinations. Clin Microbiol Infect 24:697–706. 10.1016/j.cmi.2017.11.023. [DOI] [PubMed] [Google Scholar]
- 49.Greco WR, Bravo G, Parsons JC. 1995. The search for synergy: a critical review from a response surface perspective. Pharmacol Rev 47:331–385. [PubMed] [Google Scholar]
- 50.Koch G, Schropp J, Jusko WJ. 2016. Assessment of non-linear combination effect terms for drug-drug interactions. J Pharmacokinet Pharmacodyn 43:461–479. 10.1007/s10928-016-9490-0. [DOI] [PMC free article] [PubMed] [Google Scholar]
- 51.Molins EAG, Jusko WJ. 2018. Assessment of three-drug combination pharmacodynamic interactions in pancreatic cancer cells. AAPS J 20:80. 10.1208/s12248-018-0235-4. [DOI] [PMC free article] [PubMed] [Google Scholar]
- 52.Davies GR. 2010. Early clinical development of anti-tuberculosis drugs: science, statistics and sterilizing activity. Tuberculosis (Edinb) 90:171–176. 10.1016/j.tube.2010.03.007. [DOI] [PubMed] [Google Scholar]
- 53.Mould DR, Walz AC, Lave T, Gibbs JP, Frame B. 2015. Developing exposure/response models for anticancer drug treatment: special considerations. CPT Pharmacometrics Syst Pharmacol 4:e00016. [DOI] [PMC free article] [PubMed] [Google Scholar]
- 54.Nielsen EI, Friberg LE. 2013. Pharmacokinetic-pharmacodynamic modeling of antibacterial drugs. Pharmacol Rev 65:1053–1090. 10.1124/pr.111.005769. [DOI] [PubMed] [Google Scholar]
- 55.Lyons MA. 2021. Pretomanid dose selection for pulmonary tuberculosis: an application of multi-objective optimization to dosage regimen design. CPT Pharmacometrics Syst Pharmacol 10:211–219. 10.1002/psp4.12591. [DOI] [PMC free article] [PubMed] [Google Scholar]
- 56.Pipeline. Working group for new TB drugs. https://www.newtbdrugs.org/pipeline/clinical.
- 57.Salinger DH, Subramoney V, Everitt D, Nedelman JR. 2019. Population pharmacokinetics of the antituberculosis agent pretomanid. Antimicrob Agents Chemother 63:e00907-19. 10.1128/AAC.00907-19. [DOI] [PMC free article] [PubMed] [Google Scholar]
- 58.Denti P, Jeremiah K, Chigutsa E, Faurholt-Jepsen D, PrayGod G, Range N, Castel S, Wiesner L, Hagen CM, Christiansen M, Changalucha J, McIlleron H, Friis H, Andersen AB. 2015. Pharmacokinetics of isoniazid, pyrazinamide, and ethambutol in newly diagnosed pulmonary tb patients in Tanzania. PLoS One 10:e0141002. 10.1371/journal.pone.0141002. [DOI] [PMC free article] [PubMed] [Google Scholar]
- 59.Alsultan A, Savic R, Dooley KE, Weiner M, Whitworth W, Mac Kenzie WR, Peloquin CA, the Tuberculosis Trials Consortium . 2017. Population pharmacokinetics of pyrazinamide in patients with tuberculosis. Antimicrob Agents Chemother 61:e02625-16. 10.1128/AAC.02625-16. [DOI] [PMC free article] [PubMed] [Google Scholar]
- 60.Ankomah P, Levin BR. 2012. Two-drug antimicrobial chemotherapy: a mathematical model and experiments with Mycobacterium marinum. PLoS Pathog 8:e1002487. 10.1371/journal.ppat.1002487. [DOI] [PMC free article] [PubMed] [Google Scholar]
- 61.Gelman A, Carlin JB, Stern HS, Dunson DB, Vehtari A, Rubin DB. 2013. Bayesian Data Analysis, Third Edition. Chapman and Hall/CRC, Boca Raton, FL. [Google Scholar]
- 62.Rao GG, Li J, Garonzik SM, Nation RL, Forrest A. 2018. Assessment and modelling of antibacterial combination regimens. Clin Microbiol Infect 24:689–696. 10.1016/j.cmi.2017.12.004. [DOI] [PubMed] [Google Scholar]
- 63.Tasneen R, Williams K, Amoabeng O, Minkowski A, Mdluli KE, Upton AM, Nuermberger EL. 2015. Contribution of the nitroimidazoles PA-824 and TBA-354 to the activity of novel regimens in murine models of tuberculosis. Antimicrob Agents Chemother 59:129–135. 10.1128/AAC.03822-14. [DOI] [PMC free article] [PubMed] [Google Scholar]
- 64.Xu J, Li SY, Almeida DV, Tasneen R, Barnes-Boyle K, Converse PJ, Upton AM, Mdluli K, Fotouhi N, Nuermberger EL. 2019. Contribution of pretomanid to novel regimens containing bedaquiline with either linezolid or moxifloxacin and pyrazinamide in murine models of tuberculosis. Antimicrob Agents Chemother 63:e00021-19. 10.1128/AAC.00021-19. [DOI] [PMC free article] [PubMed] [Google Scholar]
- 65.Craig WA. 2001. Does the dose matter? Clin Infect Dis (33 Suppl 3):S233–S237. 10.1086/321854. [DOI] [PubMed] [Google Scholar]
- 66.Bois FY. 2009. GNU MCSim: Bayesian statistical inference for SBML-coded systems biology models. Bioinformatics 25:1453–1454. 10.1093/bioinformatics/btp162. [DOI] [PubMed] [Google Scholar]
Associated Data
This section collects any data citations, data availability statements, or supplementary materials included in this article.
Supplementary Materials
Supplemental material. Download aac.00898-22-s0001.pdf, PDF file, 0.4 MB (411.1KB, pdf)