

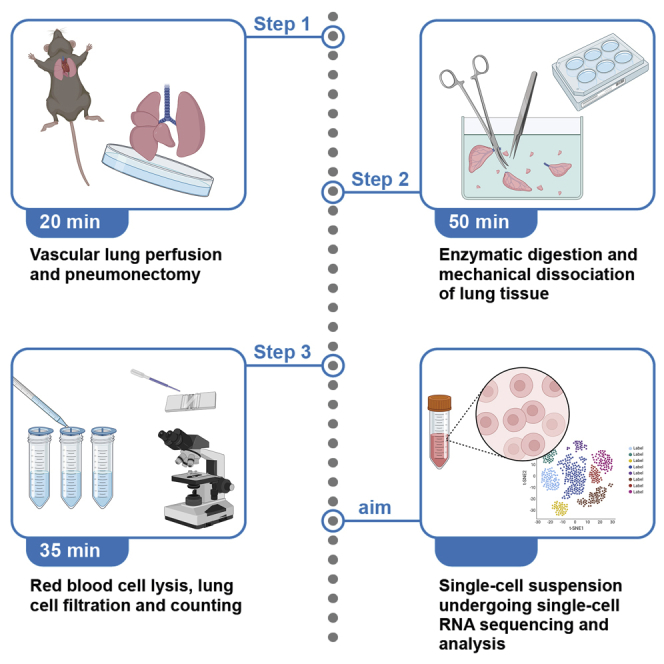
Summary
In infectious disease research, single-cell RNA sequencing allows dissection of host-pathogen interactions. As a prerequisite, we provide a protocol to transform solid and complex organs such as lungs into representative diverse, viable single-cell suspensions. Our protocol describes performance of vascular perfusion, pneumonectomy, enzymatic digestion, and mechanical dissociation of lung tissue, as well as red blood cell lysis and counting of isolated cells. A challenge remains, however, to further increase the proportion of pulmonary endothelial cells without compromising on viability.
For complete details on the use and execution of this protocol, please refer to Nouailles et al. (2021),1 Wyler et al. (2022),2 and Ebenig et al. (2022).3
Subject areas: Cell Biology, Cell isolation, Single Cell
Graphical abstract
Highlights
-
•
Protocol to isolate murine and hamster lungs with and without prior perfusion
-
•
Enzymatic digestion and dissociation to obtain highly viable single-cell suspension
-
•
Protocol suitable for infected animals in biosafety laboratory conditions 1–3
Publisher’s note: Undertaking any experimental protocol requires adherence to local institutional guidelines for laboratory safety and ethics.
In infectious disease research, single-cell RNA sequencing allows dissection of host-pathogen interactions. As a prerequisite, we provide a protocol to transform solid and complex organs such as lungs into representative diverse, viable single-cell suspensions. Our protocol describes performance of vascular perfusion, pneumonectomy, enzymatic digestion, and mechanical dissociation of lung tissue, as well as red blood cell lysis and counting of isolated cells. A challenge remains, however, to further increase the proportion of pulmonary endothelial cells without compromising on viability.
Before you begin
The protocol below describes how to prepare a single-cell suspension from infected murine lung tissue that were challenged with human pathogens and required biosafety level 2 (BSL-2) working conditions. However, a very similar protocol can be used to isolate pulmonary cells from SARS-CoV-2 infected Syrian hamsters with just minor adaptations to implement specific BSL-3 safety regulations. The protocol was likewise suitable for corresponding uninfected mouse and hamster controls.
The lungs harbor a variety of structural and immune cells, which collectively facilitate crucial physiological processes including gaseous exchange and pulmonary secretions (surfactant, mucus), while also enabling antimicrobial functions such as bacterial sensing and phagocytosis.5
Institutional permissions
All procedures affecting animals were approved by the institutional and local governmental authorities (Landesamt für Gesundheit und Soziales Berlin, Germany or Regierungspräsidium Darmstadt, Germany). Users of this protocol should note that permissions for experiments on live vertebrates must be acquired in advance from the relevant institutions. Local and governmental regulations concerning handling of (genetically modified) infectious agents must also be obeyed and the respective procedures authorized and carried out under the appropriate biosafety conditions until authorized inactivation of all biological material takes place.
Preparation of reagents and buffers
Timing: 2–7 days before experiment
-
1.Calculate and prepare the required amounts of stock solutions and buffers ahead of the experiment (see materials and equipment).
-
a.Prepare bovine serum albumin (BSA)-containing buffers in 1× phosphate-buffered saline (PBS). For convenience, prepare a 4% BSA/PBS stock solution by dissolving BSA in 1× PBS, filter through a 0.22 μm membrane for sterilization and store at 4°C until required.
-
b.Two – 7 days before experiment dilute stock solution 1:4, 1:8 and 1:100 in sterile 1× PBS to prepare 1%, 0.5% and 0.04% BSA/PBS buffers, respectively.
-
c.Prepare sterile 1× red blood cell (RBC) lysis buffer by diluting 10× RBC lysis solution 1:10 with distilled water, followed by filtration through a 0.22 μm membrane.
-
d.Prepare sterile 2 mg/mL actinomycin D stock solution by dissolving actinomycin D powder in methanol followed by filtration. Aliquot and store solution in liquid nitrogen or −150°C until usage.
-
a.
Note: Actinomycin D stock solution should be protected from light, stored frozen and added to corresponding buffers on the day of the experiment. Please be aware that actinomycin D adheres to plastic and glass and therefore solutions must be prepared fresh from frozen stock every time.
Note: As an extensive stress gene signature could overlay biological gene expression patterns, it is beneficial to add transcriptional inhibitors like actinomycin D6 (used in this protocol) to buffers and digestion media to reduce procedure-induced stress gene transcription. Since these inhibitors reduce the rate of de novo RNA transcription, the impact of the procedure on live cells can be minimized.
Note: Even though sterility is not required for this protocol, we recommend sterile filtration of buffers (e.g., by vacuum filtration through 0.22 μm membranes), as it prolongs storage times and enables use of buffers with other protocols.
-
2.
Calculate and aliquot required quantities of enzymes and store aliquots at appropriate temperature (collagenase CLS II at 4°C, DNase I at −20°C, dispase at −20°C; see materials and equipment for enzyme quantities per whole lung).
Get reagents and buffers ready for the experiment
The quality of results critically depends on fast processing of lung cells after explantation. Thus, all time-consuming steps that can be performed prior to pneumonectomy should be prepared and/or executed in advance.
-
3.
Prepare fresh lung digestion medium by dissolving appropriate amounts of aliquoted enzymes in thawed dispase solution (see materials and equipment).
-
4.
Thaw the appropriate amount of Dispase solution for lung perfusion medium (see materials and equipment).
-
5.
Thaw aliquoted actinomycin D stock solution and add to 1% BSA/PBS buffer, lung perfusion buffer and lung digestion medium to a final concentration of 2 μg/mL.
-
6.
Place lung digestion medium, lung perfusion medium, buffers, 1× PBS and RBC lysis buffer on ice until required.
Note: Do not use any buffers containing EDTA, as it interferes with dispase and with reverse transcriptase for cDNA conversion in subsequent single-cell RNA-sequencing (scRNA-seq) workflows.
Key resources table
| REAGENT or RESOURCE | SOURCE | IDENTIFIER |
|---|---|---|
| Antibodies | ||
| Anti-mouse CD16/32 (clone: 2.4G2); use 1:200 | BD Biosciences | Cat# 553142; RRID: AB_394657 |
| FITC rat anti-mouse CD45 (clone: 30-F11), use 1:400 | BD Biosciences | Cat# 553080; RRID: AB_394610 |
| PE anti-mouse CD326 EpCAM (clone: G8.8), use 1:100 | BioLegend | Cat# 118205; RRID: AB_1134176 |
| PerCP/Cyanine5.5 anti-mouse CD31 (clone: MEC13.3), use 1:333 | BioLegend | Cat# 102522; RRID: AB_2566761 |
| Chemicals, peptides, and recombinant proteins | ||
| RBC lysis buffer, 10× | Santa Cruz Biotechnology | Cat# sc-296258 |
| Gibco™ DPBS, no calcium, no magnesium | Thermo Fisher Scientific | Cat# 14190094 |
| Actinomycin D | Sigma-Aldrich /(Merck) | Cat# A9415-5MG |
| Albumin, from bovine serum | Sigma-Aldrich /(Merck) | Cat# A7030-100G |
| Dispase | Corning | Cat# 354235 |
| DNase I | Panreac AppliChem | Cat# A3778,0500 |
| Collagenase type II, Cls II | Sigma-Aldrich /(Merck) | Cat# C2-22-1G |
| Collagenase B | Roche | Cat#11088815001 |
| Fixable Viability Dye eFluor™ 780, use 1:333 | eBioscience | Cat# 65-0865-14 |
| Trypan blue | Sigma-Aldrich /(Merck) | Cat# 111732 |
| Methanol >99,5%, | Carl Roth GmbH | Cat# CP43.2 |
| Critical commercial assays | ||
| Chromium Next GEM Single Cell 3′ Kit v3.1 | 10x Genomics, Inc. | Cat# 1000268 |
| Chromium i7 Multiplex Kit | 10x Genomics, Inc | Cat# 120262 |
| Chromium Next GEM Chip G Single Cell Kit | 10x Genomics, Inc | Cat# 1000120 |
| Qubit™ dsDNA HS Assay Kit | Thermo Fisher Scientific | Cat# Q32851 |
| KAPA Library Quantification Kits - Complete Kit (Universal) | Roche Sequencing | Cat# 07960140001 |
| Bioanalyzer High Sensitivity DNA Analysis | Agilent | Cat# 5067-4626 |
| NextSeq 500/550 High Output Kit v2.5 (150 Cycles) | Illumina | Cat# 20024907 |
| Deposited data | ||
| Raw Data Mouse | Pennitz et al.4 | https://www.health-atlas.de/data_files/563?graph_view=tree |
| scRNA-seq Hamster | Ebenig et al.3 | GEO: GSE196938 |
| Experimental models: Organisms/strains | ||
| Mouse: C57BL/6JRj, female / male, adult (6–12 weeks) |
Janvier Labs | RRID: MGI:2670020 |
| Hamster: RjHan:AURA, female / male, adult (6–12 weeks) HsdHan:AURA, female / male, adult (6–12 weeks) |
Janvier Labs Envigo |
N/A Art# 8903 |
| Software and algorithms | ||
| R | R Core Team | https://www.r-project.org/ |
| R Studio | R Studio Inc. | https://www.rstudio.com/ |
| R Package: Seurat | Satija Lab | https://satijalab.org/seurat/ |
| R Package: ggplot | Tidyverse | https://ggplot2.tidyverse.org/ |
| Cell Ranger Software | 10x Genomics, Inc. | https://support.10xgenomics.com/single-cell-gene-expression/software/pipelines/latest/installation |
| GraphPad Prism, Version 9 | GraphPad Software | https://www.graphpad.com/scientific-software/prism/ |
| FlowJo | FlowJo | https://www.flowjo.com/ |
| FACS Diva | BD Biosciences | https://www.bdbiosciences.com/ |
| Inkscape | Inkscape Community | https://inkscape.org/de/ |
| Other | ||
| 6-well plate | Corning | Cat# 353046 |
| 5 mL polystyrene tubes | Corning | Cat# 352052 |
| 50 mL conical tubes | Corning | Cat# 352070 |
| 70 μm cell strainer | Greiner Bio-One | Cat# 542070 |
| 40 μm cell strainer | Greiner Bio-One | Cat# 542040 |
| Syringe filters ROTILABO® | Carl Roth GmbH | Cat# P666.1 |
| Flowmi® Cell Strainers | Sigma-Aldrich /(Merck) | Cat# BAH136800040-50EA |
| 500 mL Vacuum Filter/Storage Bottle System | Corning | Cat# 431097 |
| Qubit 4 Fluorimeter | Thermo Fisher | Cat#Q33238 |
| 2100 Bioanalyzer Instrument | Agilent | Part#G2939BA |
| Novaseq 6000 | Illumina | Cat#20013850 |
| NextSeq 550 | Illumina | Cat#SY-415-1002 |
| Chromium Controller | 10x Genomics | Prod# 1000204 |
Materials and equipment
The buffer recipes refer to whole murine lungs and right caudal lobes of Syrian hamsters. If whole Syrian hamster lungs shall be analyzed a triplication of the amount is advised.
2 mg/mL actinomycin D stock solution
| Reagent | Final concentration | ∼ Amount per murine lungs / hamster lung lobe |
|---|---|---|
| Methanol | – | 40 μL |
| Actinomycin D | 2 mg/mL | 80 μg |
| Total | 40 μL |
Prepare in advance, perform sterile filtration and store in liquid nitrogen∗ for up to 6 months. Protect from light. Prepare in excess. ∗ Storage at - 80°C is not an alternative due to the freezing point of methanol.
4% BSA/PBS stock solution
| Reagent | Final concentration | ∼ Amount per murine lungs / hamster lung lobe |
|---|---|---|
| 1× PBS | – | 10 mL |
| BSA | 40 mg/mL | 0.4 g |
| Total | 10 mL |
Prepare in advance, perform sterile filtration and store at 4°C for up to two months. Prepare in excess.
1% BSA/PBS buffer∗
| Reagent | Final concentration | ∼ Amount per murine lungs / hamster lung lobe |
|---|---|---|
| 1× PBS | – | 18.75 mL |
| 4% BSA/PBS stock solution | 10 mg/mL | 6.25 mL |
| 2 mg/mL actinomycin D stock solution | 2 μg/mL | 25 μL |
| Total | 25 mL |
Prepare 1% BSA/PBS in advance and store at 4°C. Actinomycin D needs to be protected from light and added fresh on the day of the experiment. Unused solution should be discarded. ∗instead of 1% BSA/PBS, 0.5% BSA/PBS buffer has successfully been used.
0.04% BSA/PBS buffer
| Reagent | Final concentration | ∼ Amount per murine lungs / hamster lung lobe |
|---|---|---|
| 1× PBS | – | 24.75 mL |
| 4% BSA/PBS stock solution | 0.4 mg/mL | 0.25 mL |
| Total | 25 mL |
0.04% BSA/PBS is the concentration of BSA recommended for mRNA barcoding steps. Prepare in advance and store at 4°C for up to two months. Ingredients should be sterile. Can be prepared in excess.
Lung perfusion medium (optional)
| Reagent | Final concentration | Amount per murine lungs / hamster lung lobe |
|---|---|---|
| Dispase | 5.000 IU/mL | 5 mL |
| 2 mg/mL actinomycin D stock solution | 2 μg/mL | 5 μL |
| Total | 5 mL |
Prepare fresh on the day of the experiment as per experimental need, store at 4°C. Unused solution should be discarded. Ingredients should be sterile.
Lung digestion medium
| Reagent | Final concentration | Amount per murine lungs / hamster lung lobe |
|---|---|---|
| DNase I | 1 mg/mL | 2 mg |
| Collagenase | 750 IU/mL | 1.500 IU (Collagenase CLS II) |
|
alternative: 0.4395 U/mL |
alternative: 0.879 U (Collagenase B) |
|
| Dispase | 5.000 U/mL | 2 mL |
| 2 mg/mL actinomycin D stock solution | 2 μg/mL | 2 μL |
| Total | 2 mL |
Prepare fresh on the day of the experiment as per experimental need, store at 4°C prior to the experiment. Unused solution should be discarded. Ingredients should be sterile. Collagenase B has successfully been used instead of Collagenase CLS II.
RBC lysis buffer
| Reagent | Final concentration | ∼ Amount per murine lungs / hamster lung lobe |
|---|---|---|
| 10× RBC lysis buffer | 1× | 1 mL |
| ddH2O | – | 9 mL |
| Total | 10 mL∗ |
Prepare in advance as per experimental need, store at 4°C and use at 20°C. ddH2O: Double-distilled water. ∗ Non-perfused lungs may require up to 10 mL due to the residual blood. For perfused mouse lungs 2 mL of 1× RBC lysis buffer is sufficient, while hamster lungs required 5 mL. Prepare in excess in case first lysis attempt fail.
CRITICAL: The following reagents are harmful and precautions should be taken in order to avoid the indicated hazards.
-
•
Dispase may cause allergy, asthma symptoms or breathing difficulties if inhaled.
-
•
Actinomycin D is fatal if swallowed, may cause cancer, damage fertility and harm the unborn child.
-
•
Methanol is a highly flammable liquid and vapor, toxic if swallowed, and may cause irritation in case of contact with skin or inhalation and may also cause ocular damage.
-
•
Collagenase CLS II may cause allergy, asthma symptoms or breathing difficulties if inhaled.
-
•
Trypan blue may cause cancer.
Alternatives: Published alternatives for the transcription inhibitor actinomycin D, which blocks de novo RNA transcription during cell isolation, include DSP (dithiobis succinimidyl propionate)7 and CellCover8 reagent.
Alternatives: Published alternatives for enzymes used to isolate viable lung cells include Liberase9 (commercially available purified enzyme blends containing collagenase and neutral protease), collagenase B or elastase.10 For kidney tissue cold protease digestion was successfully tested to significantly reduce the expression of stress genes and artifacts.11,12
Step-by-step method details
Vascular lung perfusion and pneumonectomy
This step details handling of experimental animals and lung excision with or without prior perfusion (optional). Animals are sacrificed either by bleeding out via heat puncture (after step 1) or by bleeding out through transection of the abdominal vena cava (step 5).
-
1.
Subject laboratory animals to deep anesthesia according to approved protocols e.g., with 3-fold overdosed anesthetics. Confirm depth of anesthesia by loss of pedal withdrawal reflex.
Note: If working under BSL-3 conditions, make sure to wear appropriate PPE including chain gloves when handling animals while they are still awake and to use appropriate safety needles and sharps.
Note: If protocol without perfusion is performed animals can be sacrificed at this step by bleeding out via heart puncture. If analysis of blood or serum is to be performed in parallel, it can be collected here and placed in an EDTA or clotting tube, respectively. EDTA blood should be kept on ice, whilst clotting should be allowed to occur at 20°C.
Note: Protocols with and without perfusion generated valid results. Past reasons to follow a protocol without perfusion were in our case e.g., i) necessity to increase speed of experimental procedures, ii) regulatory limitations restricting use of sharps in biosafety level 3 laboratory and iii) approved animal experimental protocols for sacrifice by bleeding out via heart puncture instead of vena cava.
-
2.
Place anesthetized animals in a secured supine position.
-
3.
Soak abdominal and thoracic areas with 70% ethanol to disinfect the fur and keep the surgical instruments sterile.
-
4.
Open the abdominal cavity by incising the abdominal skin and peritoneum from the sternum to the pubis using surgical scissors and forceps.
-
5.
Sacrifice the animal by bleeding out through transection of the abdominal vena cava (in case bleeding out via heart puncture has not been performed after step 1).
Note: If analysis of blood or serum is to be performed in parallel, it can be collected here from the abdominal vena cava in a 1 mL syringe using a 27G needle and placed in an EDTA or clotting tube, respectively. EDTA blood should be kept on ice, whilst clotting should be allowed to occur at 20°C.
-
6.
Open the thoracic cavity and expose the heart and lungs.
-
7.
Without perfusion continue with step 9, with perfusion proceed with step 8.
-
8.
Perfuse the pulmonary vessels through the animals’ right heart ventricle by slowly flushing with 5 mL lung perfusion medium using a 5 mL syringe capped with a 26G needle (Figure 1).
Note: The perfusion step allows for removal of blood cells within the pulmonary vessels.
-
9.
Lift up the lungs by pulling the trachea, dissect them free and dip them twice into ice-cold PBS to remove residual fluid or blood.
-
10.
Remove the trachea.
-
11.
Place the lungs (mice) or right caudal lobe (hamsters) in an individual well of a 6-well plate (Figure 1H) or in an individual petri dish and add 2 mL lung digestion medium.
Note: If dissecting multiple animals one after another, place lungs into 3 mL RPMI medium or PBS containing 1% BSA and 2 μg/mL actinomycin D on ice until all animals are dissected, then proceed with step 11.
Figure 1.

Lung perfusion and pneumonectomy
(A) Illustration displaying perfusion of pulmonary vessels through the right heart ventricle.
(B) Medial thoracotomy was performed to enable access to the heart.
(C and D) (C) The heart is fixed in position with tweezers to inject perfusion needle and (D) ejection of lung perfusion media.
(E) Illustration displaying prepared trachea and perfused lungs.
(F) Heart and thymus are removed facilitating access to the lungs.
(G) Pneumonectomy is performed without tissue contact by lifting the trachea.
(H) Once transferred to cell culture dish, remaining parts of the trachea are removed and dissected lungs (without trachea) are stored in digestion media.
Enzymatic digestion and mechanical dissociation of lung tissue
This step details how enzymatic digestion in combination with gentle mechanical force allows for dissociation of solid lung tissue into single cell suspension.
Note: For processing multiple lungs, the following steps are carried out in parallel for each well. Clean forceps with 1× PBS before moving on to the next well.
-
12.
Within the digestion medium, mechanically dissociate the tissue by securing it with straight anatomical forceps in one hand and repeatedly hitting it with a second curved anatomical set of forceps held in the other hand for approximately 2–3 min. Alternatively, lungs can be cut into <1 mm pieces using pointed scissors (Figure 2).
Note: We have experienced that dissociating lung tissue with clapping forceps results in higher numbers of structural lung cells.
-
13.
Incubate at 37°C (with occasional shaking, e.g., using an orbital shaker at 0.26 × g) for 30 min.
-
14.
Add 8 mL ice-cold 1% BSA/PBS buffer to stop enzymatic digestion.
-
15.
Pipette the tissue and liquid up and down 3–10 times using a 5 mL serological pipette to further disrupt the lung tissue. Avoid introducing air bubbles.
-
16.
Collect the complete suspension in a 10 mL serological pipette and discharge onto a 70 μm cell strainer placed on top of a 50 mL conical tube.
-
17.
Use the plunger of a 5 mL syringe to gently swipe remaining lung tissue through the cell strainer.
-
18.
Rinse the well with 10 mL cold 1% BSA/PBS or 0.5% BSA/PBS buffer and pass it through the cell strainer to retrieve the maximal number of cells.
-
19.
Centrifuge the cell suspension at 300 × g for 5 min at 4°C and discard the supernatant.
Figure 2.

Mincing of murine lung tissue in digestion medium
(A) Mechanical dissociation of lung tissue by repeatedly clapping with forceps.
(B) Result when of lung tissue was minced using pointed scissors.
Red blood cell lysis, cell filtration and counting
This step details red blood cell lysis, and washing and counting of lung cells.
-
20.
Add RBC lysis buffer (2–10 mL) to the cell pellet and carefully resuspend. Incubate the suspension for 2–5 min at 20°C.
Note: The required volume and incubation time is dependent on the rodent species and prior vascular perfusion of lungs. We recommend testing appropriate volume and incubation times for individual experimental settings. In our hands, 2 mL RBC lysis buffer and 2 min incubation time was sufficient for perfused mouse lungs while 10 mL RBC lysis buffer and 5 min incubation time was sufficient for non-perfused hamster lungs.
-
21.
Stop RBC lysis by adding at least 10 mL 0.04% BSA/PBS buffer.
-
22.
Centrifuge cell suspension at 300 × g for 6 min at 4°C and discard supernatant.
-
23.
To ensure that RBC are lysed, check if pellet has turned colorless (Figure 3). If not repeat steps 18–21.
-
24.
Resuspend the cell pellet in 4–10 mL of 0.04% BSA/PBS buffer.
-
25.
Filter the single cell suspension by discharge onto a 40 μm cell strainer placed on top of a 15 mL conical tube.
-
26.Determine the cell concentration by counting cells using a Neubauer hemocytometer:
-
a.Dilute the single cell suspension 1:10 in trypan blue solution by adding 20 μL cell suspension to 180 μL trypan blue solution and gently pipette to allow mixing.
-
b.Count cells in the 4 square subdivisions placed at the corners of a Neubauer hemocytometer (S1 – S4).
-
c.Calculate the cell concentration for each sample.
-
a.
-
27.
Visually check cell viability and singularity on the hemocytometer.
Note: Viability should be at least 80%. A high proportion of dead cells indicates problematic handling of tissue, e.g., due to enzyme concentrations, incubation time and other processing steps being too harsh. See troubleshooting section (problem 1).
Note: To increase the fraction of viable cells in the single cell suspension, depletion of dead cells using magnetic cell separation or fluorescence-activated cell sorting can be performed.
-
28.
Adjust the single cell suspension to approximately 500 μL to 1 mL suspension with an appropriate concentration for single-cell RNA-sequencing by diluting with 0.04% BSA/PBS buffer.
-
29.
Filter 500 μL to 1 mL of the diluted suspension with Flowmi® cell strainers (40 μm) to ultimately remove cell clumps (Figure 4).
Note: The optimal cell density for the demonstrated single-cell sequencing approach using the Chromium Next GEM Single Cell 3′ Kit v3.1 (10x Genomics) was 4 × 10⁵ – 2 × 10⁶ cells/mL. Low concentrations of BSA in buffers are recommended for mRNA barcoding steps by the manufacturer.
Note: Labeling or barcoding of mRNA needs to be performed as soon as possible after processing of the final single cell suspension. Please refer to the desired manufacturer’s protocol for step-by-step instructions.
Figure 3.

Cell pellets prior and after red blood cell lysis
(A and B) (A) Cell pellet containing RBC (as indicated by the red color) prior to adding RBC lysis buffer (left) and (B) after successful RBC lysis (right).
Figure 4.
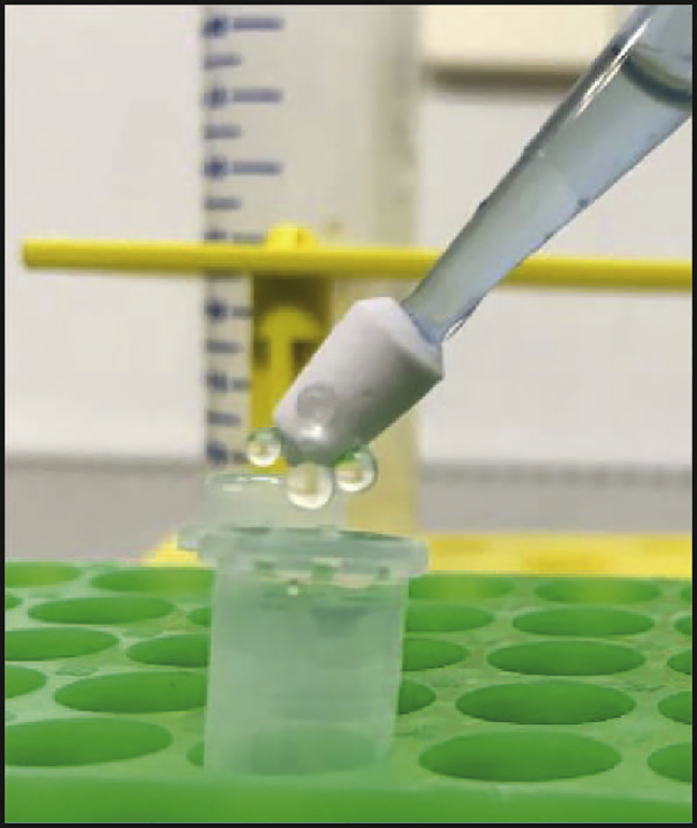
Removal of cell clumps
Cell filtering via Flowmi.
In the demonstrated approach that generated the data shown in Figure 5, the Chromium Next GEM Single Cell 3′ Kit v3.1 (10x Genomics) was used for mRNA barcoding, reverse transcription, and single-cell transcriptome library preparation (https://assets.ctfassets.net/an68im79xiti/1eX2FPdpeCgnCJtw4fj9Hx/7cb84edaa9eca04b607f9193162994de/CG000204_ChromiumNextGEMSingleCell3_v3.1_Rev_D.pdf). Next generation sequencing was performed using a NextSeq 500/550 High Output Kit v2.5 (150 Cycles) on a NextSeq500 device (both Illumina).
Figure 5.

Cell viability control by flow cytometry and anticipated cell population identified by single-cell analysis
(A) Dot plots of isolated single-cells blocked with CD16/32 (FcR block, anti-mouse CD16/32, use 1:200) and stained with monoclonal antibodies (mAbs) against CD45 (leukocyte marker, FITC anti-mouse CD45, use 1:400), CD326 (epithelial cell marker, PE anti-mouse CD326, use 1:100), CD31 (endothelial cell marker, PerCP/Cyanine5.5 anti-CD31, use 1:333) and fixable viability dye (FVD; dead cell marker, use 1:333). Forward scatter (FSC) and side scatter (SSC) plots represent size and granularity of cells, respectively. R0: represents counting beads, R1 represents all cells minus debris. Cells gated on R1 are displayed for CD45, CD326 and CD31 positive populations to identify leukocytes (R2), epithelial cells (R3) and endothelial cells (R4), respectively. FVD was used to stain dead cells (R5) and to allow discrimination of viable leukocytes, epithelial and endothelial cells (R6 to R8) from dead cells.
(B and C) (B) UMAP plot displaying clustering and annotation of sequenced and bioinformatically evaluated naive murine lung cells and (C) pie chart indicating proportions of sequenced and annotated lung cell types. AM: Alveolar macrophages, Mɸ: Interstitial macrophages/monocytes, DC: Dendritic cells, PMN: Polymorphonuclear leukocytes, AT1: Alveolar epithelial cells type 1, AT2: Alveolar epithelial cells type 2, EC: Endothelial cells, FB: Fibroblasts, SMC: Smooth muscle cells, PC: Pericytes, MC: Mesothelial cells, NK: Natural killer cells, TC: T cells, BC: B cells, UMAP: Uniform manifold approximation and projection.
Expected outcomes
The aim of this protocol is to provide an easy-to-handle lung cell isolation and processing workflow that has been performed under high containment biological laboratories and is thus suitable for infectious disease research. Processing naïve lung tissue according to steps 1 to 29 should provide a single cell suspension containing approximately 1 × 10⁷ cells (murine C57BL/6J lungs and Syrian hamsters’ caudal lung lobe). Cell numbers can vary, depending on age, disease, infectious agent and time point of analysis. Cell suspensions should include alveolar, interstitial, and inflammatory macrophages, dendritic cells, granulocytes, alveolar epithelial cells type 1 and type 2, ciliated cells, endothelial cells, lymphatic endothelial cells, fibroblasts, smooth muscle cells, pericytes, mesothelial cells, natural killer cells, T cells and B cells with singularity and viability rates of above 90%, thereby fulfilling the necessary technical quality criteria for subsequent single-cell RNA-sequencing. The expected unsorted (not enriched or depleted for any specific cell type) physiological frequencies of pulmonary cell types after barcoding, library preparation and sequencing are displayed in Figure 5.
Generated sequencing data can be processed in a straightforward way using the demonstrated Vignette of R Package Seurat.13,14,15 The adapted code for generating a murine lung Seurat Object from a single sequencing file is displayed in Code Boxes 1 and 2. Integrational approaches (including different species data) and more complex analyses have been described previously.4
Code Box 1. Creation of Seurat Object using SCTransform in R.
>library(ggplot2)
>library(dplyr)
>library(Seurat)
>library(patchwork)
>library(sctransform)
>library(hdf5r)
>library(glmGamPoi)
>MLung_data <- Read10×_h5("…/outs/filtered_feature_bc_matrix.h5", use.names = TRUE) #In this case H5 Files are publically available to start the Pipeline. If filtered_feature_bc_matrix Objects are available start Workflow with:
# >MLung_data <- Read10×(data.dir = ".../outs/filtered_feature_bc_matrix")
>MLung <- CreateSeuratObject(MLung_data, project = "Mouse_lung")
>MLung <- PercentageFeatureSet(MLung, pattern = "ˆmt-", col.name = "percent.mt")
>MLung <- SCTransform(MLung, vars.to.regress = "percent.mt")
>if (!requireNamespace("BiocManager", quietly = TRUE)) install.packages("BiocManager")
>MLung <- SCTransform(MLung, method = "glmGamPoi", vars.to.regress = "percent.mt")
>MLung <- RunPCA(MLung)
>ElbowPlot(MLung, ndims = 50)
#credits to: Harvard Chan Bioinformatics Core 16 : https://hbctraining.github.io/scRNA-seq/lessons/elbow_plot_metric.html
>pct <- MLung[["pca"]]@stdev / sum(MLung[["pca"]]@stdev) ∗ 100
>cumu <- cumsum(pct)
>co1 <- which(cumu > 90 & pct < 5)[1]
>co1
>co2 <- sort(which((pct[1:length(pct) - 1] - pct[2:length(pct)]) > 0.1), decreasing = T)[1] + 1
>co2
>pcs <- min(co1, co2)
>pcs
>plot_df <- data.frame(pct = pct,
> cumu = cumu,
> rank = 1:length(pct))
>ggplot(plot_df, aes(cumu, pct, label = rank, color = rank > pcs)) +
> geom_text() +
> geom_vline(xintercept = 90, color = "grey") +
> geom_hline(yintercept = min(pct[pct > 5]), color = "grey") +
> theme_bw()
>MLung <- RunUMAP(MLung, dims = 1:39)
# seems to work better if maximal information according to line 27 is considered
>MLung <- FindNeighbors(MLung, dims = 1:39)
>MLung <- FindClusters(MLung, resolution = 0.8)
# resolution = 0.8 is default setting, increase to get more clusters, decrease for less
>DimPlot(MLung, label = TRUE)
>#saveRDS(MLung, file = "…/MLung_seurat_from_H5.rds")
Code Box 2. Visualization of the generated Seurat Object.
>MLung <- readRDS("…/ MLung_seurat_from_H5.rds ")
#Marker genes in Dotplot
>features <- c("Marco","Adgre1", "Flt3", "Cxcr2", "Siglecf", "Ncr1", "Cd3e", "Cd79a", "Epcam", "Akap5", "Lamp3", "Foxj1", "Pecam1", "Cdh5", "Mmrn1", "Inmt", "Acta2", "Cox4i2", "Msln")
>DotPlot(MLung, features = features) + RotatedAxis()
>MLung$populations <- paste("C", MLung$seurat_clusters)
>MLung@active.ident = factor(MLung$populations)
>MLung <- RenameIdents (MLung, "C 0" = "B cells", 'C 1' = "Endothelial cells", 'C 2' = "T cells", 'C 3' = "B cells", 'C 4' = "T cells", 'C 5' = "Fibroblasts", 'C 6' = "T cells", 'C 7' = "AT2", 'C 8' = "NK cells", 'C 9' = "Fibroblasts", 'C 10' = "T cells", 'C 11' = "AT1", 'C 12' = "AM", 'C 13' = "Pericytes", 'C 14' = "Endothelial cells", 'C 15' = "PMN", 'C 16' = "Macrophages", 'C 17' = "T cells", 'C 18' = "DC", "C 19" = "T cells", "C 20" = "T cells", "C 21" = "Mesothelial cells", "C 22" = "SMC", "C 23" = "Macrophages")
>MLung$populations <- paste( MLung@active.ident )
>UMAPPlot(MLung, label = T) + NoLegend()
>Cellorder = c('AM', 'Macrophages', 'DC', 'PMN', 'AT1', 'AT2', 'Endothelial cells', 'Fibroblasts', 'SMC', 'Pericytes', 'Mesothelial cells' , 'NK cells', 'T cells', 'B cells')
>Nogpalette <- c("#CB769E", "#A85C85", "#4F6D7A", "#0081AF", "#F7C548", "#F97E44", "#0D3B66", "#B2675E", "#644536", "#C4A381", "#832D52", "#246A73", "#368F8B", "#62C370")
>my_levels <- c(Cellorder)
>MLung@active.ident <- factor(x = MLung@active.ident , levels = my_levels)
>UMAPPlot(MLung, label = T, cols = c(Nogpalette)) + NoLegend() + coord_fixed(ratio=1)
>ggsave("…/Umap_Mlung_SCT_H5.pdf", width = 7, height = 7)
#Piechart
>tbl_ct <- table(MLung$populations, MLung$orig.ident)
>sums = colSums(tbl_ct) # sum across columns of the object = colSums(..
>tbl_ct[,1] <- tbl_ct[,1]/sums[1]
>tbl_ct
>
>freq_ct <- data.frame(tbl_ct)
>colnames(freq_ct) <- c("celltype", "ident", "percentage")
>freq_ct$celltype <- factor(freq_ct$celltype, levels = c(Cellorder))
>freq_ct <- freq_ct[order(freq_ct$celltype),]
>ggplot(freq_ct, aes(x="", y=percentage, fill=celltype)) +
> geom_bar(stat="identity", width=1) + scale_fill_manual("legend", values = Nogpalette) +
> coord_polar("y", start=0) + theme_void()
>ggsave("…/Piechart_MLung.pdf", width = 7, height = 5)
Flow cytometry (optional)
After the isolation of single cells, major quality control criteria (cell singularity, viability and diversity) for subsequent scRNA-seq can be evaluated via flow cytometry. If a particular population of cells is of specific interest, we highly recommend carefully practicing the protocol and analyzing the samples via flow cytometry prior to proceeding with single-cell barcoding experiments. For instance, staining for major cell populations of the lung (e.g., CD45+ leukocytes, CD326+ epithelial cells and CD31+ endothelial cells) and for cell viability (via measuring 7AAD- or FVD- cells) can be performed, which allows the frequencies of viable singlets amongst the parent population (or total numbers of cells) to be determined.
Bioanalyzer and Qubit
Before sequencing the final single-cell gene expression libraries, quality control measures should be performed to determine the concentration (Qubit) and cDNA fragment sizes (Bioanalyzer) (Figure 6).
Note: Instead of using a Bioanalyzer, the fragment sizes can also be measured using a fragment analyzer or tape station.
Figure 6.

Quality control of generated gene expression libraries
Example of a final gene expression library with fragment size distribution suitable for next generation sequencing.
KAPA PCR (optional)
It is recommended to perform qPCR on final single-cell gene expression libraries using the KAPA Library Quantification Kit (Roche Sequencing) for specific quantification of cDNA fragments of interest, since Bioanalyzer and Qubit also detect cDNA fragments which cannot be sequenced.
Limitations
Although the demonstrated protocol was established to represent all major lung cell types, we observe that the distribution of isolated cell types might not necessarily represent cellular frequencies of physiological lung tissue. Estimates based on morphological identification and counting of cells in normal lung tissue sections across species suggest that alveolar type 1 epithelial cells represent between 8%–12%, alveolar type 2 epithelial cells 8%–16%, endothelial cells 30%–46% and alveolar macrophages 3%–10% of total lung cells.5 Over- or underrepresentation of cell types of interest depend on the type and amount of enzymes used during digestion and processing of the tissue.
Troubleshooting
Problem 1
Laboratory animals do not exhibit the depth of anesthesia (evaluated by loss of pedal withdrawal reflex) necessary for dissection, despite receiving the correct amount per body weight (step 1).
Potential solution
The anesthetics might take longer to be effective in individual animals. The injection might have been faulty, although injection into the peritoneal cavity minimizes this risk. Consult your laboratory veterinarian if a second dose might need to be applied. Alternatively, perform a cervical dislocation to sacrifice the animal. All procedures performed on animals need prior approval of the institutional and local governmental authorities.
Problem 2
Vascular lung perfusion was unsuccessful, lungs remain pinkish (optional step 8).
Potential solution
Identifying and hitting the right ventricle can be challenging at first (Figure 1). If the lungs do not start turning white upon the initiation of vascular perfusion, remove the needle from the heart and try flushing the right ventricle a second time or try to inject into the pulmonary artery. Before ejecting the perfusion medium out of the syringe, make sure to obstruct the first injection site with tweezers. Lungs turning whitish indicate a successful perfusion.
Problem 3
Low viability of lung single cell suspension (step 27).
Potential solution
In order to prevent cell death, preparation and processing time should be kept as short as possible. Ensure that cell suspensions are not exposed to fluctuating temperatures during and in between centrifugation steps. Ideally, cell suspensions should be kept on ice and centrifuged at cold temperatures during processing unless the protocol requires it otherwise.
Do not place cell pellets on ice, instead resuspend immediately after centrifugation and place cell suspension on ice.
Problem 4
Low number of desired lung cell populations (step 27).
Potential solution
Consider enrichment or depletion of specific cell populations via magnetic or flow cytometry-based cell sorting. If hard to dissociate cells, like structural lung cells are of specific interest, combining or replacing single-cell RNA-sequencing with single-nucleus RNA-sequencing could be beneficial as the nuclei isolation procedures reduce the dissociation bias.
Problem 5
Unusual Bioanalyzer measurements (expected outcomes – bioanalyzer and qubit).
Potential solution
In case of unexpected cDNA fragment size distribution or measurements, try to run the samples again with a freshly prepared gel-dye mix. Make sure the sample is diluted according to the manufacturer’s instructions in order to prevent overloading of the Bioanalyzer chip due to excessive concentrations. On the other hand, if cDNA fragment size distribution curves are too small or hardly detectable, running a pure or less-diluted sample could be attempted.
Resource availability
Lead contact
Further information and requests for resources and reagents should be directed to and will be fulfilled by the lead contact, Geraldine Nouailles (geraldine.nouailles@charite.de).
Materials availability
This study did not generate new unique reagents.
Acknowledgments
The authors thank Ulrike Behrendt, Angela Linke, Michaela Scholz, and Simon Dökel for excellent technical assistance and Julia Kazmiersky, Martina Anzaghe, Patricia Gogesch, Marc Niles, and Samada Muraleedharan for advice and excellent technical assistance under BSL-3 conditions. The authors sincerely thank Dr. Rike Zietlow for excellent manuscript editing. The authors thank Jeannine Wilde, Madlen Sohn, and Tatiana Borodina (MDC Scientific Genomics Platforms) for sequencing. Schemes and graphics were created with Biorender.com. This research was funded by a German Federal Ministry of Education and Research (BMBF) grant to M.W., grant number e:Med CAPSyS (01ZX1304B, 01ZX1604B). G.N. and M.W. were supported by the BMBF in the framework of MAPVAP (01KI2124). J.T. received funding from the Deutsche Forschungsgemeinschaft (DFG, German Research Foundation); project ID 114933180 – SFB-TR84, sub-project Z01b. M.W. received funding from the DFG (project ID 114933180 – SFB-TR84, sub-projects C06 and C09 and project ID 431232613 – SFB-1449, sub-project B02), e:Med SYMPATH (01ZX1906A). P.P. and C.G. are supported by Charité 3R. M.D.M is supported by grants from the German Center for Infection Research (DZIF; TTU 01.805 and TTU 01.922_00) and the German Ministry of Health (CHARIS).
Author contributions
Conceptualization and Methodology, P.P., C.G., G.N.; Software, P.P., E.W.; Validation, Formal analysis, and Investigation, P.P., C.G., J.T., E.W., A.E., C.W., M.D.M., G.N.; Resources, J.T., M.D.M., M.W., G.N., Data curation, P.P., E.W., G.N.; Writing – Original draft, P.P., C.G., G.N.; Writing – Review & editing, P.P., C.G., J.T., E.W., A.E., C.W., M.D.M., M.W., G.N.; Visualization, P.P., C.G., G.N.; Supervision and Project administration, G.N.; Funding acquisition, J.T., M.D.M., M.W., G.N.
Declaration of interests
The authors declare no competing interests.
Contributor Information
Peter Pennitz, Email: peter.pennitz@charite.de.
Cengiz Goekeri, Email: cengiz.goekeri@charite.de.
Geraldine Nouailles, Email: geraldine.nouailles@charite.de.
Data and code availability
The data chosen for exemplary naïve murine lung cell analysis was previously published4 and raw data files deposited under “Health Atlas: https://www.health-atlas.de/data_files/563?graph_view=tree.” Code for shown example data can be found in Code Boxes 1 and 2.
The raw data for exemplary scRNA-seq analysis of infected hamster lung cells was deposited in the under “Gene Expression Omnibus: GSE196938.” As a reference, raw data of bulk RNA-seq analysis of similarly infected hamster lung cells was deposited under “Gene Expression Omnibus: GSE195939.”
References
- 1.Nouailles G., Wyler E., Pennitz P., Postmus D., Vladimirova D., Kazmierski J., Pott F., Dietert K., Muelleder M., Farztdinov V., et al. Temporal omics analysis in Syrian hamsters unravel cellular effector responses to moderate COVID-19. Nat. Commun. 2021;12:4869. doi: 10.1038/s41467-021-25030-7. [DOI] [PMC free article] [PubMed] [Google Scholar]
- 2.Wyler E., Adler J.M., Eschke K., Teixeira Alves G., Peidli S., Pott F., Kazmierski J., Michalick L., Kershaw O., Bushe J., et al. Key benefits of dexamethasone and antibody treatment in COVID-19 hamster models revealed by single-cell transcriptomics. Mol. Ther. 2022;30:1952–1965. doi: 10.1016/j.ymthe.2022.03.014. [DOI] [PMC free article] [PubMed] [Google Scholar]
- 3.Ebenig A., Muraleedharan S., Kazmierski J., Todt D., Auste A., Anzaghe M., Gömer A., Postmus D., Gogesch P., Niles M., et al. Vaccine-associated enhanced respiratory pathology in COVID-19 hamsters after TH2-biased immunization. Cell Rep. 2022;40:111214. doi: 10.1016/j.celrep.2022.111214. [DOI] [PMC free article] [PubMed] [Google Scholar]
- 4.Pennitz P., Kirsten H., Friedrich V.D., Wyler E., Goekeri C., Obermayer B., Heinz G.A., Mashreghi M.F., Büttner M., Trimpert J., et al. A pulmonologist's guide to perform and analyse cross-species single lung cell transcriptomics. Eur. Respir. Rev. 2022;31:220056. doi: 10.1183/16000617.0056-2022. [DOI] [PMC free article] [PubMed] [Google Scholar]
- 5.Crapo J.D., Barry B.E., Gehr P., Bachofen M., Weibel E.R. Cell number and cell characteristics of the normal human lung. Am. Rev. Respir. Dis. 1982;125:740–745. doi: 10.1164/arrd.1982.125.6.740. [DOI] [PubMed] [Google Scholar]
- 6.Sunkara V., Heinz G.A., Heinrich F.F., Durek P., Mobasheri A., Mashreghi M.F., Lang A. Combining segmental bulk- and single-cell RNA-sequencing to define the chondrocyte gene expression signature in the murine knee joint. Osteoarthritis Cartilage. 2021;29:905–914. doi: 10.1016/j.joca.2021.03.007. [DOI] [PubMed] [Google Scholar]
- 7.Attar M., Sharma E., Li S., Bryer C., Cubitt L., Broxholme J., Lockstone H., Kinchen J., Simmons A., Piazza P., et al. A practical solution for preserving single cells for RNA sequencing. Sci. Rep. 2018;8:2151. doi: 10.1038/s41598-018-20372-7. [DOI] [PMC free article] [PubMed] [Google Scholar]
- 8.Wohnhaas C.T., Leparc G.G., Fernandez-Albert F., Kind D., Gantner F., Viollet C., Hildebrandt T., Baum P. DMSO cryopreservation is the method of choice to preserve cells for droplet-based single-cell RNA sequencing. Sci. Rep. 2019;9:10699. doi: 10.1038/s41598-019-46932-z. [DOI] [PMC free article] [PubMed] [Google Scholar]
- 9.Nakano H., Nakano K., Cook D.N. Isolation and purification of epithelial and endothelial cells from mouse lung. Methods Mol. Biol. 2018;1799:59–69. doi: 10.1007/978-1-4939-7896-0_6. [DOI] [PMC free article] [PubMed] [Google Scholar]
- 10.Angelidis I., Simon L.M., Fernandez I.E., Strunz M., Mayr C.H., Greiffo F.R., Tsitsiridis G., Ansari M., Graf E., Strom T.M., et al. An atlas of the aging lung mapped by single cell transcriptomics and deep tissue proteomics. Nat. Commun. 2019;10:963. doi: 10.1038/s41467-019-08831-9. [DOI] [PMC free article] [PubMed] [Google Scholar]
- 11.Denisenko E., Guo B.B., Jones M., Hou R., de Kock L., Lassmann T., Poppe D., Clément O., Simmons R.K., Lister R., Forrest A.R.R. Systematic assessment of tissue dissociation and storage biases in single-cell and single-nucleus RNA-seq workflows. Genome Biol. 2020;21:130. doi: 10.1186/s13059-020-02048-6. [DOI] [PMC free article] [PubMed] [Google Scholar]
- 12.Adam M., Potter A.S., Potter S.S. Psychrophilic proteases dramatically reduce single-cell RNA-seq artifacts: a molecular atlas of kidney development. Development. 2017;144:3625–3632. doi: 10.1242/dev.151142. [DOI] [PMC free article] [PubMed] [Google Scholar]
- 13.Hafemeister C., Satija R. Normalization and variance stabilization of single-cell RNA-seq data using regularized negative binomial regression. Genome Biol. 2019;20:296. doi: 10.1186/s13059-019-1874-1. [DOI] [PMC free article] [PubMed] [Google Scholar]
- 14.Hao Y., Hao S., Andersen-Nissen E., Mauck W.M., 3rd, Zheng S., Butler A., Lee M.J., Wilk A.J., Darby C., Zager M., et al. Integrated analysis of multimodal single-cell data. Cell. 2021;184:3573–3587.e29. doi: 10.1016/j.cell.2021.04.048. [DOI] [PMC free article] [PubMed] [Google Scholar]
- 15.Hafemeister C., Satija R. Using sctransform in Seurat. https://satijalab.org/seurat/articles/sctransform_vignette.html
- 16.HarvardChanBioinformatics. Introduction to single-cell RNA-seq. https://hbctraining.github.io/scRNA-seq/lessons/elbow_plot_metric.html.
Associated Data
This section collects any data citations, data availability statements, or supplementary materials included in this article.
Data Availability Statement
The data chosen for exemplary naïve murine lung cell analysis was previously published4 and raw data files deposited under “Health Atlas: https://www.health-atlas.de/data_files/563?graph_view=tree.” Code for shown example data can be found in Code Boxes 1 and 2.
The raw data for exemplary scRNA-seq analysis of infected hamster lung cells was deposited in the under “Gene Expression Omnibus: GSE196938.” As a reference, raw data of bulk RNA-seq analysis of similarly infected hamster lung cells was deposited under “Gene Expression Omnibus: GSE195939.”