

ABSTRACT
Serine incorporator 5 (Ser5), a transmembrane protein, has recently been identified as a host antiviral factor against human immunodeficiency virus (HIV)-1 and gammaretroviruses like murine leukemia viruses (MLVs). It is counteracted by HIV-1 Nef and MLV glycogag. We have investigated whether it has antiviral activity against influenza A virus (IAV), as well as retroviruses. Here, we demonstrated that Ser5 inhibited HIV-1-based pseudovirions bearing IAV hemagglutinin (HA); as expected, the Ser5 effect on this glycoprotein was antagonized by HIV-1 Nef protein. We found that Ser5 inhibited the virus-cell and cell-cell fusion of IAV, apparently by interacting with HA proteins. Most importantly, overexpressed and endogenous Ser5 inhibited infection by authentic IAV. Single-molecular fluorescent resonance energy transfer (smFRET) analysis further revealed that Ser5 both destabilized the pre-fusion conformation of IAV HA and inhibited the coiled-coil formation during membrane fusion. Ser5 is expressed in cultured small airway epithelial cells, as well as in immortal human cell lines. In summary, Ser5 is a host antiviral factor against IAV which acts by blocking HA-induced membrane fusion.
KEYWORDS: hemagglutinin, SERINC5, virus entry, restriction, influenza A virus
INTRODUCTION
The serine incorporator (SERINC) family is composed of five transmembrane proteins with high conservation across eukaryotes (1). It was initially described as facilitating the incorporation of serine into membrane lipids in phospholipid synthesis (2). Recently, 2 of them, SERINC3 (Ser3) and SERINC5 (Ser5), have been identified as host antiviral factors of HIV-1 infection; as Ser5 has higher antiviral activity than Ser3 (3, 4), investigations of antiviral effects and mechanisms have concentrated on Ser5. Three different retroviruses (HIV-1, murine leukemia virus [MLV], and equine infectious anemia virus [EIAV]) encode distinct proteins which counteract the antiviral effects of Ser5, suggesting that Ser5 has exerted strong selective pressure during viral evolution. These proteins, i.e., Nef (3, 4), glycogag (gGag) (3–5), and S2 (5, 6), respectively, induce the redirection of Ser5 from the plasma membrane to lysosomes for degradation (3, 4, 7).
The mechanism of antiviral action of Ser5 is not well understood. When Ser5 is present in the virus-producing cell, it reduces the ability of sensitive viruses to induce membrane fusion and enter new target cells (3–5, 8, 9). However, the antiviral activity of Ser5 against different HIV-1 isolates varies: for example, Ser5 strongly reduces the infectivity of HIV-1 clone NL4-3 but only modestly affects tier 2 and 3 HIV-1 isolates (3, 4, 10, 11), showing that the Ser5 effect on HIV-1 is Env-specific. Furthermore, recent studies demonstrate the physical interaction between HIV-1 Env and the Ser5 isoform 1 (12). This interaction, which probably involves residues in the third and fifth extracellular loops of Ser5 and the membrane-proximal extracellular region of HIV-1 Env (13), enhances the accessibility of the gp41 transmembrane (TM) domains to neutralizing antibodies (8) and sensitizes viral fusion to neutralizing antibodies and antivirals (8, 10, 14). Besides altering HIV-1 Env conformation, Ser5 has also been found to alter both the distribution of Env in the viral membrane (15) and the number of functional fusion complexes (16, 17). Studies with MLV-based pseudovirions also showed that the antiviral effect of Ser5 differs drastically between different retroviral envelope glycoproteins (5).
While the inhibitory activity of Ser5 upon HIV-1 is well-documented (3, 4), and while it has been shown to inhibit other retroviruses as well (5), it is not known whether it is active against viruses in other families. Recently, an extensive study by Diehl et al. (18) has shown that Ser5 can inhibit the infectivity of pseudovirions with HIV-1, MLV, or Mason-Pfizer Monkey Virus cores and envelope glycoproteins from a wide variety of enveloped RNA viruses including influenza A virus (IAV). The envelope glycoprotein of this virus, hemagglutinin (HA), is a class 1 fusion protein (19) like that of HIV-1, although in the case of IAV, membrane fusion is triggered by the low pH in the endosome following internalization of the virus (20). In this study, we have further determined its effects against influenza A virus (IAV) with highly pathogenic avian HAs that potentially infect humans (21). We have also characterized the interaction of Ser5 with HA, and report that Ser5 is active not only against IAV pseudovirions with highly pathogenic group 1 and group 2 HAs (22), but also against authentic IAV; we have also investigated the effects of Ser5 upon the molecular dynamics of HA in some detail.
RESULTS
Ser5 inhibits virions with IAV glycoproteins.
It was previously found that Ser3 and Ser5 inhibit HIV-1 infection, while Ser2 does not; Ser5 has the strongest inhibitory effect (3, 4). To determine the effect of these proteins on infections using IAV HA, we prepared corresponding reporter HIV-based pseudovirions from 293T/17 (293T) cells in the presence of Ser5, Ser3, and Ser2. Their infectivity was then assessed by measuring luciferase activity in infected cells; normalization of this activity by their level of p24, as determined in Western blots (Fig. S1) yielded their specific infectivity. Details of these assays are in Materials and Methods (Text S1).
Supplementary Methods. Download TEXT S1, PDF file, 0.1 MB (81.2KB, pdf) .
This is a work of the U.S. Government and is not subject to copyright protection in the United States. Foreign copyrights may apply.
Quantification of relative p24 amount in virus supernatant by Western blotting. (A) Representative Western blot analysis of p24 in the virus supernatant samples from Fig. 1C and the p24 standard. The p24 standard was prepared by transfecting 293T cells with the 5 μg of pNL4-3.Luc.R-E- plasmid and IAV glycoproteins, harvested and finally serially diluted for Western blot. The intensity of p24 in the supernatant was analyzed with Image Studio software (LI-COR) to construct the standard curve (B). The p24 standard curve is the mean of 3 independent measurements ± SEM. Download FIG S1, PDF file, 0.1 MB (121KB, pdf) .
This is a work of the U.S. Government and is not subject to copyright protection in the United States. Foreign copyrights may apply.
The results of these assays are shown in Fig. 1A. As expected, Ser5 strongly inhibited the infectivity of HIV-1 (NL4-3) pseudovirions, while Ser3 had a more modest effect and Ser2 did not detectably alter their specific infectivity. In agreement with previous reports (3, 4), there were no detectable effects on pseudovirions carrying vesicular stomatitis virus glycoprotein (VSV-G); this shows that the inhibition of infectivity by Ser5 and Ser3 is not a result of general toxicity. These experiments showed that Ser3 and Ser5 also inhibited the infectivity of the IAV pseudovirion, but Ser5 was more potent. Ser2 had no detectable effect on this virus. As Ser5 was consistently the most potent of the Ser family members, we have focused on it in the remainder of the work presented below.
FIG 1.

Ser5 reduces the infectivity of pseudovirions with IAV HA proteins. (A) Determination of the antiviral effect of Ser2, Ser3 and Ser5 on pseudovirions with IAV H5HA, HIV-1 (NL4-3) Env, and VSV-G glycoproteins. Viruses were prepared in cells transfected with 1 μg of Ser2, Ser3 or Ser5 plasmid, and then MDCK or TZM-bl cells were infected with the viral supernatant. After 72 h pi, luciferase activity was measured and finally the specific infectivity was determined. The results are presented as the mean of 3 independent experiments ± SEM and analyzed by two-way ANOVA (**, P < 0.01; ****, P < 0.001; ns: no significance). (B) Western blot analysis of the virus pellet and cell lysate of IAV H5HA and HIV-1 (NL4-3) Env from (A). Arrows indicate the corresponding proteins. (C) Ser5 inhibited IAV group 1 and 2 HA proteins in a dose-dependent manner. Pseudovirions with the indicated glycoproteins were prepared in the presence of different amounts of Ser5 plasmid. The results are presented as the mean of 3 independent experiments ± SEM and analyzed by two-way ANOVA (*, P < 0.05; ****, P < 0.001; ns: no significance).
It was of interest to determine whether Ser5 is incorporated into IAV pseudovirions, particularly since their sensitivity to Ser5 is evidently less than that of HIV-1 pseudovirions. Western analysis (Fig. 1B) showed that the IAV and HIV-1 pseudovirions contained rather similar levels of Ser5, which migrates with an apparent molecular weight near 40 kDa on SDS-PAGE (8). Some degraded signal was found around 30 kDa (Fig. 1B). The Ser5 signal appears to represent actual incorporation into the pseudovirions, since it was absent in samples lacking the HIV core plasmid pNL4-3.LucR-E- (Fig. 1B).
The envelope glycoproteins of IAV, hemagglutinin (HA) proteins, are classified into 2 major groups based on structural and antigenic differences (22). The results in Fig. 1A were obtained with HA from avian influenza A/turkey/Turkey/1/2005 (H5N1), which is in group 1 and contains the furin cleavage site between the HA1 and HA2 domains. We also tested HA from avian influenza A/Hangzhou/1/2013 (H7N9), which does not contain the furin site (23), as a representative of group 2 HA proteins. The presence of furin site in HA determines the viral pathogenesis, and the time and the place at which the HA precursor protein (HA0) is processed (24). To further validate and characterize the antiviral activity of Ser5 on IAV, we prepared pseudovirions with IAV H5 and H7 HA proteins in the presence of different doses of Ser5 plasmid (Fig. 1C). The data showed that Ser5 inhibited pseudovirions with both HA proteins in a dose-dependent manner, implying that Ser5 is effective against both groups of HA proteins and its antiviral activity is independent of the status and pathogenesis of HA proteins. In contrast, it did not affect those with VSV-G as expected (Fig. 1C).
The antiviral activity of Ser5 is antagonized by the Nef protein.
In previous studies on HIV-1, it was found that Nef protein antagonizes the antiviral effect of Ser5 by reducing the surface location of Ser5 (3, 4). To further compare the effects of Ser5 on the IAV pseudovirions with those on HIV-1, we tested the ability of Nef to counteract these effects. As a previous study suggested that Nef from HIV-1 strain 97ZA012 has the strongest antagonism against Ser5 (3), we used it in these experiments. We found that Nef partially reversed the inhibition by Ser5 of the pseudovirions with the IAV HA and HIV-1 (NL4-3) Env protein in a dose-dependent manner (Fig. 2).
FIG 2.
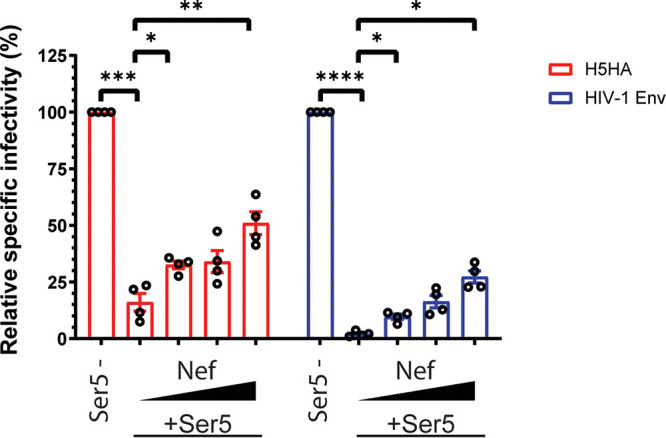
Nef antagonizes Ser5 effect on the pseudovirions with IAV HA. The antiviral activity of Ser5 to indicated glycoproteins is antagonized with Nef97ZA012 protein. Pseudovirions with different glycoproteins were prepared in the presence of a fixed amount of Ser5 (1 μg for IAV; 0.5 μg for HIV-1 [NL4-3]) and varied Nef amounts (0, 0.25, 0.5 and 1 μg), and finally the relative specific infectivity was determined by comparison with the specific infectivity of virions without Ser5 and Nef proteins. The results are presented as the mean of 4 independent experiments ± SEM and analyzed by two-way ANOVA (*, P < 0.05; **, P < 0.01; ***, P < 0.005; ****, P < 0.001).
The increase in pseudovirion infectivity induced by Nef (Fig. 2) could theoretically be a direct effect of Nef, rather than a reversal of the effect of Ser5. To test this possibility, we measured the effects of Nef upon the specific infectivities of IAV pseudovirions. As shown in Fig. S2, we found no significant effect of Nef in the absence of Ser5 co-expression.
Nef protein alone does not affect infectivity of pseudovirions with IAV HA. Pseudovirions with indicated glycoproteins were prepared in the presence of varied Nef97ZA012 plasmid amounts, and finally the specific infectivity was determined. The results are presented as the mean of 3 independent experiments ± SEM and analyzed by two-way ANOVA (ns: no significance). Representative Western blot analysis of the virus pellet and cell lysate of indicated preparations is shown. Download FIG S2, PDF file, 0.2 MB (170.6KB, pdf) .
This is a work of the U.S. Government and is not subject to copyright protection in the United States. Foreign copyrights may apply.
Plasma membrane-associated Ser5 inhibits IAV by interacting with HA proteins.
A previous study (13) has suggested that the antiviral activity of Ser5 depends on its localization to plasma membrane. To evaluate this on IAV HA, we tested the effect of the Ser5 K130A mutant, which is not trafficked to the plasma membrane (13, 25), on the infectivity of the IAV pseudovirions. As shown in Fig. 3A, the mutant has apparently lost all antiviral activity against the IAV pseudovirions, and is not detectable in viral pellets by Western blotting analysis. We also examined the relative localization of Ser5 and IAV HA in virus-producing cells by confocal microscopy. For this purpose, we added the HA epitope tag between residues 290 and 291 of Ser5. As shown in Fig. 3B, the wild-type Ser5 is found on the plasma membrane, as expected (13); in contrast, the K130A mutant is largely intracellular. These findings are consistent with the hypothesis that plasma membrane localization is important to the antiviral effects of Ser5.
FIG 3.

The antiviral activity of Ser5 is associated with its plasma membrane-bound property and interaction with HA. (A) The antiviral activity of Ser5 and its incorporation into virus particles are associated with plasma membrane localization. Pseudovirions with IAV H5 HA protein were prepared in cells transfected with the wild-type Ser5 or Ser5K130A (1 μg), and finally the specific infectivity was determined. The results are presented as the mean of four independent experiments ± SEM and analyzed by one-way ANOVA (***, P < 0.005; ns: not significant). Western blot analysis of the virus pellet and cell lysate of indicated preparations. The analysis was performed thrice and one representative example is shown. Arrows indicate the corresponding proteins. (B) Representative confocal images of the localization of the wild-type Ser5 and Ser5K130A in cells producing IAV pseudovirions. The HA epitope tag was inserted between residues 290 and 291 of Ser5. Immunofluorescence staining of HA (green) indicates that it is mainly found on the plasma membrane. In addition, the staining of Ser5 (red) reveals that the wild-type Ser5 is mainly found on the plasma membrane whereas the mutant Ser5K130A is only found intracellularly. The merged images further show that HA is colocalized with the wild-type Ser5 (white arrows). Scale bar is 2 μm. The Pearson colocalization coefficient between HA and Ser5 signal of each treatment was determined accordingly (n = 5 cells). The results are presented as the mean of experiments ± SEM and analyzed by Student's t test (****, P < 0.001). (C) Co-immunoprecipitation assay of FLAG-tagged Ser5 (Ser5-FLAG) or Ser5K130A (Ser5K130A-FLAG), and HA. 293T cells were co-transfected with Ser5-FLAG, Ser5K130A-FLAG or a filler plasmid, and plasmid encoding IAV H5 HA with or without plasmid pNL4-3.LucR-E-. Co-immunoprecipitation tests were performed on extracts of the transfected cells. Representative immunoblots are shown. Arrows indicate the corresponding proteins. The fourth panel shows both HA2 and p24 bands because the same membrane was sequentially probed with both anti-HA and anti-p24 antisera. The ratio of HA2 protein to Ser5 signal in IP fractions was determined accordingly (n = 9 samples). The results are presented as the mean of experiments ± SEM and analyzed by Student's t test (****, P < 0.001).
The confocal micrographs (Fig. 3B) also revealed a significant degree of co-localization between Ser5 and the IAV HA. This association suggested that Ser5 interacts with HA at plasma membranes. We tested the hypothesis that Ser5 is physically associated with the IAV HA by a co-immunoprecipitation assay. The Ser5 was C-terminally tagged with FLAG, cells were lysed with a buffer containing 1% NP-40, and lysates were precipitated with anti-FLAG antibody. We found (Fig. 3C) that the wild-type Ser5 was significantly co-precipitated with the HA2 domain of IAV HA, but the HA2 protein was not detectable in immunoprecipitates of Ser5 K130A. This is in striking correlation with the biological results (Fig. 3A), and suggests that plasma membrane localization of Ser5 is required for the interaction with HA as well as for its antiviral activity. Since the glycoproteins and Ser5 are membrane proteins, we also tested these precipitates for the presence of the membrane protein transferrin. The absence of detectable levels of transferrin in the IP fractions (Fig. 3C) suggests that plasma membrane association is not sufficient for co-IP with the FLAG-tagged Ser5. Moreover, the apparent interaction between Ser5 and HA is independent of the HIV core, as it was also seen in samples that were not transfected with the core plasmid (Fig. 3C). The results suggest that its antiviral activity is directly associated with its interaction with glycoproteins.
Ser5 inhibits the HA-induced fusion process.
Recent studies have found that Ser5 inhibits membrane fusion induced by HIV-1 and MLV Env proteins (5, 8, 9). As our data indicate that it interacts with IAV HA (Fig. 3C), it was of interest to determine whether it had similar effects on fusion by IAV HA protein. We tested the effect on virus-cell fusion using the β-lactamase-Vpr (BlaM-Vpr) fusion assay (26, 27). In this assay, BlaM-Vpr protein is incorporated into HIV-based pseudovirions. When these pseudovirion particles enter the cell, BlaM-Vpr is released into cytosol and cleaves the auto-quenched substrate (CCF2-AM), producing the fluorescence signal. As shown in Fig. 4A, we found that Ser5 significantly inhibited the virus-cell fusion induced by the IAV or HIV-1 pseudovirions, but the inhibitory effect of Ser5 on the fusion process of IAV was less potent than on that of HIV-1.
FIG 4.

Ser5 inhibits the membrane fusion induced by IAV HA. (A) Cells were infected with pseudovirions containing BlaM-Vpr and the indicated glycoproteins for 3 to 4 h with or without Ser5 (Ser5 to glycoprotein plasmid ratio, 2:1), and then loaded with CCF2. After incubation with the indicated pseudovirions, the cells were fixed and analyzed for the cleavage of CCF2 by measuring fluorescence emission at 520 nm (uncleaved CCF2) and 447 nm (cleaved CCF2) using flow cytometry. These results are the representative of 3 independent experiments. The graph in the right panel depicts the relative percentage of virus-cell fusion. The results are presented as the mean of three independent experiments ± SEM and analyzed by two-way ANOVA (****, P < 0.001). (B) 293T cells serving as “producer” cells were transfected with indicated glycoproteins; a filler plasmid or Ser5 (2 μg); and DSP1-7. Corresponding target cells as mentioned in the Methods session were transfected with DSP8-11. About 24 h posttransfection, target cells were detached by trypsin, and were transferred to a 96-well plate in sextuplicate. At 48 h posttransfection, target cells of HIV-1 (NL4-3) were incubated with 30 μM Enduren (Promega) for 1 h, and then the producer cells were added to the target cells in an equal volume, resulting in a 15 μM final concentration of Enduren. Luciferase activity was measured 2 h after the addition of producer target cells. For the cell-cell fusion induced by IAV HA, producer cells with or without Ser5 were added to the target cells at 48 h posttransfection. After 16 h additional incubation, cells were incubated in acidic DMEM (pH 5) at 37°C for 10 min and then neutralized with complete culture medium. After that, medium was replenished with complete culture medium in the presence of 15 μM Enduren. Luciferase-induced luminescence was measured 2 h after the acidic treatment. These results are the representative of 4 independent experiments. The graph in the right panel depicts the relative percentage of cell-cell fusion. The results are presented as the mean of 4 independent experiments ± SEM and analyzed by two-way ANOVA (****, P < 0.001).
We also measured the effect of Ser5 on cell-cell fusion using the dual split protein (DSP)-based fusion assay (28). In this assay, “producer” cells were transfected with plasmids encoding the fusogenic glycoproteins, Ser5, and the N-terminal DSP fragment, while the target cells were transfected with plasmids for the C-terminal DSP fragment and the receptor protein where appropriate. The 2 cultures were then combined in the presence of the cell-permeable luciferase substrate EnduRen. In this assay, cell-cell fusion generates a luciferase signal (28). In the absence of glycoproteins, no luciferase signal was detected due to the absence of cell-cell fusion (Fig. 4B). The results (Fig. 4B) also showed that Ser5 modestly reduced cell-cell fusion induced by IAV HA, as well as by HIV-1 (NL 4-3) Env. The reduction was about 2-fold, in agreement with previously published results on HIV-1 (8), and significantly smaller than its inhibitory effect on virus-cell fusion.
Ser5 in IAV-producing cells reduces IAV infectivity.
The data presented above, demonstrating inhibitory effects of Ser5 on the functions of HA, were all performed with HIV-1-based pseudovirions or glycoprotein expression plasmids. We also tested the ability of Ser5 to inhibit the replication of intact IAV. We utilized the piggyBac system (29) to introduce a doxycycline-inducible Ser5 gene into MDCK cells (MDCK-Ser5), which are permissive for IAV replication and do not express Ser5 detectable by our antiserum against human Ser5 (Fig. 5A); we also propagated a parallel MDCK culture (MDCK-Ctrl) containing an empty piggyBac vector. These 2 stable cell lines were treated with doxycycline for 16 h, and then infected with IAV H1N1/PR8 at low multiplicity of infection (MOI). These cultures were incubated for 72 h to allow IAV replication in the presence or absence of Ser5. Virus collected after 72 h was found to contain similar amounts of HA and NA in all virus pellet samples with or without Ser5, although HA and NA bands in the lysate of doxycycline-induced MDCK-Ser5 were slightly more intense than in the other 3 samples, as shown by Western blotting analysis (Fig. 5A). The viral pellets also contained Ser5 (Fig. 5A). They were first concentrated by ultracentrifugation and their virus genomic RNA quantified by qPCR. The infectivity of these virus preparations was then determined with plaque assay and flow cytometry. For the plaque assay, the virus titer of the concentrated virus produced from different conditions was determined, in which MDCK cells were infected with serially diluted virus starting from the same RNA equivalents (as determined from the qPCR measurements). The plaques were counted to determine the PFU per mL from each preparation, and finally the relative virus titer was determined. Figure 5B indicates that the virus titer of IAV from both MDCK-Ctrl and -Ser5 cells without doxycycline treatment was comparable. In contrast, the virus titer of IAV propagated with Ser5 was about 4-fold lower than those produced from MDCK-Ctrl cells with or without doxycycline treatment and from MDCK-Ser5 cells without doxycycline treatment (Fig. 5B). For the determination with flow cytometry, virus with the same RNA equivalents were inoculated onto MDCK cells; after 12 h, we measured the extent of infection by flow cytometry. As shown in Fig. 5C and summarized in Fig. 5D, comparable results were found. All these results implied that Ser5 inhibits IAV infection. Notably, this effect was similar in magnitude to the inhibition we previously observed with pseudovirions (Fig. 1A).
FIG 5.

Ser5 inhibits IAV (PR8/H1N1) infection. (A) Representative Western blot analysis of the virus pellets produced from indicated cells and the lysates of virus-producing cells in the presence or absence of doxycycline. MDCK-Ctrl and MDCK-Ser5 cells were pretreated with doxycycline for 16 h, and then infected with IAV (PR8/H1N1) at an MOI of 0.01 for 72 h. The virus supernatant was ultracentrifuged, and cell lysate was harvested at 72 h pi. (B) The virus titer of the concentrated virus from the indicated cells was determined by the plaque assay, in which the same vRNA copy of the virus supernatant was serially diluted in a 10-fold manner. The virus titer (PFU/mL) from each preparation was determined accordingly. Finally, the relative virus titer to the one produced from MDCK-Ctrl cells without doxycycline treatment was calculated. The results are presented as the mean of 4 independent experiments ± SEM and analyzed by two-way ANOVA (**, P < 0.01; ns: no significance). (C) The infectivity test of IAV produced from one of the independent experiments as in (A). Equal vRNA copy amounts of IAV with or without Ser5 infected MDCK cells. The percentage infection by the concentrated IAV with or without Ser5 was finally analyzed by flow cytometry at 12 h pi. Representative plots are shown. (D) Graph depicts normalized infection percentage measurements from four independent experiments as in (C). The results are presented as the mean of 4 independent experiments ± SEM and analyzed by two-way ANOVA (***, P < 0.005; ns: no significance).
We also tested the possibility that the presence of Ser5 in target cells inhibits IAV infection. MDCK-Ctrl and MDCK-Ser5 cells were treated with doxycycline for 16 h and then challenged with IAV at MOI equal to 0.01. As shown in Fig. S3, the level of infection was virtually the same in the 2 cell lines and with or without doxycycline treatment. Taken together, the data show that expression of Ser5 during replication of IAV reduces the specific infectivity of the virus, but its presence in target cells has no detectable effect on their infectibility.
Ser5 in target cells does not inhibit IAV (PR8/H1N1) infection. (A) The infectivity test of IAV in Ser5-expressing cells. MDCK-Ctrl and MDCK-Ser5 cells were pretreated with doxycycline for 16 h, and then infected with IAV (PR8/H1N1) at a MOI of 1.0 for 16 h. The percent infection of IAV in MDCK cells with or without Ser5 was finally analyzed by flow cytometry. Representative example plots are shown. (B) Graph depicts normalized infection percentage measurements from 4 independent experiments as in (A). The results are presented as the mean of four independent experiments ± SEM and analyzed by two-way ANOVA (ns: no significance). Download FIG S3, PDF file, 0.1 MB (98.8KB, pdf) .
This is a work of the U.S. Government and is not subject to copyright protection in the United States. Foreign copyrights may apply.
Endogenous Ser5 inhibits IAV infection.
In addition to measuring the effect of Ser5 under overexpression conditions, we also examined the effect of endogenous Ser5 on IAV infection. IAV infects cells not only in the respiratory tract but also in the gastrointestinal system (30). In this study, we determined the endogenous Ser5 expression with RT-qPCR in human lung (A549) and intestine (CaCo2) cells which are permissive to IAV (31). The dog cell line MDCK served as a negative control in these assays for human Ser5 RNA. Ser5 RNA was readily detectable in both cells (Fig. 6A), demonstrating that Ser5 RNA is evidently constitutively expressed. The Ser5 expression in the CaCo2 cells was also higher than that in the A549 cells (Fig. 6A).
FIG 6.

Endogenously expressed Ser5 effect interferes with IAV infectivity. (A) Total RNA of IAV-susceptible and primary cells was extracted, and the copy numbers of mRNA of Ser5 and GAPDH were quantified by qPCR in comparison with their corresponding standard curves. The results are presented as the mean of 3 independent experiments ± SEM (***, P < 0.005; ****, P < 0.001; ND: not detectable). (B) Endogenous Ser5 in human cells possesses antiviral activity against IAV. The Ser5 knockdown (Ser5KD) and control (Ctrl) CaCo2 and A549 cells were infected with influenza A/PR/8/34 (H1N1) virus at MOI of 0.1 and 1 respectively. Infected cells were harvested at 8, 24, and 32 h pi. The vRNA and cellular RNA was extracted from infected cells, and then the vRNA and GAPDH mRNA were quantified by qPCR. Finally, the virus infectivity in infected cells was determined by normalizing IAV vRNA of M gene with cellular GAPDH level. The results are presented as the mean of 3 independent experiments ± SEM and analyzed by one-way ANOVA (*, P < 0.05; **, P < 0.01).
To test the effect of endogenous Ser5 expression on IAV infection, we disrupted Ser5 expression with the shRNA knockdown (KD) technique. Control cells (Ctrl CaCo2 and Ctrl A549) were also prepared. RT-qPCR analysis further revealed that CaCo2 and A549 Ser5KD cells have approximately 4-fold lower Ser5 expression than the Ctrl cells (Fig. 6A). We then infected these CaCo2 and A549 cells with influenza A/PR/8/34 (H1N1) virus at MOI of 0.1 and 1, respectively. Infected cells were harvested at 8, 24, and 32 h postinfection (pi). The vRNA and cellular GAPDH RNA was extracted from infected cells and quantified with RT-qPCR. Finally, the virus infectivity in infected cells was determined by normalizing the vRNA of M gene with the cellular GAPDH level. At the initial (8 h) time point, both Ctrl and Ser5KD cells contained similar levels of vRNA. However, in all subsequent samples in both CaCo2 and A549 cells, IAV grew faster in the Ser5KD than in the control cells (Fig. 6B).
These results suggest the possibility that endogenous Ser5 in human lung and intestine cells contributes to natural defense against IAV. To further investigate this possibility, we measured the level of expression of Ser5 in primary human airway epithelial cells (HSAEC). As shown in Fig. 6A, Ser5 RNA was found in human small airway epithelial cells (HSAEC) at a comparable level to that in Ctrl A549 cells. This further implies that endogenous Ser5 acts as an intrinsic antiviral factor to IAV infection and raises the possibility that the endogenous Ser5 in human cells inhibits IAV infection in vivo.
Ser5 inhibits HA-induced fusion process by blocking the six-helix bundle formation.
During infection by IAV, HA induces fusion between the viral and endosomal membranes, enabling the release of the virion contents into the cytoplasm of the new host cell. This fusion is triggered by the low pH of the endosome and entails a drastic conformational change in HA (32). We have previously used single-molecule fluorescent resonance energy transfer (smFRET) to analyze this change (33), and found that, in the context of an HIV-derived pseudovirus, HA spontaneously samples conformations related to the fusion-active structure, even at neutral pH. Our studies also showed that acidic pH stabilizes an intermediate conformation. After a brief exposure to low pH, HA can return to its pre-fusion conformation. As an approach to understanding the mechanism of Ser5 antiviral activity, we have now tested the effects of Ser5 upon these dynamic properties of HA.
Using the smFRET imaging approach previously established, we measured FRET efficiency between fluorophores attached to non-canonical amino acids at residues 17 and 127 of HA2 (Fig. 7A and B) (33). This assay reports principally on the movement of the fusion peptide with respect to the base of the HA stalk. In contrast to our previous report, here we included NA in the pseudovirions to better reflect the particles used in the infectivity assays described above. Surprisingly, the inclusion of NA increased HA dynamics overall (Fig. S4). The steady-state FRET distribution seen for a population of HA molecules (in the presence of NA) over a range of pH values is shown in Fig. S5A. The high-FRET state (0.93 ± 0.07), which reflects the pre-fusion conformation, predominates at neutral pH in the absence of Ser5. Intermediate- (0.79 ± 0.08 and 0.58 ± 0.08) and low-FRET (0.26 ± 0.08) states were also readily identified. (An additional intermediate-FRET state was identified compared to our previous results owing to improvements made in the sensitivity of the microscope). Analysis of the individual smFRET trajectories with hidden Markov modeling (HMM) enabled determination of the fraction of time (occupancy) each HA molecule spent in each FRET state (Fig. S5A). Consistent with previous results, reduction in pH destabilized the high-FRET pre-fusion conformation, decreasing its average occupancy across the population of molecules, and stabilized the low-FRET conformation, increasing its average occupancy (Fig. 7C). In the presence of Ser5, the occupancy in the high-FRET conformation across the pH range was reduced and the occupancy in the low-FRET state was increased (Fig. 7C). These data suggest that Ser5 destabilizes the pre-fusion conformation of HA and promotes its transition to alternative conformations.
FIG 7.

Ser5 affects HA dynamics as determined by smFRET. IAV pseudovirions with or without Ser5 were prepared and labeled with fluorophores as described in Materials and Methods. (A) Experimental setup of viral particles immobilized on a quartz substrate for imaging with TIRF microscopy. (B) As previously described, fluorophores were attached to the HA2 domain. The indicated inter-fluorophore distances in the pre- and post-fusion HA conformations were estimated through molecular dynamic simulation (33). (C) Ser5 destabilizes the pre-fusion conformation of HA as indicated by the reduction in high-FRET occupancy, and the increase in low-FRET occupancy across the range of pHs tested. High- and low-FRET state occupancies were determined through HMM analysis. (D) Ser5 impedes the transition to the coiled-coil conformation of HA. Fluorescently labeled pseudovirions with or without Ser5 were incubated at pH 4.8 for the indicated times to trigger HA conformational changes. The particles were then returned to neutral pH and evaluated by smFRET. The presence of Ser5 increased the return to the high-FRET pre-fusion conformation after 10- and 20-minute incubations at acidic pH. In (C) and (D), bars indicate the average occupancy over the population of traces, with error bars representing the SEM. The corresponding FRET histograms are shown in Fig. S5. Statistical significance of differences in FRET state occupancies was evaluated using a t test (*, P < 0.01; **, P < 0.001; ***, P < 0.0001; ns: no significance).
The presence of NA increases the dynamics of HA on viral particles. (A) FRET histograms were acquired using the experimental setup depicted in Fig. 7A and described in Materials and Methods. Data were acquired at neutral pH in the presence and absence of NA, as indicated. FRET histograms are presented overlaid with Gaussian distributions (grey) that represent the 4 non-zero FRET states identified through HMM analysis. The red line indicates the sum of the 4 Gaussians (red). Histogram bins reflect the average of three populations of traces, with error bars representing the SEM. The total number of smFRET traces (N) used to form each histogram is indicated. (B) High- and low-FRET state occupancies were determined through HMM analysis. Bars indicate the average over the population of traces, with error bars representing the SEM. Statistical significance was evaluated using a t test (****, P < 0.00001). Download FIG S4, PDF file, 0.1 MB (90KB, pdf) .
This is a work of the U.S. Government and is not subject to copyright protection in the United States. Foreign copyrights may apply.
FRET histograms indicate occupancies in observed states. (A) FRET histograms acquired at the indicated pH, and in the absence and presence of Ser5, using the experimental setup depicted in Fig. 7A. (B) FRET histograms acquired after transient exposure to pH 4.8 for the indicated amount of time before return to neutral pH. All FRET histograms are displayed as in Fig. S4. Download FIG S5, PDF file, 0.2 MB (174.8KB, pdf) .
This is a work of the U.S. Government and is not subject to copyright protection in the United States. Foreign copyrights may apply.
We previously reported that acidic pH stabilizes a reversible low-FRET conformation of HA. That is, after transient exposure to acidic pH, HA can return to the high-FRET pre-fusion conformation (33). In contrast, prolonged exposure to acidic pH induced irreversible transition to the post-fusion coiled-coil conformation, which was also observed as a low-FRET state. These low-FRET states were not distinguishable by their FRET values but differed in their stabilities after exposure to acidic pH. To further explore the effect of Ser5 upon HA dynamics, we therefore tested the reversibility of the low-FRET state induced at pH 4.8. As shown in Fig. 7D, in the absence of Ser5, exposure to pH 4.8 for 10, 20, or 30 min left HA predominantly in the irreversible low-FRET state, consistent with the post-fusion coiled-coil conformation. However, the presence of Ser5 reduced the transition to the irreversible low-FRET state, instead leaving HA predominantly in an intermediate-FRET state after 10 min at pH 4.8. After 30 min at pH 4.8, the irreversible low-FRET state became predominant (Fig. 7D). These results suggest that Ser5 transiently stabilizes the intermediate-FRET conformation and impedes progression to the final stable coiled-coil conformation. To summarize, Ser5 destabilizes HAs on virions and further inhibits the fusion process induced by HA.
DISCUSSION
Ser5 and Ser3 were originally described as functioning in lipid metabolism (2). More recently, they were identified as cellular proteins which inhibit HIV infection; Ser3 is less potent than Ser5, and both are antagonized by the virus-coded Nef protein (3, 4). They can also block infection by a number of other retroviruses (5); in fact, 2 other retroviruses also synthesize anti-Ser5 proteins, glycogag from MLV (5), and S2 from EIAV (6), each completely unrelated to the others. This parallel suggests that Ser5 has imposed a significant selective pressure during retrovirus evolution.
In addition to many retroviruses, Ser5 inhibits the pararetrovirus hepatitis B virus (34), the classical pestivirus swine fever virus (35), and some pseudovirions bearing non-retroviral glycoproteins (18). Strikingly, the susceptibilities of closely related retroviruses often differ dramatically (3–5, 10, 11). The mechanism by which Ser5 blocks infection of susceptible viruses is not fully understood, but it is known to act at the cell-entry step (5, 8): when it is present in virus-producing cells, it reduces the ability of the progeny viruses to successfully penetrate into new host cells.
We now report that the antiviral activity of Ser5 extends to pseudovirions with the glycoproteins of the orthomyxovirus influenza A virus (IAV) including group both 1 and 2 HA proteins (Fig. 1C), and indeed to intact IAV (Fig. 5). As with HIV-1, Ser5 interferes with the membrane fusion induced by these glycoproteins (Fig. 4). The fact that the magnitude of its activity against intact IAV is similar to that against IAV pseudovirions suggests the possibility that unlike some retroviruses, IAV does not encode an accessory protein contributing to anti-Ser5 resistance.
The mechanism by which Ser5 blocks membrane fusion induced by some (but not all) viral envelope glycoproteins is not known. It is a plasma membrane protein with multiple membrane-spanning domains (13), and appears to be incorporated into virions as part of the membrane surrounding the budding virus particle. We showed that a mutant of Ser5 which is not associated with the plasma membrane, K130A, lacks activity against the IAV pseudovirion (Fig. 3A) as well as HIV-1 (13), implying that plasma membrane association is necessary for antiviral activity. In fact, co-immunoprecipitation experiments indicated that Ser5 interacts with IAV HA at the plasma membrane (Fig. 3C). It seems possible that, as with HIV-1 Env (8, 10, 14), the contact with Ser5 alters the conformation of IAV HA; this hypothesis is consistent with the smFRET data on HA in the presence of Ser5 (Fig. 7), showing that Ser5 destabilizes the pre-fusion state of HA and inhibits transition to the coiled-coil conformation during the fusion process, ultimately interfering with viral entry.
While the finding that Ser5 is active against IAV adds to our knowledge regarding this novel restriction factor, we are still quite ignorant regarding its mechanism of action. It is remarkable that, on the one hand, its activity is quite type-specific (5, 8, 14, 15, 34, 35), while at the same time it evidently interacts directly with divergent viral envelope glycoproteins (Fig. 3) (36, 37). Interestingly, it has recently been proposed that it is a lipid transporter (38). Further investigation is obviously required before these questions can be resolved.
IAV is a respiratory virus which has led to devastating worldwide pandemics in recent history. The knockdown experiment shows that endogenous Ser5 can protect cells in culture from this virus (Fig. 6B), raising the possibility that it provides some defense in vivo against these viral diseases. We also found that it is constitutively expressed in cultured small airway epithelial cells, as well as in the human cell lines used in our studies (Fig. 6A). Taken together, the results support the hypothesis that Ser5 is a natural defense against IAV, and, perhaps, diverse other enveloped viruses, as well as against a number of retroviruses.
MATERIALS AND METHODS
Cell lines and virus.
All cell lines were cultured in Dulbecco modified Eagle medium containing 10 to 20% fetal bovine serum (GE Healthcare) and 1% penicillin-streptomycin (Thermo Fisher), except that human, small airway epithelial cells (HSAEC) were cultured in Airway Cell Basal Medium (ATCC) supplemented with the components in the Bronchial Epithelial Growth Kit (ATCC). CaCo2 cells and influenza A/PR/8/34 (H1N1) virus (IAV [PR8/H1N1]) were purchased from ATCC. The 293T/17 (293T) and A549 cells were a kind gift from Jens H. Kuhn (NIH/NIAID). MDCK cells were a kind gift from Jeffrey B. Kopp (NIH/NIDDK). HSAEC were kindly provided by Eric O. Freed (NIH/NCI). TZM-bl cells and the pNL4-3.LucR-E- plasmid were obtained from the NIH AIDS Reagent Program.
Plasmids.
Plasmids pNL4-3.Luc.R-E- with defective Nef, Env, and Vpr genes, and pMM310 encoding HIV-1 YU2 Vpr β-lactamase (BlaM) were obtained from the NIH AIDS Reagent Program. Plasmid pHW2000-H7HA encoding the hemagglutinin protein of influenza A/Hangzhou/1/02/2013 (H7N9) (GenBank: AGI60301.1) virus was a kind gift from Richard YT Kao (Hong Kong University). The expression plasmid for H7HA, pcDNA3.1(+)-H7HA, was prepared by cloning the H7HA gene from pHW2000-H7HA into pcDNA3.1(+) (ThermoFisher) between KpnI and NotI sites. The following plasmids used in this study have been described previously: pIII-NL encoding HIV-1 NL4-3 Env (a gift from Eric O. Freed) (39), pCMV-VSV-G encoding the vesicular stomatitis virus G protein (Addgene), pPolII-H5HA encoding the HA protein of influenza A/turkey/Turkey/1/2005 (H5N1) virus (40); pBJ5-Ser2, pBJ5-Ser3, and pBJ5-Ser5 (all gifts from Heinrich Gottlinger, University of Massachusetts) (3); and pCYL43, PB-T-Rfa, and PB-RB, all used in the piggyBac transposon-based mammalian cell expression system (a gift from Andras Nagy, Samuel Lunenfeld Research Institute) (29). The plasmids used for the double-split protein-based cell fusion assay (pDSP 1 to 7 and pDSP 8 to 11) were a gift from Zene Matsuda (University of Tokyo) (41). The Ser5 mutant (pBJ5-Ser5-K130A) plasmid was prepared by introducing the K130A mutation into pBJ5-Ser5 via site-directed mutagenesis. The plasmids used for the immunofluorescence assay were prepared by inserting an internal HA epitope tag into the Ser5 wild-type and mutant plasmids between residues 290 and 291 to produce pBJ5-Ser5iHA and pBJ5-Ser5iHA-K130A. The plasmid used for the co-immunoprecipitation assay was prepared by putting a FLAG tag at the C-terminus of the wild-type Ser5 and Ser5-K130A mutant to produce pBJ5-Ser5-FLAG and pBJ5-Ser5-K130A-FLAG, respectively. To prepare the plasmids encoding the influenza A/PR/8/34 (H1N1) neuraminidase (NA) and matrix (M) proteins, cDNA was prepared from the viral RNA extracted from infected cells using Transcriptor First Strand cDNA Synthesis Kit (Roche) and the universal primer uni12 specific for IAV vRNA as previously described (42). The plasmid pcDNA3.1(+)-N1NA encoding neuraminidase was produced by cloning its cDNA into pcDNA3.1(+) (ThermoFisher) between KpnI and NotI sites. Similarly, the cDNA of IAV matrix protein was cloned into pcDNA3.1(+) between BamHI and NotI site to make the pcDNA3.1(+)-M plasmid. The pcDNA3.1(+)-Ser5 plasmid for the standard curve of the qPCR were prepared by cloning the Ser5 from pBJ5-Ser5 into pcDNA3.1(+) between BamHI and NotI sites. To construct the pGEMT-GAPDH plasmid for the standard curve, GAPDH fragment was amplified from the cDNA of extracted RNA using primer pairs: 5′-TGCACCACCAACTGCTTAGC-3′ (GAPDH-F), and 5′-GGCATGGACTGTGGTCATGAG-3′ (GAPDH-R), and then cloned into pGEM-T Easy Vector (Promega) using pGEM-T Easy Vector Systems (Promega). The inducible Ser5 expression plasmid used in the piggyBac expression system was produced by cloning the wild-type Ser5 gene fused with a C-terminal HA tag into the pCR8/GW/TOPO entry vector (ThermoFisher) and further transferring this insert into PB-T-Rfa with the GATEWAY cloning system (ThermoFisher).
Pseudovirion production and infectivity test.
Pseudovirions were produced in 293T cells with Mirus TransIT-293 transfection reagent. Cells were cotransfected with the HIV core plasmid pNL4-3.LucR-E-, different glycoprotein expression plasmids, and pUC-CMV as a filler plasmid. The ratio of the HIV core to total glycoprotein expression plasmid amount was 3:1 for IAV, and 6:1 for HIV-1 (NL4-3) and VSV. For IAV-H5HA pseudovirion production, equal amounts of pPolII-H5HA and pcDNA3.1(+)-N1NA plasmids were mixed to achieve the HIV core to glycoprotein expression plasmid ratio. To generate IAV-H7HA pseudovirions, cells were transfected with pcDNA3.1(+)-H7HA and pNL4-3 LucR-E- to achieve the above ratio, in the absence of pcDNA3.1(+)-N1NA. At 48 h posttransfection, transfected 293T cells were washed with Expi293 expression medium once and replenished with the same medium in the presence of 1/500 U/mL neuraminidase (Roche) and 2 μg/mL L-(tosylamido-2-phenyl) ethyl chloromethyl ketone (TPCK) -treated trypsin (ThermoFisher). Depending on the experiment, transfections also included various amounts of pBJ5-Ser2, pBJ5-Ser3, pBJ-Ser5, pBJ-Ser5-K130A, pBJ5-Ser5iHA, and pBJ5-Ser5iHA-K130A as indicated in the corresponding figure legends. Viral supernatants were harvested at 72 h posttransfection and passed through 0.22 μm filters.
To measure the infectivity of the pseudovirions, we first seeded the target cells (MDCK for HA-containing pseudovirions, TZM-bl for NL4-3 Env-containing pseudovirions, and both for VSV-G-containing pseudovirions) in 12-well plates at 1 × 10⁵ cells per well. The following day, cells were infected as indicated; TZM-bl cells were pretreated with 20 μg/mL DEAE-dextran (Sigma) at 37°C for 30 min before infection. At 72 h pi, firefly luciferase activity was measured in cell lysates, using the luciferase assay system (Promega) following the manufacturer’s protocol. Meanwhile, the relative amount of input virus in the filtered virus supernatant was determined by quantitative anti-p24 immunoblotting (see Fig. S1). The specific infectivity was finally determined by normalizing the luciferase signal with the amount of virus input.
Western blot analysis.
Cells were lysed in a cocktail of 1 x NuPAGE LDS sample buffer (ThermoFisher) and 50 mM TCEP-HCl (Gold Biotechnology). Cell lysates were then sonicated on ice and stored at −80°C. Virions were concentrated from culture fluid by ultracentrifugaton (25,000 × g, at 4°C for 1.5 h) through a cushion of 20% sucrose prepared in PBS (ThermoFisher). The pellets were resuspended in PBS, and the virus samples for Western blot analysis were prepared in 1 x NuPAGE LDS sample buffer and 50 mM TCEP-HCl. To prevent Ser5 precipitation, samples for Ser5 Westerns were not heated above 37°C. Samples were electrophoresed on NuPAGE 4% to 12% Bis-Tris polyacrylamide gels (ThermoFisher), followed by transfer to Immobilon-FL polyvinylidene difluoride membrane (Millipore). Membranes were blocked in Odyssey blocking buffer (Li-Cor) and probed with the following primary antibodies: goat anti-p24CA (NIH AIDS Reagent Program), rabbit anti-HA (A/turkey/Turkey/1/2005) (ThermoFisher, PA5-81650), rabbit anti-HA (A/PR/8/34) (GeneTex, GTX127294), rabbit anti-Ser5 (Abcam, ab204400), mouse anti-actin (abcepta, AM1021B), rabbit anti-HA tag (Cell Signaling, 3724S), goat anti-HIV1 gp120 (Abcam, ab21179), rabbit anti-NA (Abcam, ab244386), and mouse anti-transferrin (ThermoFisher, 13-6800). Secondary antibodies conjugated to DyLight 800 or 680 (Li-Cor) and the Li-Cor Odyssey imaging system were applied to specifically detect the corresponding protein. Images were analyzed using ImageStudioLite (Li-Cor).
Immunofluorescence assay.
As in pseudovirion production, 293T cells were cotransfected with the HIV core plasmid pNL4-3.LucR-E-, different glycoprotein expression plasmids, and pUC-CMV as a filler plasmid in the presence or absence of wild-type and mutant Ser5 plasmids (1 μg). The pseudovirion-producing 293T cells were seeded in Millicell EZ 8-well slides (Millipore Sigma) at 15,000 cells per chamber 24 h posttransfection. At 48 h posttransfection, cells were fixed with ice-cold methanol followed by washing with PBS. The slides were then incubated with primary antibodies targeting HA of influenza A/turkey/Turkey/1/2005 (H5N1) virus (ThermoFisher) or HA epitope tag (ThermoFisher, 71-5500 or Biolegend, 901502) in Odyssey Blocking buffer in PBS (LI-COR) at room temperature for 30 min, followed by 3 rinses with PBS. Subsequently Alexa Fluor-labeled secondary antibodies diluted in Odyssey Blocking buffer were incubated with cells for 30 min followed by 3 rinses with PBS. Afterwards, the slides were mounted with ProLong Gold antifade reagent (Life Technologies). Images were taken by using a Leica TCS SP8 confocal laser scanning microscope (Leica). For each experiment, the images were acquired by using the same laser power and digital gain parameters with the same microscope. Stacks of 12-bit image with a 1024 × 1024 field size were acquired with 100x objective lenses. After acquiring, the images were processed, and the Pearson colocalization coefficient of each treatment was determined with Imaris (Bitplane).
Co-immunoprecipitation assay.
As with pseudovirion production, 293T cells were cotransfected with the HIV core plasmid pNL4-3.LucR-E-, different glycoprotein expression plasmids, and pUC-CMV as a filler plasmid in the presence or absence of pBJ5-Ser5-FLAG or pBJ5-Ser5-K130A-FLAG plasmid (1 μg). At 48 h posttransfection, the cells were refed with complete medium containing 1/500 U/mL neuraminidase (Roche). After an additional 24 h, cells were washed with PBS once and lysed in ice cold Pierce IP lysis buffer (Thermo Fisher) followed by sonication. The soluble fraction was recovered after centrifugation (16,100 × g, at 4°C for 15 min). Meanwhile, magnetic beads from Dynabeads Protein G Immunoprecipitation Kit (ThermoFisher) were prepared by incubating them with anti-FLAG M2 antibody (Sigma, F1804-1MG) at room temperature for 2 h. Then the soluble fraction (500 μg of total protein) was incubated with the beads overnight at 4°C to pull down Ser5-FLAG or Ser5K130A-FLAG. FLAG beads were magnetically separated from the lysate and washed with ice cold washing buffer from the Immunoprecipitation Kit thrice, and with ice cold Pierce IP lysis buffer once. The FLAG-tagged proteins were eluted from the beads using 20 μL of 3x-FLAG peptide (Sigma) in IP buffer (340 μM) for 2 h rotating at 4°C. The eluted samples were mixed with an equal volume of 2 x NuPAGE LDS sample buffer containing 50 mM TCEP-HCl, while the input cell lysate samples were prepared with 4 x NuPAGE LDS sample buffer and 50 mM TCEP-HCl. Samples were finally subjected to Western blot analysis as described above. Transferrin receptor was used as a cellular membrane protein control.
Virus-cell fusion assay.
The pseudovirions used in the β-lactamase (BlaM)-Vpr virus-cell fusion assay were prepared as follows: Four million 293T cells were seeded in 10 cm dishes a day before the transfection. The following day, cells were cotransfected with the HIV core plasmid pNL4-3.LucR-E- (9 μg for IAV, 6 μg for HIV-1 (NL4-3) and VSV); different glycoprotein expression plasmids; pMM310 (4 μg for IAV, 2 μg for HIV-1 (NL4-3) and VSV); and pUC-CMV as a filler plasmid in the presence or absence of pBJ5-Ser5 (3 μg for IAV, 2 μg for HIV-1 (NL4-3) and VSV). The ratio of the HIV core to total glycoprotein expression plasmid amount was 6:1 for IAV, and 10:1 for HIV-1 (NL4-3) and VSV. At 72 h posttransfection, virus-containing supernatant was harvested and passed through 0.22 μm filters, and viruses were concentrated by ultracentrifugaton (25,000 × g, at 4°C for 1.5 h) through a cushion of 20% sucrose prepared in PBS, and finally resuspended in PBS. The p24 amount in the concentrated virus samples was quantified with the HIV-1 p24 ELISA kit (XpressBio) to normalize the virus amount for the fusion assay.
A day before the assay, 1 × 10⁵ target cells per well were seeded in 24-well plates. For HIV-1 NL4-3 pseudovirion infection, TZM-bl cells were pretreated with 20 μg/mL DEAE-dextran (Sigma) at 37°C for 30 min, and then infected with the pseudovirions. For IAV pseudovirion infection, the pseudovirions were bound to MDCK cells by centrifugation for 15 min at 800 × g. VSV pseudvirions infected all the tested cells and served as the negative controls on Ser5 activity. After 3 to 4 h incubation at 37°C, cells were harvested, transferred into 96-well plates, washed with CO2 independent medium (ThermoFisher), and incubated in CO2 independent medium containing CCF2-AM from the LiveBLAzer FRET—B/G Loading Kit (ThermoFisher) in the dark for 2 h at room temperature. After 2% PFA fixation, flow cytometry was conducted using 405 nm excitation and measuring 450 and 520 nm emission. The flow cytometry data was then analyzed using FlowJo 10.6.
Cell-cell fusion assay.
The double-split protein system was used to quantify cell-cell fusion as previously described (39), with some modifications. The 293T cells were seeded in 6-well plates at 500,000 cells per well 1 day before transfection. Cells regarded as producer cells were transfected with glycoprotein expression plasmids (0.5 μg), including pPolII-H5HA and pIII-NL; pBJ5-Ser5 (2 μg); and the plasmid expressing DSP1-7 (1 μg). To prepare target cells, TZM-bl or 293T cells were transfected with a plasmid expressing DSP8-11 (1 μg) using Lipofectamine 3000 (ThermoFisher) and Mirus TransIT-293 respectively. At 24 h posttransfection, target cells were detached, and 150,000 cells were transferred to poly-d-lysine (ThermoFisher)-treated 96-well plates in sextuplicate. To assess the cell-cell fusion induced by the HIV-1 (NL4-3) glycoprotein, at 48 h posttransfection, target cells were incubated with 30 μM Enduren (Promega) for 1 h and then cocultured with 150,000 producer cells. For cell-cell fusion induced by IAV HA, 150,000 producer cells with or without Ser5 were added to the target cells at 48 h posttransfection. With additional 16 h of incubation, cells were incubated in acidic DMEM, adjusted to pH 5.0 with acetic acid, at 37°C for 10 min to trigger HA conformational change (40), and then neutralized with complete culture medium. After that, medium was replenished with complete culture medium in the presence of 15 μM Enduren. After an additional 2 h of incubation, the luciferase activity due to the cell-cell fusion was measured.
Generation and use of Ser5 expressing cells.
Doxycycline-induced Ser5 expression cassette was introduced into MDCK cells through the piggyBac transposon-based expression system (29), followed by selection with puromycin.
To determine the Ser5 effect on IAV infectivity, MDCK control (MDCK-Ctrl) and doxycycline-inducible Ser5-expressing MDCK (MDCK-Ser5) cells were pretreated with or without 1 μg/mL doxycycline at 37°C for 16 h, and then infected with influenza A/PR/8/34 (H1N1) virus at MOI of 0.01 (i.e., multiplicity at which 1% of MDCK cells were infected as determined by flow cytometry). At 72 h pi, virus supernatant was harvested, passed through 0.22 μm filters, concentrated by ultracentrifugaton (25,000 × g, at 4°C for 1.5 h) through a cushion of 20% sucrose prepared in PBS, and finally resuspended in PBS. To quantify virus amounts, viral RNA (vRNA) of IAV was first extracted from the cells using Quick-RNA Viral Kit (Zymo Research) followed by cDNA synthesis with the universal primer uni12 using Transcriptor First Strand cDNA Synthesis Kit (Roche). The standard curve of IAV matrix gene using pcDNA3.1(+)-M was set up as previously described in this study. With the standard curve, synthesized cDNA was then subjected to qPCR for quantification with primer pairs as previously published (43) using TB Green Premix Ex Taq II (Tli RNase H Plus) (TakaraBio). After that, the infectious titer of IAV produced with or without Ser5 was determined by plaque assay and flow cytometry as previously described (44, 45), with some modifications. For the plaque assay equal amounts of concentrated virus (determined by qPCR of matrix gene RNA) were serially diluted 10-fold with MEM (ThermoFisher) supplemented with 1% FBS. MDCK cells were then infected with serially diluted virus and incubated at 37°C for 1.5 h before removing unbound virus by aspiration. At the end of incubation, MEM containing 0.75% low melting-point agarose (LMA) (ThermoFisher) and 2 μg/mL TPCK-treated trypsin (ThermoFisher) was overlaid onto the infected cells. After 72 h, agarose plugs were removed, monolayers were stained with 0.7% crystal violet (Sigma), and, finally, the plaques were counted to determine the virus titer (PFU/mL). Finally, the virus titer relative to that produced from MDCK-Ctrl cells without doxycycline treatment was calculated. For the determination with flow cytometry, MDCK cells were infected with equal amounts of virus as described above at 37°C for 12 h. Infected cells were fixed/permeabilized with Cytofix/CytoPerm reagent (BD) for 30 min and washed in Perm/Wash buffer (BD). Cells were pelleted, incubated with mouse anti-IAV-NP (Abcam) diluted in Perm/Wash buffer at room temperature for 30 min, and washed in Perm/Wash buffer. Then cells were pelleted, incubated with Alexa Fluor-conjugated secondary antibodies diluted in Perm/Wash buffer at room temperature for 30 min, and washed in Perm/Wash buffer. Finally, cells were sorted and analyzed on a LSRFortessa (BD), and the data was analyzed using FlowJo 10.6.
Quantification of Ser5 mRNA in cell lines and primary cells.
The Ser5 expression level in human cell lines and primary cells was determined by quantitative PCR (qPCR). To set up the standard curve, RNA was first transcribed from pcDNA3.1(+)-Ser5 and pGEMT-GAPDH using the MEGAscript T7 transcription kit (ThermoFisher). The corresponding cDNAs were then synthesized from serial dilutions of these RNAs using the iScript cDNA Synthesis Kit (BIO-RAD). RNA from A549, CaCo2, MDCK and human small airway epithelial cells (HSAEC) was extracted with RNeasy minikit (Qiagen), and 1 μg RNA was subjected to cDNA synthesis using Transcriptor First Strand cDNA Synthesis Kit (Roche). Finally, with the standard curve of Ser5 and GAPDH, Ser5 and GAPDH expression levels in the above cells were quantified by qPCR using TB Green Premix Ex Taq II (Tli RNase H Plus) (TakaraBio) and corresponding primer pairs: 5′-TGCACCACCAACTGCTTAGC-3′ (GAPDH-F), and 5′-GGCATGGACTGTGGTCATGAG-3′ (GAPDH-R), and 5′-CTTCCACTTCGTGTTCTTCCTA-3′ (Ser5-F), and 5′-CCAGCTCCCGCTGAAGAA-3′ (Ser5-R) (12).
Generation and use of Ser5 knockdown cells.
The Ser5 knockdown A549 (A549-Ser5KD) and CaCo2 (CaCo2-Ser5KD) cells were prepared by infecting cells with the Ser5 shRNA lentiviral particles (Santa Cruz Biotechnology). After 3 days, successfully transduced cells were selected with puromycin (ThermoFisher). Similarly, corresponding control cells (A549-Ctrl and CaCo2-Ctrl) were prepared by infecting cells with control shRNA lentiviral particles (Santa Cruz Biotechnology) instead. Successful knockdown was confirmed by quantifying Ser5 mRNA amounts with qPCR in those cells. To assess the effect of the Ser5 knockdown on IAV infectivity, A549-Ser5KD and -Ctrl cells, and CaCo2-Ser5KD and -Ctrl cells were infected with influenza A/PR/8/34 (H1N1) virus at MOI of 1 and 0.1. respectively, on ice for 1 h, which synchronized the virus attachment on cells. After that, infected cells were washed with PBS once to remove unbound virus and replenished with DMEM supplemented with 0.5% FBS and 2 μg/mL TPCK for further incubation. Infected cells were harvested at 8, 24, and 32 h pi. The vRNA and cellular RNA was extracted from infected cells, and then the vRNA of M gene and GAPDH mRNA were quantified by qPCR as described above. Finally, the virus infectivity in infected cells was determined by normalizing IAV vRNA with cellular GAPDH level.
Single-molecular FRET analysis of HA.
Pseudoviral particles containing a single fluorescently labeled HA protomer were prepared essentially as described previously (33). HEK293T cells were transfected with a 1:1 ratio of plasmids encoding wild-type H5 HA from A/Vietnam/1203/2004 and HA with amber stop codons at positions 17 and 127 in HA2. Also included were plasmids encoding HIV-1 GagPol, tRNAPyl and the corresponding aminoacyl tRNA synthetase (NESPylRS), which enable readthrough of the UAG amber codons (46), and N1 NA. To maximize amber codon readthrough, plasmid encoding the elongation factor 1 E55D mutant (47) were also included. Where indicated, the plasmid encoding Ser5 was included at a 3-fold excess over total HA plasmid. Approximately 16 h after transfection the culture media was supplemented with 0.5 mM TCO*A (SiChem), a non-canonical amino acid. Pseudovirus was harvested 24 h later, passed through a 0.45 μm filter and concentrated by ultracentrifugation for 2 h at 25,000 × g at 4°C through a 10% sucrose cushion. The resuspended virus pellet was fluorescently labeled through incubation with 0.5 mM Cy3- and Cy5-tetrazine (Jena Bioscience) for 30 min at room temperature. DHPE-biotin (Avanti Polar Lipids) was then added to the mixture at a final concentration of 0.1 mg/mL and incubated for another 30 min at room temperature with gentle mixing. The pseudovirions were then purified away from unbound fluorophore and lipid by ultracentrifugation for 1 h at 35,000 × g at 4°C over a 6 to 30% OptiPrep (Millipore Sigma) gradient. Purified pseudovirions were then isolated off the gradient by fractionation and stored at −80°C until use. As Ser5 affects neither HA incorporation (Fig. 1B) nor the number of labeled pseudovirions, it evidently does not influence the labeling efficiency of the pseudovirions.
Labeled pseudovirions were immobilized on a streptavidin-coated quartz microscope slide and imaged on a custom-built prism-based total internal reflection fluorescence microscope under constant illumination by a 532-nm laser (Coherent). Fluorescence data were recorded using a Prime 95B sCMOS camera (Teledyne Photometrics) (48). For experiments performed at pH 7.5 or 6.5, pseudovirions were imaged in a buffer containing 50 mM Tris-acetate (pH 7.5 or 6.5) and 50 mM potassium chloride. Alternatively, pseudovirions were imaged in a buffer containing 50 mM potassium acetate (pH 4.8 or pH 6) and 50 mM potassium chloride. In both cases, imaging buffers were supplemented with triplet-state quenchers and an enzymatic oxygen scavenging system, as before (33). All smFRET data were recorded at 100 ms exposure time at room temperature. Essentially as previously described (33), data were processed and sorted using the SPARTAN software package in Matlab (Mathworks) (49). Particles with multiple donors or multiple acceptors were identified by the number of photobleaching events observed and were excluded from the analysis. During hidden Markov modeling (HMM) analysis, 4 FRET states were identified (0.26 ± 0.08, 0.58 ± 0.08, 0.79 ± 0.08, and 0.92 ± 0.07). The identification of the additional state over what was previously reported stems from improvements in signal detection efficiency, which yielded increased signal-to-noise ratio, compared to the microscope previously used (33). FRET histograms were formed by compiling all data points until photobleaching. Gaussian distributions were reconstructed from the HMM state assignments and overlaid on the FRET histograms.
Statistical analysis.
Using GraphPad Prism 9, two-way or one-way analysis of variance (ANOVA) was used for the determination of statistically significant differences. The specific test used is indicated in each figure legend.
The differences between smFRET data sets were quantified by calculating the occupancy (fraction of time) in each of the three non-zero FRET states for each trace. These distributions were visualized using violin plots and compared through P-value calculation using the one-way ANOVA in Matlab. A P-value less than 0.05 was taken to indicate a statistically significant difference between 2 distributions of occupancies.
ACKNOWLEDGMENTS
We wish to acknowledge the superb technical assistance of Demetria Harvin. This work was supported in part by the Intramural Research Program of the NIH, National Cancer Institute, Center for Cancer Research, and in part by the NIH Intramural AIDS Targeted Antiviral Program. This work was also supported by an extramural research grant from the NIH (1 R01 GM143773).
K.K.L. and A.R. designed the research; K.K.L., J.B.M., G.S., and S.M. performed the research; K.K.L., J.B.M., G.S., S.M., A.A.C., and A.R. analyzed the data; and K.K.L., J.B.M., A.A.C., and A.R. wrote the paper.
We declare no competing interests.
Footnotes
This article is a direct contribution from Alan Rein, a Fellow of the American Academy of Microbiology, who arranged for and secured reviews by Kate Bishop, The Francis Crick Institute, and David Evans, University of Wisconsin-Madison.
Contributor Information
Alan Rein, Email: reina@mail.nih.gov.
Ronald Swanstrom, University of North Carolina at Chapel Hill.
REFERENCES
- 1.Firrito C, Bertelli C, Vanzo T, Chande A, Pizzato M. 2018. SERINC5 as a new restriction factor for human immunodeficiency virus and murine leukemia virus. Annu Rev Virol 5:323–340. doi: 10.1146/annurev-virology-092917-043308. [DOI] [PubMed] [Google Scholar]
- 2.Inuzuka M, Hayakawa M, Ingi T. 2005. Serinc, an activity-regulated protein family, incorporates serine into membrane lipid synthesis. J Biol Chem 280:35776–35783. doi: 10.1074/jbc.M505712200. [DOI] [PubMed] [Google Scholar]
- 3.Usami Y, Wu Y, Gottlinger HG. 2015. SERINC3 and SERINC5 restrict HIV-1 infectivity and are counteracted by Nef. Nature 526:218–223. doi: 10.1038/nature15400. [DOI] [PMC free article] [PubMed] [Google Scholar]
- 4.Rosa A, Chande A, Ziglio S, De Sanctis V, Bertorelli R, Goh SL, McCauley SM, Nowosielska A, Antonarakis SE, Luban J, Santoni FA, Pizzato M. 2015. HIV-1 Nef promotes infection by excluding SERINC5 from virion incorporation. Nature 526:212–217. doi: 10.1038/nature15399. [DOI] [PMC free article] [PubMed] [Google Scholar]
- 5.Ahi YS, Zhang S, Thappeta Y, Denman A, Feizpour A, Gummuluru S, Reinhard B, Muriaux D, Fivash MJ, Rein A. 2016. Functional interplay between murine leukemia virus glycogag, Serinc5, and surface glycoprotein governs virus entry, with opposite effects on gammaretroviral and ebolavirus glycoproteins. mBio 7:e01985-16. doi: 10.1128/mBio.01985-16. [DOI] [PMC free article] [PubMed] [Google Scholar]
- 6.Chande A, Cuccurullo EC, Rosa A, Ziglio S, Carpenter S, Pizzato M. 2016. S2 from equine infectious anemia virus is an infectivity factor which counteracts the retroviral inhibitors SERINC5 and SERINC3. Proc Natl Acad Sci USA 113:13197–13202. doi: 10.1073/pnas.1612044113. [DOI] [PMC free article] [PubMed] [Google Scholar]
- 7.Ahmad I, Li S, Li R, Chai Q, Zhang L, Wang B, Yu C, Zheng YH. 2019. The retroviral accessory proteins S2, Nef, and glycoMA use similar mechanisms for antagonizing the host restriction factor SERINC5. J Biol Chem 294:7013–7024. doi: 10.1074/jbc.RA119.007662. [DOI] [PMC free article] [PubMed] [Google Scholar]
- 8.Sood C, Marin M, Chande A, Pizzato M, Melikyan GB. 2017. SERINC5 protein inhibits HIV-1 fusion pore formation by promoting functional inactivation of envelope glycoproteins. J Biol Chem 292:6014–6026. doi: 10.1074/jbc.M117.777714. [DOI] [PMC free article] [PubMed] [Google Scholar]
- 9.Ward AE, Kiessling V, Pornillos O, White JM, Ganser-Pornillos BK, Tamm LK. 2020. HIV-cell membrane fusion intermediates are restricted by Serincs as revealed by cryo-electron and TIRF microscopy. J Biol Chem 295:15183–15195. doi: 10.1074/jbc.RA120.014466. [DOI] [PMC free article] [PubMed] [Google Scholar]
- 10.Beitari S, Ding S, Pan Q, Finzi A, Liang C. 2017. Effect of HIV-1 Env on SERINC5 antagonism. J Virol 91:e02214-16. doi: 10.1128/JVI.02214-16. [DOI] [PMC free article] [PubMed] [Google Scholar]
- 11.Zhang X, Shi J, Qiu X, Chai Q, Frabutt DA, Schwartz RC, Zheng YH. 2019. CD4 expression and Env conformation are critical for HIV-1 restriction by SERINC5. J Virol 93:e00544-19. doi: 10.1128/JVI.00544-19. [DOI] [PMC free article] [PubMed] [Google Scholar]
- 12.Zhang X, Zhou T, Yang J, Lin Y, Shi J, Zhang X, Frabutt DA, Zeng X, Li S, Venta PJ, Zheng YH. 2017. Identification of SERINC5-001 as the predominant spliced isoform for HIV-1 restriction. J Virol 91:e00137-17. doi: 10.1128/JVI.00137-17. [DOI] [PMC free article] [PubMed] [Google Scholar]
- 13.Pye VE, Rosa A, Bertelli C, Struwe WB, Maslen SL, Corey R, Liko I, Hassall M, Mattiuzzo G, Ballandras-Colas A, Nans A, Takeuchi Y, Stansfeld PJ, Skehel JM, Robinson CV, Pizzato M, Cherepanov P. 2020. A bipartite structural organization defines the SERINC family of HIV-1 restriction factors. Nat Struct Mol Biol 27:78–83. doi: 10.1038/s41594-019-0357-0. [DOI] [PMC free article] [PubMed] [Google Scholar]
- 14.Schulte B, Selyutina A, Opp S, Herschhorn A, Sodroski JG, Pizzato M, Diaz-Griffero F. 2018. Localization to detergent-resistant membranes and HIV-1 core entry inhibition correlate with HIV-1 restriction by SERINC5. Virology 515:52–65. doi: 10.1016/j.virol.2017.12.005. [DOI] [PMC free article] [PubMed] [Google Scholar]
- 15.Chen YC, Sood C, Marin M, Aaron J, Gratton E, Salaita K, Melikyan GB. 2020. Super-resolution fluorescence imaging reveals that serine incorporator protein 5 inhibits human immunodeficiency virus fusion by disrupting envelope glycoprotein clusters. ACS Nano 14:10929–10943. doi: 10.1021/acsnano.0c02699. [DOI] [PMC free article] [PubMed] [Google Scholar]
- 16.Brandenberg OF, Magnus C, Rusert P, Regoes RR, Trkola A. 2015. Different infectivity of HIV-1 strains is linked to number of envelope trimers required for entry. PLoS Pathog 11:e1004595. doi: 10.1371/journal.ppat.1004595. [DOI] [PMC free article] [PubMed] [Google Scholar]
- 17.Magnus C, Rusert P, Bonhoeffer S, Trkola A, Regoes RR. 2009. Estimating the stoichiometry of human immunodeficiency virus entry. J Virol 83:1523–1531. doi: 10.1128/JVI.01764-08. [DOI] [PMC free article] [PubMed] [Google Scholar]
- 18.Diehl WE, Guney MH, Vanzo T, Kyawe PP, White JM, Pizzato M, Luban J. 2021. Influence of different glycoproteins and of the virion core on SERINC5 antiviral activity. Viruses 13:1279. doi: 10.3390/v13071279. [DOI] [PMC free article] [PubMed] [Google Scholar]
- 19.White JM, Delos SE, Brecher M, Schornberg K. 2008. Structures and mechanisms of viral membrane fusion proteins: multiple variations on a common theme. Crit Rev Biochem Mol Biol 43:189–219. doi: 10.1080/10409230802058320. [DOI] [PMC free article] [PubMed] [Google Scholar]
- 20.Leikina E, Ramos C, Markovic I, Zimmerberg J, Chernomordik LV. 2002. Reversible stages of the low-pH-triggered conformational change in influenza virus hemagglutinin. EMBO J 21:5701–5710. doi: 10.1093/emboj/cdf559. [DOI] [PMC free article] [PubMed] [Google Scholar]
- 21.Cowling BJ, Jin L, Lau EH, Liao Q, Wu P, Jiang H, Tsang TK, Zheng J, Fang VJ, Chang Z, Ni MY, Zhang Q, Ip DK, Yu J, Li Y, Wang L, Tu W, Meng L, Wu JT, Luo H, Li Q, Shu Y, Li Z, Feng Z, Yang W, Wang Y, Leung GM, Yu H. 2013. Comparative epidemiology of human infections with avian influenza A H7N9 and H5N1 viruses in China: a population-based study of laboratory-confirmed cases. Lancet 382:129–137. doi: 10.1016/S0140-6736(13)61171-X. [DOI] [PMC free article] [PubMed] [Google Scholar]
- 22.Russell CJ. 2016. Orthomyxoviruses: structure of antigens. Reference module in biomedical sciences. doi: 10.1016/b978-0-12-801238-3.95721-0. [DOI]
- 23.Li J, Yu X, Pu X, Xie L, Sun Y, Xiao H, Wang F, Din H, Wu Y, Liu D, Zhao G, Liu J, Pan J. 2013. Environmental connections of novel avian-origin H7N9 influenza virus infection and virus adaptation to the human. Sci China Life Sci 56:485–492. doi: 10.1007/s11427-013-4491-3. [DOI] [PubMed] [Google Scholar]
- 24.Bottcher-Friebertshauser E, Klenk HD, Garten W. 2013. Activation of influenza viruses by proteases from host cells and bacteria in the human airway epithelium. Pathog Dis 69:87–100. doi: 10.1111/2049-632X.12053. [DOI] [PMC free article] [PubMed] [Google Scholar]
- 25.Li S, Li R, Ahmad I, Liu X, Johnson SF, Sun L, Zheng YH. 2022. Cul3-KLHL20 E3 ubiquitin ligase plays a key role in the arms race between HIV-1 Nef and host SERINC5 restriction. Nat Commun 13:2242. doi: 10.1038/s41467-022-30026-y. [DOI] [PMC free article] [PubMed] [Google Scholar]
- 26.Cavrois M, De Noronha C, Greene WC. 2002. A sensitive and specific enzyme-based assay detecting HIV-1 virion fusion in primary T lymphocytes. Nat Biotechnol 20:1151–1154. doi: 10.1038/nbt745. [DOI] [PubMed] [Google Scholar]
- 27.Wyma DJ, Jiang J, Shi J, Zhou J, Lineberger JE, Miller MD, Aiken C. 2004. Coupling of human immunodeficiency virus type 1 fusion to virion maturation: a novel role of the gp41 cytoplasmic tail. J Virol 78:3429–3435. doi: 10.1128/jvi.78.7.3429-3435.2004. [DOI] [PMC free article] [PubMed] [Google Scholar]
- 28.Yamamoto M, Kiso M, Sakai-Tagawa Y, Iwatsuki-Horimoto K, Imai M, Takeda M, Kinoshita N, Ohmagari N, Gohda J, Semba K, Matsuda Z, Kawaguchi Y, Kawaoka Y, Inoue JI. 2020. The anticoagulant nafamostat potently inhibits SARS-CoV-2 S protein-mediated fusion in a cell fusion assay system and viral infection in vitro in a cell-type-dependent manner. Viruses 12:629. doi: 10.3390/v12060629. [DOI] [PMC free article] [PubMed] [Google Scholar]
- 29.Li Z, Michael IP, Zhou D, Nagy A, Rini JM. 2013. Simple piggyBac transposon-based mammalian cell expression system for inducible protein production. Proc Natl Acad Sci USA 110:5004–5009. doi: 10.1073/pnas.1218620110. [DOI] [PMC free article] [PubMed] [Google Scholar]
- 30.Peteranderl C, Herold S, Schmoldt C. 2016. Human influenza virus infections. Semin Respir Crit Care Med 37:487–500. doi: 10.1055/s-0036-1584801. [DOI] [PMC free article] [PubMed] [Google Scholar]
- 31.Li IW, Chan KH, To KW, Wong SS, Ho PL, Lau SK, Woo PC, Tsoi HW, Chan JF, Cheng VC, Zheng BJ, Chen H, Yuen KY. 2009. Differential susceptibility of different cell lines to swine-origin influenza A H1N1, seasonal human influenza A H1N1, and avian influenza A H5N1 viruses. J Clin Virol 46:325–330. doi: 10.1016/j.jcv.2009.09.013. [DOI] [PubMed] [Google Scholar]
- 32.Benton DJ, Gamblin SJ, Rosenthal PB, Skehel JJ. 2020. Structural transitions in influenza haemagglutinin at membrane fusion pH. Nature 583:150–153. doi: 10.1038/s41586-020-2333-6. [DOI] [PMC free article] [PubMed] [Google Scholar]
- 33.Das DK, Govindan R, Nikic-Spiegel I, Krammer F, Lemke EA, Munro JB. 2018. Direct visualization of the conformational dynamics of single influenza hemagglutinin trimers. Cell 174:926–937. doi: 10.1016/j.cell.2018.05.050. [DOI] [PMC free article] [PubMed] [Google Scholar]
- 34.Liu Y, Wang H, Zhang J, Yang J, Bai L, Zheng B, Zheng T, Wang Y, Li J, Zhang W. 2020. SERINC5 inhibits the secretion of complete and genome-free hepatitis B virions through interfering with the glycosylation of the HBV envelope. Front Microbiol 11:697. doi: 10.3389/fmicb.2020.00697. [DOI] [PMC free article] [PubMed] [Google Scholar]
- 35.Li W, Zhang Z, Zhang L, Li H, Fan S, Zhu E, Fan J, Li Z, Chen W, Yi L, Ding H, Chen J, Zhao M. 2020. Antiviral role of serine incorporator 5 (SERINC5) proteins in classical swine fever virus infection. Front Microbiol 11:580233. doi: 10.3389/fmicb.2020.580233. [DOI] [PMC free article] [PubMed] [Google Scholar]
- 36.Haider T, Snetkov X, Jolly C. 2021. HIV envelope tail truncation confers resistance to SERINC5 restriction. Proc Natl Acad Sci USA 118:e2101450118. doi: 10.1073/pnas.2101450118. [DOI] [PMC free article] [PubMed] [Google Scholar]
- 37.Timilsina U, Umthong S, Ivey EB, Waxman B, Stavrou S. 2022. SARS-CoV-2 ORF7a potently inhibits the antiviral effect of the host factor SERINC5. Nat Commun 13:2935. doi: 10.1038/s41467-022-30609-9. [DOI] [PMC free article] [PubMed] [Google Scholar]
- 38.Leonhardt SA, Purdy MD, Grover JR, Yang Z, Poulos S, McIntire WE, Tatham EA, Erramilli S, Nosol K, Lai KK, Ding S, Lu M, Uchil PD, Finzi A, Rein A, Kossiakoff AA, Mothes W, Yeager M. 2022. CryoEM structures of the human HIV-1 restriction factor SERINC3 and function as a lipid transporter. bioRxiv. doi: 10.1101/2022.07.06.498924. [DOI]
- 39.Ahi YS, Yimer D, Shi G, Majdoul S, Rahman K, Rein A, Compton AA. 2020. IFITM3 reduces retroviral envelope abundance and function and is counteracted by glycoGag. mBio 11:e03088-19. doi: 10.1128/mBio.03088-19. [DOI] [PMC free article] [PubMed] [Google Scholar]
- 40.Lai KK, Cheung NN, Yang F, Dai J, Liu L, Chen Z, Sze KH, Chen H, Yuen KY, Kao RY. 2015. Identification of novel fusion inhibitors of influenza A virus by chemical genetics. J Virol 90:2690–2701. doi: 10.1128/JVI.02326-15. [DOI] [PMC free article] [PubMed] [Google Scholar]
- 41.Kondo N, Miyauchi K, Meng F, Iwamoto A, Matsuda Z. 2010. Conformational changes of the HIV-1 envelope protein during membrane fusion are inhibited by the replacement of its membrane-spanning domain. J Biol Chem 285:14681–14688. doi: 10.1074/jbc.M109.067090. [DOI] [PMC free article] [PubMed] [Google Scholar]
- 42.Hoffmann E, Stech J, Guan Y, Webster RG, Perez DR. 2001. Universal primer set for the full-length amplification of all influenza A viruses. Arch Virol 146:2275–2289. doi: 10.1007/s007050170002. [DOI] [PubMed] [Google Scholar]
- 43.Ward CL, Dempsey MH, Ring CJ, Kempson RE, Zhang L, Gor D, Snowden BW, Tisdale M. 2004. Design and performance testing of quantitative real time PCR assays for influenza A and B viral load measurement. J Clin Virol 29:179–188. doi: 10.1016/S1386-6532(03)00122-7. [DOI] [PMC free article] [PubMed] [Google Scholar]
- 44.Shi G, Ozog S, Torbett BE, Compton AA. 2018. mTOR inhibitors lower an intrinsic barrier to virus infection mediated by IFITM3. Proc Natl Acad Sci USA 115:E10069–E10078. doi: 10.1073/pnas.1811892115. [DOI] [PMC free article] [PubMed] [Google Scholar]
- 45.Yang F, Pang B, Lai KK, Cheung NN, Dai J, Zhang W, Zhang J, Chan KH, Chen H, Sze KH, Zhang H, Hao Q, Yang D, Yuen KY, Kao RY. 2021. Discovery of a novel specific inhibitor targeting influenza A virus nucleoprotein with pleiotropic inhibitory effects on various steps of the viral life cycle. J Virol 95:e01432-20. doi: 10.1128/JVI.01432-20. [DOI] [PMC free article] [PubMed] [Google Scholar]
- 46.Nikic I, Estrada Girona G, Kang JH, Paci G, Mikhaleva S, Koehler C, Shymanska NV, Ventura Santos C, Spitz D, Lemke EA. 2016. Debugging eukaryotic genetic code expansion for site-specific click-PAINT super-resolution microscopy. Angew Chem Int Ed Engl 55:16172–16176. doi: 10.1002/anie.201608284. [DOI] [PMC free article] [PubMed] [Google Scholar]
- 47.Schmied WH, Elsasser SJ, Uttamapinant C, Chin JW. 2014. Efficient multisite unnatural amino acid incorporation in mammalian cells via optimized pyrrolysyl tRNA synthetase/tRNA expression and engineered eRF1. J Am Chem Soc 136:15577–15583. doi: 10.1021/ja5069728. [DOI] [PMC free article] [PubMed] [Google Scholar]
- 48.Blakemore RJ, Burnett C, Swanson C, Kharytonchyk S, Telesnitsky A, Munro JB. 2021. Stability and conformation of the dimeric HIV-1 genomic RNA 5'UTR. Biophys J 120:4874–4890. doi: 10.1016/j.bpj.2021.09.017. [DOI] [PMC free article] [PubMed] [Google Scholar]
- 49.Juette MF, Terry DS, Wasserman MR, Altman RB, Zhou Z, Zhao H, Blanchard SC. 2016. Single-molecule imaging of non-equilibrium molecular ensembles on the millisecond timescale. Nat Methods 13:341–344. doi: 10.1038/nmeth.3769. [DOI] [PMC free article] [PubMed] [Google Scholar]
Associated Data
This section collects any data citations, data availability statements, or supplementary materials included in this article.
Supplementary Materials
Supplementary Methods. Download TEXT S1, PDF file, 0.1 MB (81.2KB, pdf) .
This is a work of the U.S. Government and is not subject to copyright protection in the United States. Foreign copyrights may apply.
Quantification of relative p24 amount in virus supernatant by Western blotting. (A) Representative Western blot analysis of p24 in the virus supernatant samples from Fig. 1C and the p24 standard. The p24 standard was prepared by transfecting 293T cells with the 5 μg of pNL4-3.Luc.R-E- plasmid and IAV glycoproteins, harvested and finally serially diluted for Western blot. The intensity of p24 in the supernatant was analyzed with Image Studio software (LI-COR) to construct the standard curve (B). The p24 standard curve is the mean of 3 independent measurements ± SEM. Download FIG S1, PDF file, 0.1 MB (121KB, pdf) .
This is a work of the U.S. Government and is not subject to copyright protection in the United States. Foreign copyrights may apply.
Nef protein alone does not affect infectivity of pseudovirions with IAV HA. Pseudovirions with indicated glycoproteins were prepared in the presence of varied Nef97ZA012 plasmid amounts, and finally the specific infectivity was determined. The results are presented as the mean of 3 independent experiments ± SEM and analyzed by two-way ANOVA (ns: no significance). Representative Western blot analysis of the virus pellet and cell lysate of indicated preparations is shown. Download FIG S2, PDF file, 0.2 MB (170.6KB, pdf) .
This is a work of the U.S. Government and is not subject to copyright protection in the United States. Foreign copyrights may apply.
Ser5 in target cells does not inhibit IAV (PR8/H1N1) infection. (A) The infectivity test of IAV in Ser5-expressing cells. MDCK-Ctrl and MDCK-Ser5 cells were pretreated with doxycycline for 16 h, and then infected with IAV (PR8/H1N1) at a MOI of 1.0 for 16 h. The percent infection of IAV in MDCK cells with or without Ser5 was finally analyzed by flow cytometry. Representative example plots are shown. (B) Graph depicts normalized infection percentage measurements from 4 independent experiments as in (A). The results are presented as the mean of four independent experiments ± SEM and analyzed by two-way ANOVA (ns: no significance). Download FIG S3, PDF file, 0.1 MB (98.8KB, pdf) .
This is a work of the U.S. Government and is not subject to copyright protection in the United States. Foreign copyrights may apply.
The presence of NA increases the dynamics of HA on viral particles. (A) FRET histograms were acquired using the experimental setup depicted in Fig. 7A and described in Materials and Methods. Data were acquired at neutral pH in the presence and absence of NA, as indicated. FRET histograms are presented overlaid with Gaussian distributions (grey) that represent the 4 non-zero FRET states identified through HMM analysis. The red line indicates the sum of the 4 Gaussians (red). Histogram bins reflect the average of three populations of traces, with error bars representing the SEM. The total number of smFRET traces (N) used to form each histogram is indicated. (B) High- and low-FRET state occupancies were determined through HMM analysis. Bars indicate the average over the population of traces, with error bars representing the SEM. Statistical significance was evaluated using a t test (****, P < 0.00001). Download FIG S4, PDF file, 0.1 MB (90KB, pdf) .
This is a work of the U.S. Government and is not subject to copyright protection in the United States. Foreign copyrights may apply.
FRET histograms indicate occupancies in observed states. (A) FRET histograms acquired at the indicated pH, and in the absence and presence of Ser5, using the experimental setup depicted in Fig. 7A. (B) FRET histograms acquired after transient exposure to pH 4.8 for the indicated amount of time before return to neutral pH. All FRET histograms are displayed as in Fig. S4. Download FIG S5, PDF file, 0.2 MB (174.8KB, pdf) .
This is a work of the U.S. Government and is not subject to copyright protection in the United States. Foreign copyrights may apply.