

ABSTRACT
Potassium-selective channelrhodopsins (KCRs) are light-gated K+ channels recently found in the stramenopile protist Hyphochytrium catenoides. When expressed in neurons, KCRs enable high-precision optical inhibition of spiking (optogenetic silencing). KCRs are capable of discriminating K+ from Na+ without the conventional K+ selectivity filter found in classical K+ channels. The genome of H. catenoides also encodes a third paralog that is more permeable for Na+ than for K+. To identify structural motifs responsible for the unusual K+ selectivity of KCRs, we systematically analyzed a series of chimeras and mutants of this protein. We found that mutations of three critical residues in the paralog convert its Na+-selective channel into a K+-selective one. Our characterization of homologous proteins from other protists (Colponema vietnamica, Cafeteria burkhardae, and Chromera velia) and metagenomic samples confirmed the importance of these residues for K+ selectivity. We also show that Trp102 and Asp116, conserved in all three H. catenoides paralogs, are necessary, although not sufficient, for K+ selectivity. Our results provide the foundation for further engineering of KCRs for optogenetic needs.
KEYWORDS: channelrhodopsins, inhibition, optogenetics, patch clamp, potassium channels
INTRODUCTION
Channelrhodopsins (ChRs) are a diverse group of >500 light-gated ion channels found in eukaryotic microbes (1) and widely used as optogenetic tools (2). ChRs are members of a larger protein family known as microbial rhodopsins (3–5) and are composed of seven transmembrane helices (TM1 to TM7) with the retinal chromophore attached in a Schiff base linkage to a conserved Lys residue in the middle of TM7. In the model flagellate alga Chlamydomonas reinhardtii, the role of ChRs as phototaxis receptors has been established by analysis of knockdown genetic transformants (6). ChRs are thought to function similarly in other microorganisms, because all species in the genomes in which ChRs have been found produce flagellate gametes and/or zoospores during their life cycles. ChRs recently discovered in giant algal viruses are thought to mediate phototaxis of their hosts, thus enhancing host metabolism to support virus reproduction (7, 8).
By their ion selectivity, ChRs can be classified into three groups: anion-selective ChRs (ACRs), cation-selective ChRs (CCRs), and potassium channelrhodopsins (KCRs). ACRs conduct halides and nitrate, hyperpolarize the membrane in mature neurons, and inhibit their spiking (9). CCRs conduct primarily protons and, to a lesser extent, mono- and divalent metal cations (10). The relative permeability of CCRs for Na+ is greater than that for K+, so under physiological conditions they depolarize the membrane and activate neuronal spiking (11). Recently, we reported two potassium channelrhodopsins from the stramenopile fungus-like protist Hyphochytrium catenoides (HcKCR1 and HcKCR2) that are more permeable for K+ than Na+, and we demonstrated that these light-gated channels can be used to inhibit mouse cortical neurons (12). Notably, KCRs lack the K+ channel signature sequence universally found in K+ channels from bacteria, archaea, eukaryotic cells, and their viruses gated by voltage, ligands, heat, pH, or membrane deformation (13, 14). The ability of KCRs to discriminate between K+ and Na+ is particularly intriguing, because it reveals the only so far known alternative mechanism of K+ selectivity.
Cation conductance has appeared at least twice in microbial rhodopsin evolution, as CCRs from chlorophytes and streptophytes show very little protein sequence homology to CCRs from cryptophytes. Structurally and functionally, the latter resemble haloarchaeal proton-pumping rhodopsins such as bacteriorhodopsin, and they are therefore known as bacteriorhodopsin-like cation channelrhodopsins (BCCRs) (15). KCR protein sequences show the highest homology to cryptophyte BCCRs out of all currently known ChRs (12), although their source organism is phylogenetically very distant from cryptophytes. High-resolution structures of only one BCCR, known as ChRmine, have been reported (16, 17). They show trimeric organization typical of haloarchaeal ion-pumping rhodopsins (18), whereas chlorophyte CCRs and cryptophyte ACRs form dimers (19, 20).
In addition to two KCRs, the completely sequenced genome of H. catenoides encodes a third paralog (21). Surprisingly, this channel, named H. catenoides cation channelrhodopsin (HcCCR), did not show higher permeability for K+ than for Na+ when tested by planar automated patch clamp (22). Thus, the three H. catenoides ChRs form a unique highly homologous group of light-gated channels with K+/Na+ permeability ratios differing over a wide range. In this study, we used them as a platform to elucidate the structural foundations of the K+ selectivity mechanism of KCRs. In addition, we tested 13 homologs from other protists and metagenomic samples and characterized those that are electrogenic. The results obtained confirmed our conclusions about the K+ selectivity mechanism drawn from analysis of H. catenoides ChRs.
RESULTS
Characterization of HcCCR.
Previously, we tested HcCCR expressed in HEK293 (human embryonic kidney) cells by automatic patch clamp using complex solutions that do not allow a straightforward estimation of the K+/Na+ permeability (PK/PNa) ratio (22). In this study, we measured its current-voltage relationship (IV curve) by manual patch clamp under bi-ionic conditions (130 mM NaCl in the bath and 130 mM KCl in the pipette; for full solution compositions, see Table S1 in the supplemental material), which we had used earlier to characterize HcKCRs (12). Figure 1A shows a series of photocurrents generated by HcCCR under incremental voltage, and Fig. 1C (red) shows the mean voltage dependence of the peak photocurrent. The reversal potential (Vrev), estimated by approximation of the IV curve to zero current, was >40 mV under these conditions (Fig. 1C, red). Figure 1B shows a series of photocurrents generated by HcCCR upon replacement of Na+ in the bath with K+. The mean IV curve measured with symmetrical K+ is shown in Fig. 1C (blue). The current amplitude was reduced, and the Vrev shifted to zero (Fig. 1C, blue). The PK/PNa value, calculated from the Vrev shift using the Goldman-Hodgkin-Katz equation (23), was ~0.2. This value was 128-fold and 94-fold smaller than the PK/PNa ratios of HcKCR1 and HcKCR2, respectively (12), and even smaller than that of ChR2 from C. reinhardtii, the best-characterized chlorophyte CCR (0.3 to 0.5 [10, 24]). Under bi-ionic conditions, HcKCR1 showed a shift of Vrev to more depolarized values during 1-s illumination (12). This shift was even larger in the recently identified KCR from the stramenopile Wobblia lunata, named Wobblia inhibitory ChR1 (WiChR1) (Fig. 1D, black, and Fig. S1) (25). However, no such shift was detected in HcCCR (Fig. 1D, red), which confirmed our previous conclusion that in HcKCR1 this shift reflected a decrease in the PK/PNa ratio during illumination (12). The decay of HcCCR photocurrent slightly accelerated upon depolarization, but was slower than that in both HcKCRs (Fig. 1E). The maximal spectral sensitivity of HcCCR was at 530 nm (Fig. 1F).
FIG 1.

Electrophysiological characterization of HcCCR. (A and B) Series of photocurrent traces recorded from HcCCR upon incremental voltage with 130 mM Na+ (A) or K+ (B) in the bath and 130 mM K+ in the pipette. The duration of the light pulse is shown by the green bars. (C) The peak current-voltage relationships of HcCCR under the indicated ionic conditions. The data points are the means ± SEMs (n = 7 and 6 cells for the Na+ and K+ bath, respectively). (D) The reversal potentials of the peak current and current at the end of 1-s illumination measured in the Na+ bath as in panel A. The data points are the means ± SEMs (n = 6 to 8 cells for each variant). *, P < 0.05 by the two-tailed paired sample Wilcoxon signed-rank test. n.s., not significant. The data for HcKCR1 and HcKCR2 are shown for comparison. (E) The dependence of the photocurrent half-decay time on the holding voltage for the three H. catenoides ChRs. The data points are the means ± SEMs (n = 6 cells for each variant); the lines are linear approximations. (F) Action spectrum of HcCCR photocurrents. The data points are the means ± SEMs (n = 6 cells). The numerical data for panels C, D, E and F, including the exact numbers of cells sampled, are provided in Data Set S1, and full statistical analysis, including the exact P values, is in Data Set S2.
Electrophysiological characterization of WiChR1. (A) Series of photocurrent traces recorded upon incremental voltage with 130 mM Na+ in the bath and 130 mM K+ in the pipette. The duration of the light pulse is shown by the green bars. (C) Peak current-voltage relationships of WiChR1. Black, mean ± SEM (n = 7 cells); gray, data from individual cells. For two cells in which the photocurrent at the positive voltages exceeded the dynamic range of the amplifier (20 nA), the peak values were obtained by fitting of a sigmoidal (dose-response) function to the data. The red arrow points to the reversal potential. Download FIG S1, TIF file, 0.2 MB (233.4KB, tif) .
Copyright © 2022 Govorunova et al.
This content is distributed under the terms of the Creative Commons Attribution 4.0 International license.
Solution compositions for whole-cell patch clamp recording. LJP, liquid junction potential. All concentrations are millimolar. Download Table S1, DOCX file, 0.01 MB (13.4KB, docx) .
Copyright © 2022 Govorunova et al.
This content is distributed under the terms of the Creative Commons Attribution 4.0 International license.
Numerical data shown in Fig. 1C to F, Fig. 2B, D, and E, and Fig. 4D to G in the main text. Download Data Set S1, XLSX file, 0.02 MB (21.7KB, xlsx) .
Copyright © 2022 Govorunova et al.
This content is distributed under the terms of the Creative Commons Attribution 4.0 International license.
Full statistical analysis of the data shown in Fig. 1D and 2B and D and in the text. Download Data Set S2, PDF file, 0.2 MB (208.3KB, pdf) .
Copyright © 2022 Govorunova et al.
This content is distributed under the terms of the Creative Commons Attribution 4.0 International license.
HcCCR_HcKCR1 chimeras and mutants.
The seven-transmembrane (7TM) domain of HcCCR shares 70 to 73% identity and 83 to 86% similarity at the protein level with those of KCRs (Fig. S2A). Remarkably, the protein alignment shows no gaps, so the numbers of the homologous residues are the same in all three proteins. As the first step toward determination of the structural foundations of the K+ selectivity of HcKCRs, we carried out patch clamp analysis of HcCCR_HcKCR1 chimeras. Starting with the HcCCR sequence, we systematically replaced individual predicted helical regions with those of HcKCR1. We have also created an additional chimera by replacement of the N-terminal region of HcCCR with that of HcKCR1. A protein alignment of the chimeras is shown in Fig. S2B, and their schematic representation is shown in Fig. 2A. Next, we measured the IV curves of the chimeras under bi-ionic conditions (Fig. S3A) and calculated the Vrev values as described above for wild-type HcCCR. Remarkably, replacement of TM2 or TM7 caused a >40-mV shift of Vrev to more negative values, indicating a large increase in the PK/PNa ratio (Fig. 2B). These results suggested that residues responsible for the K+ selectivity of HcKCRs are located in TM2 and TM7.
FIG 2.
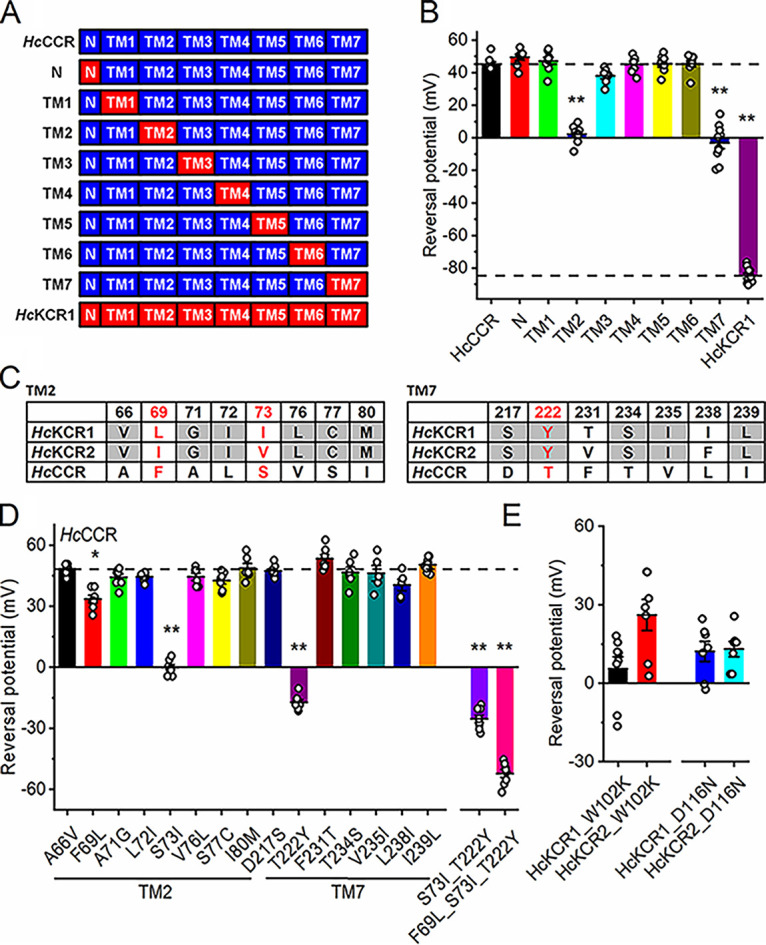
Analysis of HcCCR chimeras and mutants. (A) Schematic representation of HcKCR1_HcCCR chimeras tested in this study. (B) Vrev values measured in the wild-type proteins and chimeras under bi-ionic conditions (130 mM Na+ in the bath and 130 mM K+ in the pipette). The dashed lines mark the Vrev value of wild-type HcCCR and HcKCR1. (C) The residues in the tested positions in TM2 and TM7 of the three H. catenoides ChRs. The red font shows the positions critical for K+ selectivity. (D) Vrev values measured in the single and multiple HcCCR mutants as described for B. The dashed line marks the Vrev value of wild-type HcCCR. (E) Vrev values measured in the W102K and D116N mutants of HcKCR1 and HcKCR2. In panels B, D and E, the bars and whiskers show the means ± SEMs (n = 5 to 10 cells); the empty circles show the data for individual cells. *, P < 0.05; **, P < 0.01 by one-way ANOVA followed by the Tukey test for means comparison. The numerical data for panels B, D, and E are provided in Data Set S1, and their full statistical analysis is in Data Set S2.
(A) Protein alignment of 7TM domains of H. catenoides ChRs. The residues are shaded according to the degree of conservation. The numbers on the right are those of the last residue in each line. The red boxes show predicted transmembrane helices. (B) Protein alignment of the HcKCR1_HcCCR chimeras tested in this study. The residues are shaded according to the degree of conservation. The numbers on the right are those of the last residue in each line. Download FIG S2, TIF file, 2.3 MB (2.3MB, tif) .
Copyright © 2022 Govorunova et al.
This content is distributed under the terms of the Creative Commons Attribution 4.0 International license.
(A) Peak current-voltage relationships of the HcKCR1_HcCCR chimeras. Black, mean ± SEM (n = 7 to 10 cells); gray, data from individual cells. The red arrows point to the reversal potentials. (B) Peak current-voltage relationships of the HcCCR mutants. Black, mean ± SEM (n = 5 to 8 cells); gray, data from individual cells. The red arrows point to the reversal potentials. Download FIG S3, TIF file, 2.7 MB (2.7MB, tif) .
Copyright © 2022 Govorunova et al.
This content is distributed under the terms of the Creative Commons Attribution 4.0 International license.
Next, we identified the positions in TM2 and TM7 occupied by the same residue in both HcKCRs but not HcCCR and the positions in which the residues are different in all three proteins (Fig. 2C). We individually replaced the residues of HcCCR with those found in HcKCR1 and measured the IV curves of the resultant point mutants under bi-ionic conditions (Fig. S3B). Only three mutations (F69L, S73I, and T222Y) caused a significant shift of Vrev toward more negative values (Fig. 2D), indicating that the mutated residue positions are critical for the K+ selectivity of HcKCRs. The effect of the individual mutations was synergistic, as the single F69L mutation caused a larger Vrev when it was added to the HcCCR_S73I_T222Y double mutant than when it was made in wild-type HcCCR (Fig. 2D). The three mutations together (F69L, S73I, and T222Y) converted Na+-selective HcCCR into a KCR with a PK/PNa ratio of ~8. In HcKCR2, which shows a slightly lower PK/PNa ratio than HcKCR1 (12), position 73 is occupied by Val instead of Ile. The HcKCR2_V73I mutation caused a small but statistically significant shift of the Vrev from −74 ± 2 to −79 ± 1 mV (mean ± standard error of the mean [SEM], n = 7 and 8 cells for the wild type and the mutant, respectively; P ≤ 0.05 by the two-tailed Mann-Whitney test; for full statistical analysis, see Data Set S2), which corresponded to an increase of the PK/PNa ratio from 17 to 22.
Arginine in position 82 of bacteriorhodopsin is a component of the complex counterion to the protonated retinylidene Schiff base (26) and is highly conserved in all microbial rhodopsins, including chlorophyte and streptophyte CCRs. As an exception, in BCCRs the prevalent residue in the corresponding position is Lys, and in all three H. catenoides paralogs the corresponding position is occupied by Trp102. The HcKCR1_W102R mutation completely abolished photocurrents, whereas HcKCR1_W102K did generate small currents (Fig. S4). Surprisingly, this mutant showed a small positive Vrev under our bi-ionic conditions (Fig. 2E, black), reflecting a dramatic decrease in the PK/PNa ratio caused by the mutation. An even more positive Vrev was observed in the HcKCR2_W102K mutant (Fig. 2E, red).
Characterization of Trp102 and Asp116 mutants of HcKCR1 and HcKCR2. (Left) Series of photocurrent traces recorded upon incremental voltage with 130 mM Na+ in the bath and 130 mM K+ in the pipette. The duration of the light pulse is shown by the green bars. (Right) Peak current-voltage relationships. Black, mean ± SEM (n = 7 or 8 cells); gray, data from individual cells. The red arrows point to the reversal potentials. Download FIG S4, TIF file, 0.4 MB (455.1KB, tif) .
Copyright © 2022 Govorunova et al.
This content is distributed under the terms of the Creative Commons Attribution 4.0 International license.
The Asp residue in the Schiff base proton donor position (corresponding to Asp96 in bacteriorhodopsin) is conserved in all three H. catenoides paralogs, as in most cryptophyte BCCRs. Mutagenetic neutralization of this residue strongly inhibited photocurrents in both HcKCRs (Fig. S4) and shifted the Vrev to more positive values (Fig. 2E, blue and cyan), indicating a decrease in the PK/PNa ratio. We conclude that Trp102 and Asp116 are necessary, although not sufficient, for the K+ selectivity of HcKCRs. The Asp116 mutations, but not the W102 mutations, also caused an inward rectification of the IV curves in both HcKCRs (Fig. S4).
Homology modeling of HcKCR1 and HcCCR.
To gain insight into locations of the critical residues identified in the previous section and predict their possible interactions, we created homology models of HcKCR1 and HcCCR (Fig. 3). The root mean square deviation (RMSD) of atomic positions between the two models is 0.7 Å. In both models, residues 69 and 73 are located in the cytoplasmic half of TM2 in the vicinity of Asp116, and residue 222 is near the extracellular surface of the protein within 5 Å of Trp102. All these residues are expected to contribute to the putative cation conduction pathway formed by TM1, -2, -3, and -7, as in other ChRs. In the HcCCR model, the orientation of the Trp102 side chain is rotated upward from that in HcKCR, likely as the result of the substitution of a more compact Thr for Tyr in position 222. This conformational difference, if confirmed by X-ray crystallography or cryo-electron microscopy (cryo-EM), may be relevant for control of the PK/PNa ratio. Empirical calculations (27) predict that at pH 7.4 Asp116 is unprotonated in both channels (pKa ~ 4). In both models, Asp116 forms side chain hydrogen bonds with Ser70 in the middle of TM2 and Arg 244 at the cytoplasmic end of TM7. In HcKCR1, the S70A mutation decreased the PK/PNa ratio (25), but Ser70 is conserved in HcCCR and does not render this channel K+ selective. Considering the results of our mutant analysis (Fig. 2D), it is plausible that properties of Ser70 in HcCCR compared to those in HcKCR1 are modified by the substitutions of Phe for Leu and of Ser for Ile in the nearby positions 69 and 73, respectively. The latter, polar-to-nonpolar substitution produced a particularly large effect on the channel selectivity.
FIG 3.
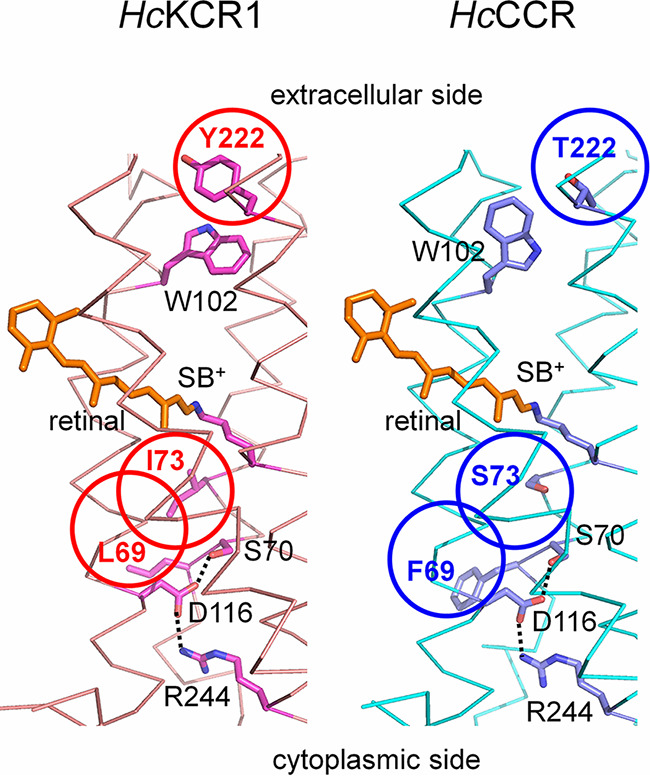
Homology models of HcKCR1 (left) and HcCCR (right). The side chains of the critical residues and the retinal chromophore are shown as sticks, the transmembrane helices as ribbons, and the predicted hydrogen bonds as dotted lines. The three residues responsible to the difference in the relative permeability are circled. SB+, protonated Schiff base.
KCR orthologs from other sources.
To verify our conclusions about the structural foundations of the K+ selectivity drawn from the analysis of HcCCR_HcKCR1 chimeras and mutants, we searched the genomes and transcriptomes of other microorganisms and environmental samples for orthologs of H. catenoides ChRs. We identified 13 sequences that encode rhodopsin domains clustering together with H. catenoides ChRs on a phylogenetic tree (Fig. 4A). Among these, two sequences were found in the predatory alveolate Colponema vietnamica (28), one sequence was in the bicosoecid strain BVI (formerly considered Cafeteria roenbergensis but recently reattributed as Cafeteria burkhardae [Matthias Fischer, Max Planck Institute for Medical Research, personal communication]), three sequences were found in Chromera velia (an alga related to apicomplexan parasites [29]), and seven sequences were found in various metagenomic databases (listed in Materials and Methods). A protein alignment of their rhodopsin (7TM) domains is shown in Fig. S5. The three C. velia sequences and metagenomic MATOU-v2.32008995_3 and TARA_MED_95_MAG_00407_000000002956 differ from the rest by a noncarboxylate residue in the counterion position (corresponding to Asp85 in bacteriorhodopsin). A very unusual feature of the three C. velia sequences is substitution of Gly for Thr89 (bacteriorhodopsin numbering), which is nearly universally replaced with Cys in other known ChRs.
FIG 4.

Characterization of KCR homologs. (A) Phylogenetic tree of the tested HcKCR homologs. Variants that exhibit the K+ selectivity are in red, those that do not are in blue, and variants that do not generate channel currents are in gray. The collapsed node shows 510 other known ChRs (including nonfunctional mgR1 and mgR2). The 50 to 100 bootstrap values are shown as circles. (B and C) Series of photocurrent traces recorded from CovKCRs upon incremental voltage with 130 mM Na+ in the bath and 130 mM K+ in the pipette. The green bars show the duration of the light pulse. (D) IV curves of CovKCRs measured under these conditions. The data points are means ± SEMs (n = 7 and 9 cells for CovKCR1 and CovKCR2, respectively). (E) Action spectra of CovKCR photocurrents. The data points are means ± SEMs (n = 7 cells for each variant). (F and G) Vrev values of the homologs measured under these conditions (F) and upon replacement of Na+ in the bath with NMDG+ (G). The bars and whiskers show the means ± SEMs (n = 6 to 9 cells); the empty circles show the data for individual cells. The dashed lines in panel F show the Vrev values for HcKCR1 and HcCCR from Fig. 2B. (H) Residues in the positions important for the K+ selectivity. Bold text shows variants tested in this study. *, value is from reference 12. n.a., not applicable. The red and blue backgrounds highlight the residues that, respectively, increase and decrease the K+ selectivity. The green background shows the noncarboxylate residue in the proton acceptor position in the C. velia sequence. The numerical data for panels D to G, including the exact numbers of cells sampled for each variant, are provided in Data Set S1.
Protein alignment of 7TM domains of KCR homologs tested in this study. The residues are shaded according to the degree of conservation. In the C. velia sequences, the residues corresponding to Asp85 of bacteriorhodopsin are highlighted yellow, and the residues corresponding to Thr89 of bacteriorhodopsin are highlighted red. The numbers on the right are those of the last residue in each line. Download FIG S5, TIF file, 1.0 MB (1MB, tif) .
Copyright © 2022 Govorunova et al.
This content is distributed under the terms of the Creative Commons Attribution 4.0 International license.
We synthesized mammalian codon-adapted versions of polynucleotides encoding these rhodopsins and expressed them as mCherry fusions in human embryonic kidney (HEK293) cells. Four homologs (Cvel_21397, MATOU-v2.141421879_4, MATOU-v2.32008995_3, and TARA_MED_95_MAG_00407_000000002956) were very poorly expressed and generated no photocurrents. We assigned the names metagenomic rhodopsins 1 to 3 (mgR1 to mgR3) to the sequences MATOU-v2.141421879_4, MATOU-v2.32008995_3, and TARA_MED_95_MAG_00407_000000002956, respectively. Cvel_30056 generated photocurrents, but they were smaller than those from the closely related Cvel_28437, so we did not characterize them. Photocurrents from Cvel_28437 (which we named ChvCCR1) and all other homologs except KAA0157615 from C. burkhardae demonstrated voltage-dependent sign reversal characteristic of passive conductance. We measured the IV curves under bi-ionic conditions, as described above for HcCCR. Only two homologs (GILI01001652 and GILI01010992 from C. vietnamica) showed negative Vrev values, indicating their higher permeability for K+ over Na+. Figure 4B and C show series of their photocurrent traces, and Fig. 4D shows the corresponding IV curves. The action spectrum of GILI01001652 photocurrents peaked near 540 nm, and that of GILI01010992 peaked at 520 nm (Fig. 4E). Following the general ChR numbering convention, we named the more red-shifted paralog CovKCR1 and the more blue-shifted one CovKCR2. Representative photocurrent traces, the corresponding IV curves, and the spectra of other functional homologs are shown in Fig. S6A. All functional homologs showed inward rectification, also typical of many chlorophyte CCRs and cryptophyte BCCRs. We assigned the names mgCCR1 to mgCCR4 to the sequences Ga0170791_133102851, Ga0007756_110676931, MATOU-v2.119411731_5, and Ga0392354_009429_356_1807, respectively. When Na+ in the bath was replaced with nonpermeable N-methyl-d-gluconate (NMDG+), the IV curves for ChvCCR1 and mgCCR4 showed large shifts to the left, indicating a substantial permeability for Na+ (Fig. S6B). The IV curves for mgCCR1 to mgCCR3 showed little change, indicating that these homologs primarily conduct other ions, most probably H+. When the pH of the bath was raised to 9.4, the IV curves of all these three channels shifted to more negative voltages (Fig. S6C), which confirmed this hypothesis. The Vrev values measured in the Na+ and NMDG+ baths are shown in Fig. 4F and G, respectively.
(A) Characterization of KCR homologs with 130 mM Na+ in the bath. (Left) series of photocurrent traces recorded upon incremental voltage. The duration of the light pulse is shown by the colored bars. (Middle) Peak current-voltage relationships. Black, mean ± SEM (n = 6 to 9 cells); gray, data from individual cells. (Right) Action spectra of the photocurrents (mean ± SEM [n = 6 to 10 cells]). The red arrows point to the reversal potentials. (B) Characterization of KCR homologs with 130 mM NMDG+ in the bath. (Left) Series of photocurrent traces recorded upon incremental voltage. The duration of the light pulse is shown by the colored bars. (Right) Peak current-voltage relationships. Black, mean ± SEM (n = 6 or 7 cells); gray, data from individual cells. The red arrows point to the reversal potentials. (C) Characterization of KCR homologs with 130 mM K+ in the bath (pH 9.4). (Left) Series of photocurrent traces recorded upon incremental voltage. The duration of the light pulse is shown by the colored bars. (Right) Corresponding peak current-voltage relationships. The red arrows point to the reversal potentials. Download FIG S6, TIF file, 0.8 MB (837.7KB, tif) .
Copyright © 2022 Govorunova et al.
This content is distributed under the terms of the Creative Commons Attribution 4.0 International license.
Figure 4H shows the residues in the critical positions in the sequences tested in this study and the earlier-characterized HcKCRs. Only the K+-selective C. vietnamica sequences contain all residues identified as important for K+ selectivity in HcKCRs, whereas in the non-K+-selective homologs some corresponding positions are occupied with nonhomologous residues. This strongly supports our conclusions about the structural determinants of K+ selectivity in ChRs. In particular, our results show that the presence of both the Trp102 homolog and the Tyr222 homolog is required for discrimination between K+ and Na+. Neither mgCCR4, in which only Trp102 is conserved but Tyr222 is replaced with Ile, nor mgCCR2, in which only Tyr222 is conserved but Trp102 is replaced with Arg, exhibit K+ selectivity.
Positive photocurrents from KAA0157615 recorded in the Na+ bath decayed with a time constant of ~15 ms after the onset of illumination and were practically independent of voltage (Fig. S6A). This behavior is typical of active intramolecular proton transfer from the Schiff base to an outwardly located acceptor (30). We assigned the name Cafeteria burkhardae rhodopsin 1 (CabR1) to this protein.
DISCUSSION
ChRs are found in many eukaryotic microbes, both photosynthetic and heterotrophic (1). During the last 17 years, ChRs have served as extremely powerful and versatile tools for optical control of the membrane potential in excitable cells such as neurons and myocytes, and they thus have become indispensable for neuroscience research (31). Moreover, partial recovery of visual function in a blind human patient by optogenetic means has launched a new era of ChR gene therapy (32). Our recent discovery of natural ChRs with a high PK/PNa ratio (KCRs) (12) complements the inventory of optogenetic tools with long-sought, nearly universal inhibitory molecules.
Despite their prominence in biomedicine, the molecular mechanisms of ChRs, and especially the structural foundations of their ionic selectivity, are still poorly understood. Unlike conventional ion channels gated by voltage or ligands, in which the ion conductance pathway is formed at the interface between several subunits, it appears that each individual ChR protomer is capable of ion conductance. An interprotomer conductance has been proposed in ChRmine, based on the cryo-EM structure obtained in detergent (16). However, lipids block the space between the protomers in a ChRmine trimer incorporated in membranous nanodisks (17), which is expected to represent a state of the protein close to that in biological membranes.
In this study, we have taken advantage of the existence of closely homologous ChRs, HcKCR1 and HcCCR, that differ >100-fold in their PK/PNa ratios. By systematic replacement of individual transmembrane helices of HcCCR with those of HcKCR1, we found that TM2 and TM7 are responsible for K+ selectivity. These helices contribute to the formation of the ion conduction pathway and channel gating in other ChRs, as shown by electron paramagnetic resonance (33, 34), electron crystallography (35), and X-ray crystallography (36). Then, we systematically mutated all divergent residues in TM2 and TM7 of HcCCR, replacing them with those found in HcKCR1 in the corresponding positions. We identified three residue positions, two in TM2 (69 and 73) and one in TM7 (222), critical for the K+ selectivity of the HcKCRs. A lower PK/PNa ratio of the triple mutant HcCCR_F69L_S73I_T222Y than that of the wild-type HcKCR1 is likely explained by synergy of other divergent residues that produce no significant effect individually but increase PK/PNa in combination with other mutations, as we found for F69L. Phe/Leu69 and Ser/Ile73 are the homologs of Val49 and Ala53 of bacteriorhodopsin, respectively. In this protein, these residues control the position of the Schiff base lysine (Lys216) side chain relative to Asp85 (conserved in H. catenoides ChRs as Asp105) and affect distribution of the proton between them (37). In chlorophyte CCRs, the position of Ser/Ile73 is occupied by a highly conserved Glu residue (Glu90 in CrChR2). It contributes to the “central gate” and controls the selectivity of the channel; mutation of Glu90 to Lys or Arg renders CrChR2 permeable to anions (38). Considering the low protein sequence homology between H. catenoides ChRs and chlorophyte CCRs, the importance of this position in determination of the channel selectivity suggests a functional principle common to all ChRs.
Remarkably, two residues that are conserved in all three H. catenoides ChRs, namely, Trp102 and Asp116, are also required for the K+ selectivity of HcKCRs, as we found by testing their W102K and D116N mutants. Trp102 corresponds to Arg82 of bacteriorhodopsin, which is highly conserved in microbial rhodopsins. Mutagenetic neutralization of the homologous residue (the R109N mutation) in the Na+-pumping rhodopsin from the flavobacterium Dokdonia eikasta (KR2) brings about weak passive K+ conductance (39). In cryptophyte BCCRs, the Arg82 position can be occupied by Pro, as in GtCCR1 and GtCCR2 from Guillardia theta (15), or even Glu, as in RaCCR2 from Rhodomonas abbreviata (40), but not by Trp, as in KCRs.
Our homology model shows a close proximity of the Trp102 and Tyr222 positions in the extracellular portion of the putative cation pathway within HcKCR1. In WiChR1 and a KCR from the stramenopile Bilabrum (B1ChR2 [25]), the residue corresponding to Tyr222 of HcKCRs is Phe. Both of these KCRs showed higher PK/PNa values than HcKCR1, but the HcKCR1_Y222F mutant exhibited a decrease rather than increase in K+ selectivity (25). Therefore, the Phe-for-Tyr substitution is unlikely responsible for the larger PK/PNa ratio of WiChR1 and B1ChR2 than that of HcKCR1. Several conserved aromatic residues are also found in the pore region of animal voltage-gated K+ channels, and the cation-π interaction has been proposed to contribute to their selectivity (41). A similar mechanism may be at work in microbial KCRs.
Asp116 of HcKCRs corresponds to Asp96 of bacteriorhodopsin, the proton donor during reprotonation of the Schiff base (42). In chlorophyte CCRs, this Asp is replaced with a noncarboxylate residue (His173/His134 in CrChR1/CrChR2), and the CrChR1_H173D mutation completely abolished channel currents (43). In cryptophyte BCCRs, this Asp is conserved as in KCRs. In GtCCR2 (one of the BCCRs), deprotonation of the Asp96 homolog (Asp98) occurs >10-fold faster than reprotonation of the Schiff base and is required for cation channel opening (15). While we were preparing our manuscript for submission, a preprint was published reporting patch clamp analysis of HcKCR1 mutants (25). Its results provide an independent validation of the conclusions drawn in our study. In addition to Ser70, Trp102, and Asp116, described above, mutations of Asp87 and Asn99 also reduced the PK/PNa ratio in HcKCR1 (25), although both of these residues are conserved in Na+-selective HcCCR. High-resolution structures are likely needed to explain this observation.
The PK/PNa ratios of mammalian voltage-gated K+ channels fall within the range of 100 to 1,000 (14), which is higher than that of microbial KCRs. Our identification of the residues required for the K+ selectivity of ChRs is expected to facilitate both bioinformatic searches for potentially highly K+-selective ChR sequences and their molecular engineering to further improve the K+ selectivity. CovKCR1 and CovKCR2, tested in this study, are relatively poor candidates for the development of optogenetic tools, as their PK/PNa ratios are lower than those of HcKCRs and their photocurrents are very small. Nevertheless, these KCRs confirm the importance of the presence of both Trp102 and Tyr222 homologs for K+ selectivity. Also, their source organism, C. vietnamica, is phylogenetically very distant from H. catenoides, which suggests a wide distribution of KCRs in eukaryotic taxa. On the other hand, species attribution of transcripts derived from predatory microorganisms, such as Colponema, should be treated with caution, as there is a possibility of contamination of their transcriptomes with RNA from their food. This occurred, e.g., when ChRmine, the sequence encoded by the Cryptomonas lens genome, was erroneously attributed to the ciliate Tiarina fusus fed on C. lens (as discussed in reference 40).
Intramolecular proton transfers preceding channel currents were detected earlier in some chlorophyte CCRs (30) and cryptophyte BCCRs (15). Several chlorophyte sequences highly homologous to ChRs generate only fast photocurrents reflecting these transfers but show no passive ion conductance upon expression in mammalian cells (1), similar to CabR1 described here. One possible explanation of the lack of channel activity in these proteins observed in heterologous systems is that they are more sensitive to membrane components, e.g., the lipid composition of the membrane, than other ChRs. (1). Only a small fraction of protist rhodopsins have been characterized at any level beyond their primary structure, and further characterization will likely bring many striking discoveries (44). Our results provide the foundation for further elucidating the K+ selection mechanism and for engineering KCRs for optogenetic applications.
MATERIALS AND METHODS
Bioinformatics and molecular biology.
HcKCR homologs were identified by BLAST (BLASTP and TBLASTN) searches of various public databases, using a truncated TM domain amino acid sequence of HcKCR1 (residues 13 to 251) as a query. Specifically, the GILI01001652 and GILI01010992 proteins of C. vietnamica strain Colp-7a were found using NCBI TBLASTN against the Transcriptome Shotgun Assembly (TSA) database limited to the SAR supergroup (taxid 2698737). The KAA0157615 protein of Cafeteria burkhardae strain BVI was found using NCBI BLASTP against the nonredundant (NR) protein database. The metagenomic MATOU-v2.141421879_4, MATOU-v2.32008995_3, MATOU-v2.119411731_5, and TARA_MED_95_MAG_00407_000000002956 proteins were found using BLASTP in the Ocean Gene Atlas (https://tara-oceans.mio.osupytheas.fr/ocean-gene-atlas/) (45, 46). MATOU-v2.141421879_4, MATOU-v2.32008995_3, and MATOU-v2.119411731_5 were extracted from the Marine Atlas of Tara Ocean Unigenes (MATOU [47]) data set, while TARA_MED_95_MAG_00407_000000002956 was found in Tara Oceans Single-Cell and Metagenome Assembled Genomes (EUK-SMAGs [48]) data set. The metagenomic Ga0392354_009429_356_1807, Ga0007756_110676931, and Ga0170791_133102851 proteins were found in the Department of Energy (DOE) Joint Genome Institute (JGI) Integrated Microbial Genomes and Microbiomes (IMG/M) database (49). BLASTP search was used against the respective metatranscriptomes (metatranscriptome of lab enriched marine microbial communities from Marineland, FL, USA, SWA_R2_TP1; metatranscriptome of freshwater lake microbial communities from Lake MI, USA, Su13.BD.MLB.DD; and Northern Canada Lakes metatranscriptome coassembly). Finally, amino acid sequences for Chromera velia proteins Cvel28437, Cvel21397, and Cvel30056 were found in PhycoCosm (https://phycocosm.jgi.doe.gov/Chrveli1/Chrveli1.home.html) (50) using BLASTP against the Chromera_velia 20200809 filtered protein model data set (51). Polynucleotides encoding the 7TM domains of the predicted proteins were optimized for mammalian expression. For expression in HEK293 (human embryonic kidney) cells, these polynucleotides and those encoding H. catenoides ChRs (GenBank accession numbers MZ826861, MZ826862, and OL692497) were cloned into the mammalian expression vector pcDNA3.1 (Life Technologies) in frame with a C-terminal mCherry tag.
The transmembrane helices were predicted using the DeepTMHMM algorithm (52). Sequences were aligned using MegAlign Pro software v. 17.1.1 (DNASTAR Lasergene) with default parameters. Phylogeny was analyzed with IQ-TREE v. 2.1.244 using automatic model selection and ultrafast bootstrap approximation (1,000 replicates) (53). iTOL v. 6.346 was used to visualize and annotate phylogenetic trees.
Homology modeling of HcKCR1 and HcCCR.
We used ColabFold (54) with standard settings to generate, for each protein, five structural models based on multiple-sequence alignments. The predicted local distance difference test (pLDDT) confidence scores (54) of all models were in a relatively narrow range, 80.8 to 82.0 for HcKCR1 and 81.8 to 83.4 for HcCCR. A single structural model was chosen for each protein based on the overall similarity of the scores and the results of manual inspection for details of secondary structure and local interactions. We used the crystal structure of Acetabularia rhodopsin 1 (PDB code 5awz [55]) selected by ColabFold for model building to dock the retinal chromophore and internal water molecules to the ColabFold models by aligning them with the crystal structure of Acetabularia rhodopsin 1 in PyMol. We kept seven internal water molecules for HcKCR1 and six for HcCCR. Coordinates for missing hydrogen atoms were generated with CHARMM (Chemistry at HARvard Molecular Mechanics) (56). The retinal-bound models of HcKCR1 and HcCCR with internal water molecules were subjected to geometry optimizations using the CHARMM potential energy function with CHARMM36 parameters for water (57, 58), TIP3P water model (59), and retinal parameters as described previously (60–62). To optimize the geometry of retinal, water molecules, and protein groups within 3.5 Å of retinal and water, we fixed the coordinates of the heavy atoms of all other protein side chains: on the heavy atoms of the mobile groups, we initially placed harmonic constraints of 10 kcal mol−1 Å−2 and energy optimized to a gradient of 0.1 kcal mol−1 Å−2; we lowered the harmonic constraints first to 1.0 kcal mol−1 Å−2 and then to 0.1 kcal mol−1 Å−2, each time performing a new energy optimization to a gradient of 0.1 kcal mol−1 Å−2. All harmonic constraints were then switched off and an additional energy optimization step was applied.
Whole-cell patch clamp recording from HEK293 cells.
No cell lines from the list of known misidentified cell lines maintained by the International Cell Line Authentication Committee were used in this study. The HEK293 cells, from the American Type Culture Collection (ATCC), were grown in 2-cm-diameter plastic dishes and transfected with 10 μL of ScreenFectA transfection reagent (Waco Chemicals USA, Richmond, VA, USA) using 3 μg of DNA per dish. Immediately after transfection, all-trans-retinal (Sigma) was added at a final concentration of 5 μM. Patch pipettes with resistances of 2 to 3 MΩ were fabricated from borosilicate glass. Whole-cell voltage clamp recordings were performed with an Axopatch 200B amplifier (Molecular Devices) using the solutions, full composition of which is shown in Table S1, and a 4 M salt bridge. All measurements were carried out at room temperature (25°C). The signals were digitized with a Digidata 1440A controlled by pClampEx 10.7 software (both from Molecular Devices). All current-voltage curves (IV dependencies) were corrected for liquid junction potentials (LJP) calculated using the ClampEx built-in LJP calculator (Table S1). A Polychrome IV light source (T.I.L.L. Photonics GmbH) in combination with a mechanical shutter (Uniblitz model LS6; Vincent Associates; half-opening time, 0.5 ms) was used as the light source (maximal light power values at the focal plane of the 40× lens objective for all wavelengths used in this study are provided in Table S2). The action spectra were constructed using the initial slope of photocurrent in the linear range of the dependence on the quantum density (<25 μW mm−2), corrected for the quantum density measured at each wavelength and normalized to the maximal value. ClampFit 10.7 was used for initial analysis of the recorded data, followed by further analysis by Origin Pro 2016 software (OriginLab Corporation). The data points shown in the graphs are connected with spline or B-spline lines, unless otherwise stated.
Maximal light power values for all excitation wavelengths used in this study. Download Table S2, DOCX file, 0.01 MB (13.5KB, docx) .
Copyright © 2022 Govorunova et al.
This content is distributed under the terms of the Creative Commons Attribution 4.0 International license.
Statistics and reproducibility.
Identical batches of HEK293 cell culture were randomly assigned for transfection with each tested construct. At least two separate batches of culture were transfected independently with each construct. Individual transfected cells were selected for patching by inspecting their tag fluorescence. Nonfluorescent cells or cells in which no GΩ seal could be established were not sampled. Only one photocurrent trace per cell was recorded, and traces recorded from different cells transfected with the same construct were considered biological replicates (reported as n values). Statistical analysis was performed using Origin Pro 2016 software. The data are presented as mean values ± SEMs; the data from individual cells are also shown when appropriate. Normal distribution of the data was checked using the Kolmogorov-Smirnov test. Specific statistical hypotheses were tested using the two-tailed paired-sample Wilcoxon signed-rank test (Fig. 1D), one-way analysis of variance (ANOVA) followed by the Tukey test for means comparison (Fig. 2B and D), and the two-tailed Mann-Whitney test (the data on the wild-type HcKCR2 and its V73I mutant are in the text) as implemented in Origin. The complete results of hypothesis testing (including the exact numbers of cells tested for each variant and the exact P values) are provided in Data Set S4.
Data availability.
The polynucleotide sequences of KCR homologs reported in this study have been deposited in GenBank (accession numbers OP121639 to OP121651). The numerical values of the data shown in Fig. 1, 2, and 4 are provided in Data Set S1.
ACKNOWLEDGMENTS
We thank Oded Béjà (Technion-Israel Institute of Technology, Haifa, Israel) for sharing with us the protein sequence information of WiChR1 and B1ChR2 prior to peer-reviewed publication, Matthias Fischer (Max Planck Institute for Medical Research, Heidelberg, Germany) for the species attribution of the KAA0157615 sequence, and Oliver P. Ernst (University of Toronto, Canada) for critical reading of the manuscript. We also thank Hai Li from the Spudich lab for helpful discussions and Yumei Wang for technical assistance.
This work was supported by National Institutes of Health grants R35GM140838 and U01NS118288 (J.L.S.), Robert A. Welch Foundation Endowed Chair AU-0009 (J.L.S.), and Natural Sciences and Engineering Research Council of Canada Discovery Grant RGPIN-2018-04397 (L.S.B.). The funders had no role in study design, data collection and analysis, decision to publish, or preparation of the manuscript.
We declare no conflict of interest.
Footnotes
This article is a direct contribution from John L. Spudich, a Fellow of the American Academy of Microbiology, who arranged for and secured reviews by Mark Gomelsky, University of Wyoming, and Edward Boyden, Massachusetts Institute of Technology.
Contributor Information
John L. Spudich, Email: john.l.spudich@uth.tmc.edu.
Wayne A. Hendrickson, Columbia University
REFERENCES
- 1.Govorunova EG, Sineshchekov OA, Li H, Wang Y, Brown LS, Palmateer A, Melkonian M, Cheng S, Carpenter E, Patterson J, Wong GKS, Spudich JL. 2021. Cation and anion channelrhodopsins: sequence motifs and taxonomic distribution. mBio 12:e01656-21. doi: 10.1128/mBio.01656-21. [DOI] [PMC free article] [PubMed] [Google Scholar]
- 2.Deisseroth K, Hegemann P. 2017. The form and function of channelrhodopsin. Science 357:eaan5544. doi: 10.1126/science.aan5544. [DOI] [PMC free article] [PubMed] [Google Scholar]
- 3.Govorunova EG, Sineshchekov OA, Li H, Spudich JL. 2017. Microbial rhodopsins: diversity, mechanisms, and optogenetic applications. Annu Rev Biochem 86:845–872. doi: 10.1146/annurev-biochem-101910-144233. [DOI] [PMC free article] [PubMed] [Google Scholar]
- 4.Rozenberg A, Inoue K, Kandori H, Béjà O. 2021. Microbial rhodopsins: the last two decades. Annu Rev Microbiol 75:427–447. doi: 10.1146/annurev-micro-031721-020452. [DOI] [PubMed] [Google Scholar]
- 5.Gordeliy V, Kovalev K, Bamberg E, Rodriguez-Valera F, Zinovev E, Zabelskii D, Alekseev A, Rosselli R, Gushchin I, Okhrimenko I. 2022. Microbial rhodopsins. Methods Mol Biol 2501:1–52. doi: 10.1007/978-1-0716-2329-9_1. [DOI] [PubMed] [Google Scholar]
- 6.Sineshchekov OA, Jung K-H, Spudich JL. 2002. Two rhodopsins mediate phototaxis to low- and high-intensity light in Chlamydomonas reinhardtii. Proc Natl Acad Sci USA 99:8689–8694. doi: 10.1073/pnas.122243399. [DOI] [PMC free article] [PubMed] [Google Scholar]
- 7.Zabelskii D, Alekseev A, Kovalev K, Rankovic V, Balandin T, Soloviov D, Bratanov D, Savelyeva E, Podolyak E, Volkov D, Vaganova S, Astashkin R, Chizhov I, Yutin N, Rulev M, Popov A, Eria-Oliveira AS, Rokitskaya T, Mager T, Antonenko Y, Rosselli R, Armeev G, Shaitan K, Vivaudou M, Buldt G, Rogachev A, Rodriguez-Valera F, Kirpichnikov M, Moser T, Offenhausser A, Willbold D, Koonin E, Bamberg E, Gordeliy V. 2020. Viral rhodopsins 1 are an unique family of light-gated cation channels. Nat Commun 11:5707. doi: 10.1038/s41467-020-19457-7. [DOI] [PMC free article] [PubMed] [Google Scholar]
- 8.Rozenberg A, Oppermann J, Wietek J, Fernandez Lahore RG, Sandaa RA, Bratbak G, Hegemann P, Béjà O. 2020. Lateral gene transfer of anion-conducting channelrhodopsins between green algae and giant viruses. Curr Biol 30:4910–4920.e5. doi: 10.1016/j.cub.2020.09.056. [DOI] [PubMed] [Google Scholar]
- 9.Govorunova EG, Sineshchekov OA, Liu X, Janz R, Spudich JL. 2015. Natural light-gated anion channels: a family of microbial rhodopsins for advanced optogenetics. Science 349:647–650. doi: 10.1126/science.aaa7484. [DOI] [PMC free article] [PubMed] [Google Scholar]
- 10.Nagel G, Szellas T, Huhn W, Kateriya S, Adeishvili N, Berthold P, Ollig D, Hegemann P, Bamberg E. 2003. Channelrhodopsin-2, a directly light-gated cation-selective membrane channel. Proc Natl Acad Sci USA 100:13940–13945. doi: 10.1073/pnas.1936192100. [DOI] [PMC free article] [PubMed] [Google Scholar]
- 11.Boyden ES, Zhang F, Bamberg E, Nagel G, Deisseroth K. 2005. Millisecond-timescale, genetically targeted optical control of neural activity. Nat Neurosci 8:1263–1268. doi: 10.1038/nn1525. [DOI] [PubMed] [Google Scholar]
- 12.Govorunova EG, Gou Y, Sineshchekov OA, Li H, Lu X, Wang Y, Brown LS, St-Pierre F, Xue M, Spudich JL. 2022. Kalium channelrhodopsins are natural light-gated potassium channels that mediate optogenetic inhibition. Nat Neurosci 25:967–974. doi: 10.1038/s41593-022-01094-6. [DOI] [PMC free article] [PubMed] [Google Scholar]
- 13.MacKinnon R. 2003. Potassium channels. FEBS Lett 555:62–65. doi: 10.1016/s0014-5793(03)01104-9. [DOI] [PubMed] [Google Scholar]
- 14.Mironenko A, Zachariae U, de Groot BL, Kopec W. 2021. The persistent question of potassium channel permeation mechanisms. J Mol Biol 433:167002. doi: 10.1016/j.jmb.2021.167002. [DOI] [PubMed] [Google Scholar]
- 15.Sineshchekov OA, Govorunova EG, Li H, Spudich JL. 2017. Bacteriorhodopsin-like channelrhodopsins: alternative mechanism for control of cation conductance. Proc Natl Acad Sci USA 114:E9512–E9519. doi: 10.1073/pnas.1710702114. [DOI] [PMC free article] [PubMed] [Google Scholar]
- 16.Kishi KE, Kim YS, Fukuda M, Inoue M, Kusakizako T, Wang PY, Ramakrishnan C, Byrne EFX, Thadhani E, Paggi JM, Matsui TE, Yamashita K, Nagata T, Konno M, Quirin S, Lo M, Benster T, Uemura T, Liu K, Shibata M, Nomura N, Iwata S, Nureki O, Dror RO, Inoue K, Deisseroth K, Kato HE. 2022. Structural basis for channel conduction in the pump-like channelrhodopsin ChRmine. Cell 185:672–689.e23. doi: 10.1016/j.cell.2022.01.007. [DOI] [PMC free article] [PubMed] [Google Scholar]
- 17.Tucker K, Sridharan S, Adesnik H, Brohawn SG. 2022. Cryo-EM structures of the channelrhodopsin ChRmine in lipid nanodiscs. Nat Commun 13:4842. doi: 10.1038/s41467-022-32441-7. [DOI] [PMC free article] [PubMed] [Google Scholar]
- 18.Henderson R, Unwin P. 1975. Three-dimensional model of purple membrane obtained by electron microscopy. Nature 257:28–32. doi: 10.1038/257028a0. [DOI] [PubMed] [Google Scholar]
- 19.Kato HE, Zhang F, Yizhar O, Ramakrishnan C, Nishizawa T, Hirata K, Ito J, Aita Y, Tsukazaki T, Hayashi S, Hegemann P, Maturana AD, Ishitani R, Deisseroth K, Nureki O. 2012. Crystal structure of the channelrhodopsin light-gated cation channel. Nature 482:369–374. doi: 10.1038/nature10870. [DOI] [PMC free article] [PubMed] [Google Scholar]
- 20.Li H, Huang CY, Govorunova EG, Schafer CT, Sineshchekov OA, Wang M, Zheng L, Spudich JL. 2019. Crystal structure of a natural light-gated anion channelrhodopsin. Elife 8:e41741. doi: 10.7554/eLife.41741. [DOI] [PMC free article] [PubMed] [Google Scholar]
- 21.Leonard G, Labarre A, Milner DS, Monier A, Soanes D, Wideman JG, Maguire F, Stevens S, Sain D, Grau-Bove X, Sebe-Pedros A, Stajich JE, Paszkiewicz K, Brown MW, Hall N, Wickstead B, Richards TA. 2018. Comparative genomic analysis of the ‘pseudofungus’ Hyphochytrium catenoides. Open Biol 8:170184. doi: 10.1098/rsob.170184. [DOI] [PMC free article] [PubMed] [Google Scholar]
- 22.Govorunova EG, Sineshchekov OA, Brown LS, Spudich JL. 2022. Biophysical characterization of light-gated ion channels using planar automated patch clamp. Front Mol Neurosci 15:976910. doi: 10.3389/fnmol.2022.976910. [DOI] [PMC free article] [PubMed] [Google Scholar]
- 23.Hille B. 2001. Ion channels of excitable membranes. Sinauer Associates, Sunderland, MA. [Google Scholar]
- 24.Richards R, Dempski RE. 2012. Re-introduction of transmembrane serine residues reduce the minimum pore diameter of channelrhodopsin-2. PLoS One 7:e50018. doi: 10.1371/journal.pone.0050018. [DOI] [PMC free article] [PubMed] [Google Scholar]
- 25.Vierock J, Peter E, Grimm C, Rozenberg A, Castro Scalise AG, Augustin S, Tanese D, Forget BC, Emiliani V, Béjà O, Hegemann P. 2022. WiChR, a highly potassium selective channelrhodopsin for low-light two-photon neuronal inhibition. bioRxiv. doi: 10.1101/2022.07.02.498568. [DOI] [PMC free article] [PubMed]
- 26.Otto H, Marti T, Holz M, Mogi T, Stern LJ, Engel F, Khorana HG, Heyn MP. 1990. Substitution of amino acids Asp-85, Asp-212, and Arg-82 in bacteriorhodopsin affects the proton release phase of the pump and the pK of the Schiff base. Proc Natl Acad Sci USA 87:1018–1022. doi: 10.1073/pnas.87.3.1018. [DOI] [PMC free article] [PubMed] [Google Scholar]
- 27.Dolinsky TJ, Czodrowski P, Li H, Nielsen JE, Jensen JH, Klebe G, Baker NA. 2007. PDB2PQR: expanding and upgrading automated preparation of biomolecular structures for molecular simulations. Nucleic Acids Res 35:W522–W525. doi: 10.1093/nar/gkm276. [DOI] [PMC free article] [PubMed] [Google Scholar]
- 28.Tikhonenkov DV, Janouskovec J, Mylnikov AP, Mikhailov KV, Simdyanov TG, Aleoshin VV, Keeling PJ. 2014. Description of Colponema vietnamica sp.n. and Acavomonas peruviana n. gen. n. sp., two new alveolate phyla (Colponemidia nom. nov. and Acavomonidia nom. nov.) and their contributions to reconstructing the ancestral state of alveolates and eukaryotes. PLoS One 9:e95467. doi: 10.1371/journal.pone.0095467. [DOI] [PMC free article] [PubMed] [Google Scholar]
- 29.Moore RB, Obornik M, Janouskovec J, Chrudimsky T, Vancova M, Green DH, Wright SW, Davies NW, Bolch CJ, Heimann K, Slapeta J, Hoegh-Guldberg O, Logsdon JM, Carter DA. 2008. A photosynthetic alveolate closely related to apicomplexan parasites. Nature 451:959–963. doi: 10.1038/nature06635. [DOI] [PubMed] [Google Scholar]
- 30.Sineshchekov OA, Govorunova EG, Wang J, Li H, Spudich JL. 2013. Intramolecular proton transfer in channelrhodopsins. Biophys J 104:807–817. doi: 10.1016/j.bpj.2013.01.002. [DOI] [PMC free article] [PubMed] [Google Scholar]
- 31.Emiliani V, Entcheva E, Hedrich R, Hegemann P, Konrad KR, Lüscher C, Mahn M, Pan Z-H, Sims RR, Vierock J, Yizhar O. 2022. Optogenetics for light control of biological systems. Nat Rev Methods Primers 2:55. doi: 10.1038/s43586-022-00136-4. [DOI] [PMC free article] [PubMed] [Google Scholar]
- 32.Sahel JA, Boulanger-Scemama E, Pagot C, Arleo A, Galluppi F, Martel JN, Esposti SD, Delaux A, de Saint Aubert JB, de Montleau C, Gutman E, Audo I, Duebel J, Picaud S, Dalkara D, Blouin L, Taiel M, Roska B. 2021. Partial recovery of visual function in a blind patient after optogenetic therapy. Nat Med 27:1223–1229. doi: 10.1038/s41591-021-01351-4. [DOI] [PubMed] [Google Scholar]
- 33.Krause N, Engelhard C, Heberle J, Schlesinger R, Bittl R. 2013. Structural differences between the closed and open states of channelrhodopsin-2 as observed by EPR spectroscopy. FEBS Lett 587:3309–3313. doi: 10.1016/j.febslet.2013.08.043. [DOI] [PubMed] [Google Scholar]
- 34.Sattig T, Rickert C, Bamberg E, Steinhoff HJ, Bamann C. 2013. Light-induced movement of the transmembrane helix B in channelrhodopsin-2. Angew Chem Int Ed Engl 52:9705–9708. doi: 10.1002/anie.201301698. [DOI] [PubMed] [Google Scholar]
- 35.Müller M, Bamann C, Bamberg E, Kuhlbrandt W. 2015. Light-induced helix movements in channelrhodopsin-2. J Mol Biol 427:341–349. doi: 10.1016/j.jmb.2014.11.004. [DOI] [PubMed] [Google Scholar]
- 36.Li H, Huang C-Y, Govorunova EG, Sineshchekov OA, Yi A, Rothschild KJ, Wang M, Zheng L, Spudich JL. 2021. The crystal structure of bromide-bound GtACR1 reveals a pre-activated state in the transmembrane anion tunnel. Elife 10:e65903. doi: 10.7554/eLife.65903. [DOI] [PMC free article] [PubMed] [Google Scholar]
- 37.Brown LS, Gat Y, Sheves M, Yamazaki Y, Maeda A, Needleman R, Lanyi JK. 1994. The retinal Schiff base-counterion complex of bacteriorhodopsin: changed geometry during the photocycle is a cause of proton transfer to aspartate 85. Biochemistry 33:12001–12011. doi: 10.1021/bi00206a001. [DOI] [PubMed] [Google Scholar]
- 38.Wietek J, Wiegert JS, Adeishvili N, Schneider F, Watanabe H, Tsunoda SP, Vogt A, Elstner M, Oertner TG, Hegemann P. 2014. Conversion of channelrhodopsin into a light-gated chloride channel. Science 344:409–412. doi: 10.1126/science.1249375. [DOI] [PubMed] [Google Scholar]
- 39.Vogt A, Silapetere A, Grimm C, Heiser F, Ancina Moller M, Hegemann P. 2019. Engineered passive potassium conductance in the KR2 sodium pump. Biophys J 116:1941–1951. doi: 10.1016/j.bpj.2019.04.001. [DOI] [PMC free article] [PubMed] [Google Scholar]
- 40.Sineshchekov OA, Govorunova EG, Li H, Wang Y, Melkonian M, Wong GK-S, Brown LS, Spudich JL. 2020. Conductance mechanisms of rapidly desensitizing cation channelrhodopsins from cryptophyte algae. mBio 11:e00657-20. doi: 10.1128/mBio.00657-20. [DOI] [PMC free article] [PubMed] [Google Scholar]
- 41.Kumpf RA, Dougherty DA. 1993. A mechanism for ion selectivity in potassium channels: computational studies of cation-pi interactions. Science 261:1708–1710. doi: 10.1126/science.8378771. [DOI] [PubMed] [Google Scholar]
- 42.Otto H, Marti T, Holz M, Mogi T, Lindau M, Khorana HG, Heyn MP. 1989. Aspartic acid-96 is the internal proton donor in the reprotonation of the Schiff base of bacteriorhodopsin. Proc Natl Acad Sci USA 86:9228–9232. doi: 10.1073/pnas.86.23.9228. [DOI] [PMC free article] [PubMed] [Google Scholar]
- 43.Nagel G, Ollig D, Fuhrmann M, Kateriya S, Musti AM, Bamberg E, Hegemann P. 2002. Channelrhodopsin-1: a light-gated proton channel in green algae. Science 296:2395–2398. doi: 10.1126/science.1072068. [DOI] [PubMed] [Google Scholar]
- 44.Rozenberg A, Kaczmarczyk I, Matzov D, Vierock J, Nagata T, Sugiura M, Katayama K, Kawasaki Y, Konno M, Nagasaka Y, Aoyama M, Das I, Pahima E, Church J, Adam S, Borin VA, Chazan A, Augustin S, Wietek J, Dine J, Peleg Y, Kawanabe A, Fujiwara Y, Yizhar O, Sheves M, Schapiro I, Furutani Y, Kandori H, Inoue K, Hegemann P, Béjà O, Shalev-Benami M. 2022. Rhodopsin-bestrophin fusion proteins from unicellular algae form gigantic pentameric ion channels. Nat Struct Mol Biol 29:592–603. doi: 10.1038/s41594-022-00783-x. [DOI] [PubMed] [Google Scholar]
- 45.Villar E, Vannier T, Vernette C, Lescot M, Cuenca M, Alexandre A, Bachelerie P, Rosnet T, Pelletier E, Sunagawa S, Hingamp P. 2018. The Ocean Gene Atlas: exploring the biogeography of plankton genes online. Nucleic Acids Res 46:W289–W295. doi: 10.1093/nar/gky376. [DOI] [PMC free article] [PubMed] [Google Scholar]
- 46.Vernette C, Lecubin J, Sanchez P, Tara Oceans C, Sunagawa S, Delmont TO, Acinas SG, Pelletier E, Hingamp P, Lescot M. 2022. The Ocean Gene Atlas v2.0: online exploration of the biogeography and phylogeny of plankton genes. Nucleic Acids Res 50:W516–W526. doi: 10.1093/nar/gkac420. [DOI] [PMC free article] [PubMed] [Google Scholar]
- 47.Carradec Q, Pelletier E, Da Silva C, Alberti A, Seeleuthner Y, Blanc-Mathieu R, Lima-Mendez G, Rocha F, Tirichine L, Labadie K, Kirilovsky A, Bertrand A, Engelen S, Madoui MA, Meheust R, Poulain J, Romac S, Richter DJ, Yoshikawa G, Dimier C, Kandels-Lewis S, Picheral M, Searson S, Tara Oceans C, Jaillon O, Aury JM, Karsenti E, Sullivan MB, Sunagawa S, Bork P, Not F, Hingamp P, Raes J, Guidi L, Ogata H, de Vargas C, Iudicone D, Bowler C, Wincker P, Tara Oceans Coordinators . 2018. A global ocean atlas of eukaryotic genes. Nat Commun 9:373. doi: 10.1038/s41467-017-02342-1. [DOI] [PMC free article] [PubMed] [Google Scholar]
- 48.Delmont TO, Gaia M, Hinsinger DD, Fremont P, Vanni C, Guerra AF, Eren AM, Kourlaiev A, d’Agata L, Clayssen Q, Villar E, Labadie K, Cruaud C, Poulain J, Da Silva C, Wessner M, Noel B, Aury J-M, de Vargas C, Bowler C, Karsenti E, Pelletier E, Wincker P, Jaillon O. 2021. Functional repertoire convergence of distantly related eukaryotic plankton lineages revealed by genome-resolved metagenomics. bioRxiv. doi: 10.1101/2020.10.15.341214. [DOI] [PMC free article] [PubMed]
- 49.Chen IA, Chu K, Palaniappan K, Ratner A, Huang J, Huntemann M, Hajek P, Ritter S, Varghese N, Seshadri R, Roux S, Woyke T, Eloe-Fadrosh EA, Ivanova NN, Kyrpides NC. 2021. The IMG/M data management and analysis system v.6.0: new tools and advanced capabilities. Nucleic Acids Res 49:D751–D763. doi: 10.1093/nar/gkaa939. [DOI] [PMC free article] [PubMed] [Google Scholar]
- 50.Grigoriev IV, Hayes RD, Calhoun S, Kamel B, Wang A, Ahrendt S, Dusheyko S, Nikitin R, Mondo SJ, Salamov A, Shabalov I, Kuo A. 2021. PhycoCosm, a comparative algal genomics resource. Nucleic Acids Res 49:D1004–D1011. doi: 10.1093/nar/gkaa898. [DOI] [PMC free article] [PubMed] [Google Scholar]
- 51.Woo YH, Ansari H, Otto TD, Klinger CM, Kolisko M, Michálek J, Saxena A, Shanmugam D, Tayyrov A, Veluchamy A, Ali S, Bernal A, del Campo J, Cihlář J, Flegontov P, Gornik SG, Hajdušková E, Horák A, Janouškovec J, Katris NJ, Mast FD, Miranda-Saavedra D, Mourier T, Naeem R, Nair M, Panigrahi AK, Rawlings ND, Padron-Regalado E, Ramaprasad A, Samad N, Tomčala A, Wilkes J, Neafsey DE, Doerig C, Bowler C, Keeling PJ, Roos DS, Dacks JB, Templeton TJ, Waller RF, Lukeš J, Oborník M, Pain A. 2015. Chromerid genomes reveal the evolutionary path from photosynthetic algae to obligate intracellular parasites. Elife 4:e06974. doi: 10.7554/eLife.06974. [DOI] [PMC free article] [PubMed] [Google Scholar]
- 52.Hallgren J, Tsirigos KD, Pedersen MD, Almagro Armenteros JJ, Marcatili P, Nielsen H, Krogh A, Winther O. 2022. DeepTMHMM predicts alpha and beta transmembrane proteins using deep neural networks. bioRxiv. doi: 10.1101/2022.04.08.487609. [DOI]
- 53.Minh BQ, Schmidt HA, Chernomor O, Schrempf D, Woodhams MD, von Haeseler A, Lanfear R. 2020. IQ-TREE 2: new models and efficient methods for phylogenetic inference in the genomic era. Mol Biol Evol 37:1530–1534. doi: 10.1093/molbev/msaa015. [DOI] [PMC free article] [PubMed] [Google Scholar]
- 54.Mirdita M, Schutze K, Moriwaki Y, Heo L, Ovchinnikov S, Steinegger M. 2022. ColabFold: making protein folding accessible to all. Nat Methods 19:679–682. doi: 10.1038/s41592-022-01488-1. [DOI] [PMC free article] [PubMed] [Google Scholar]
- 55.Furuse M, Tamogami J, Hosaka T, Kikukawa T, Shinya N, Hato M, Ohsawa N, Kim SY, Jung KH, Demura M, Miyauchi S, Kamo N, Shimono K, Kimura-Someya T, Yokoyama S, Shirouzu M. 2015. Structural basis for the slow photocycle and late proton release in Acetabularia rhodopsin I from the marine plant Acetabularia acetabulum. Acta Crystallogr D Biol Crystallogr 71:2203–2216. doi: 10.1107/S1399004715015722. [DOI] [PubMed] [Google Scholar]
- 56.Brooks BR, Bruccoleri RE, Olafson BD, States DJ, Swaminathan S, Karplus M. 1983. CHARMM: a program for macromolecular energy, minimization, and dynamics calculations. J Comput Chem 4:187–217. doi: 10.1002/jcc.540040211. [DOI] [Google Scholar]
- 57.MacKerell AD, Bashford D, Bellott M, Dunbrack RL, Evanseck JD, Field MJ, Fischer S, Gao J, Guo H, Ha S, Joseph-McCarthy D, Kuchnir L, Kuczera K, Lau FT, Mattos C, Michnick S, Ngo T, Nguyen DT, Prodhom B, Reiher WE, Roux B, Schlenkrich M, Smith JC, Stote R, Straub J, Watanabe M, Wiorkiewicz-Kuczera J, Yin D, Karplus M. 1998. All-atom empirical potential for molecular modeling and dynamics studies of proteins. J Phys Chem B 102:3586–3616. doi: 10.1021/jp973084f. [DOI] [PubMed] [Google Scholar]
- 58.Mackerell AD, Jr, Feig M, Brooks CL, III.. 2004. Extending the treatment of backbone energetics in protein force fields: limitations of gas-phase quantum mechanics in reproducing protein conformational distributions in molecular dynamics simulations. J Comput Chem 25:1400–1415. doi: 10.1002/jcc.20065. [DOI] [PubMed] [Google Scholar]
- 59.Jorgensen WL, Chandrasekhar J, Madura JD, Impey RW, Klein ML. 1983. Comparison of simple potential functions for simulating liquid water. J Chem Phys 79:926–935. doi: 10.1063/1.445869. [DOI] [Google Scholar]
- 60.Nina M, Roux B, Smith JC. 1995. Functional interactions in bacteriorhodopsin: a theoretical analysis of retinal hydrogen bonding with water. Biophys J 68:25–39. doi: 10.1016/S0006-3495(95)80184-0. [DOI] [PMC free article] [PubMed] [Google Scholar]
- 61.Tajkhorshid E, Baudry J, Schulten K, Suhai S. 2000. Molecular dynamics study of the nature and origin of retinal’s twisted structure in bacteriorhodopsin. Biophys J 78:683–693. doi: 10.1016/S0006-3495(00)76626-4. [DOI] [PMC free article] [PubMed] [Google Scholar]
- 62.Gruia AD, Bondar AN, Smith JC, Fischer S. 2005. Mechanism of a molecular valve in the halorhodopsin chloride pump. Structure 13:617–627. doi: 10.1016/j.str.2005.01.021. [DOI] [PubMed] [Google Scholar]
Associated Data
This section collects any data citations, data availability statements, or supplementary materials included in this article.
Supplementary Materials
Electrophysiological characterization of WiChR1. (A) Series of photocurrent traces recorded upon incremental voltage with 130 mM Na+ in the bath and 130 mM K+ in the pipette. The duration of the light pulse is shown by the green bars. (C) Peak current-voltage relationships of WiChR1. Black, mean ± SEM (n = 7 cells); gray, data from individual cells. For two cells in which the photocurrent at the positive voltages exceeded the dynamic range of the amplifier (20 nA), the peak values were obtained by fitting of a sigmoidal (dose-response) function to the data. The red arrow points to the reversal potential. Download FIG S1, TIF file, 0.2 MB (233.4KB, tif) .
Copyright © 2022 Govorunova et al.
This content is distributed under the terms of the Creative Commons Attribution 4.0 International license.
Solution compositions for whole-cell patch clamp recording. LJP, liquid junction potential. All concentrations are millimolar. Download Table S1, DOCX file, 0.01 MB (13.4KB, docx) .
Copyright © 2022 Govorunova et al.
This content is distributed under the terms of the Creative Commons Attribution 4.0 International license.
Numerical data shown in Fig. 1C to F, Fig. 2B, D, and E, and Fig. 4D to G in the main text. Download Data Set S1, XLSX file, 0.02 MB (21.7KB, xlsx) .
Copyright © 2022 Govorunova et al.
This content is distributed under the terms of the Creative Commons Attribution 4.0 International license.
Full statistical analysis of the data shown in Fig. 1D and 2B and D and in the text. Download Data Set S2, PDF file, 0.2 MB (208.3KB, pdf) .
Copyright © 2022 Govorunova et al.
This content is distributed under the terms of the Creative Commons Attribution 4.0 International license.
(A) Protein alignment of 7TM domains of H. catenoides ChRs. The residues are shaded according to the degree of conservation. The numbers on the right are those of the last residue in each line. The red boxes show predicted transmembrane helices. (B) Protein alignment of the HcKCR1_HcCCR chimeras tested in this study. The residues are shaded according to the degree of conservation. The numbers on the right are those of the last residue in each line. Download FIG S2, TIF file, 2.3 MB (2.3MB, tif) .
Copyright © 2022 Govorunova et al.
This content is distributed under the terms of the Creative Commons Attribution 4.0 International license.
(A) Peak current-voltage relationships of the HcKCR1_HcCCR chimeras. Black, mean ± SEM (n = 7 to 10 cells); gray, data from individual cells. The red arrows point to the reversal potentials. (B) Peak current-voltage relationships of the HcCCR mutants. Black, mean ± SEM (n = 5 to 8 cells); gray, data from individual cells. The red arrows point to the reversal potentials. Download FIG S3, TIF file, 2.7 MB (2.7MB, tif) .
Copyright © 2022 Govorunova et al.
This content is distributed under the terms of the Creative Commons Attribution 4.0 International license.
Characterization of Trp102 and Asp116 mutants of HcKCR1 and HcKCR2. (Left) Series of photocurrent traces recorded upon incremental voltage with 130 mM Na+ in the bath and 130 mM K+ in the pipette. The duration of the light pulse is shown by the green bars. (Right) Peak current-voltage relationships. Black, mean ± SEM (n = 7 or 8 cells); gray, data from individual cells. The red arrows point to the reversal potentials. Download FIG S4, TIF file, 0.4 MB (455.1KB, tif) .
Copyright © 2022 Govorunova et al.
This content is distributed under the terms of the Creative Commons Attribution 4.0 International license.
Protein alignment of 7TM domains of KCR homologs tested in this study. The residues are shaded according to the degree of conservation. In the C. velia sequences, the residues corresponding to Asp85 of bacteriorhodopsin are highlighted yellow, and the residues corresponding to Thr89 of bacteriorhodopsin are highlighted red. The numbers on the right are those of the last residue in each line. Download FIG S5, TIF file, 1.0 MB (1MB, tif) .
Copyright © 2022 Govorunova et al.
This content is distributed under the terms of the Creative Commons Attribution 4.0 International license.
(A) Characterization of KCR homologs with 130 mM Na+ in the bath. (Left) series of photocurrent traces recorded upon incremental voltage. The duration of the light pulse is shown by the colored bars. (Middle) Peak current-voltage relationships. Black, mean ± SEM (n = 6 to 9 cells); gray, data from individual cells. (Right) Action spectra of the photocurrents (mean ± SEM [n = 6 to 10 cells]). The red arrows point to the reversal potentials. (B) Characterization of KCR homologs with 130 mM NMDG+ in the bath. (Left) Series of photocurrent traces recorded upon incremental voltage. The duration of the light pulse is shown by the colored bars. (Right) Peak current-voltage relationships. Black, mean ± SEM (n = 6 or 7 cells); gray, data from individual cells. The red arrows point to the reversal potentials. (C) Characterization of KCR homologs with 130 mM K+ in the bath (pH 9.4). (Left) Series of photocurrent traces recorded upon incremental voltage. The duration of the light pulse is shown by the colored bars. (Right) Corresponding peak current-voltage relationships. The red arrows point to the reversal potentials. Download FIG S6, TIF file, 0.8 MB (837.7KB, tif) .
Copyright © 2022 Govorunova et al.
This content is distributed under the terms of the Creative Commons Attribution 4.0 International license.
Maximal light power values for all excitation wavelengths used in this study. Download Table S2, DOCX file, 0.01 MB (13.5KB, docx) .
Copyright © 2022 Govorunova et al.
This content is distributed under the terms of the Creative Commons Attribution 4.0 International license.
Data Availability Statement
The polynucleotide sequences of KCR homologs reported in this study have been deposited in GenBank (accession numbers OP121639 to OP121651). The numerical values of the data shown in Fig. 1, 2, and 4 are provided in Data Set S1.