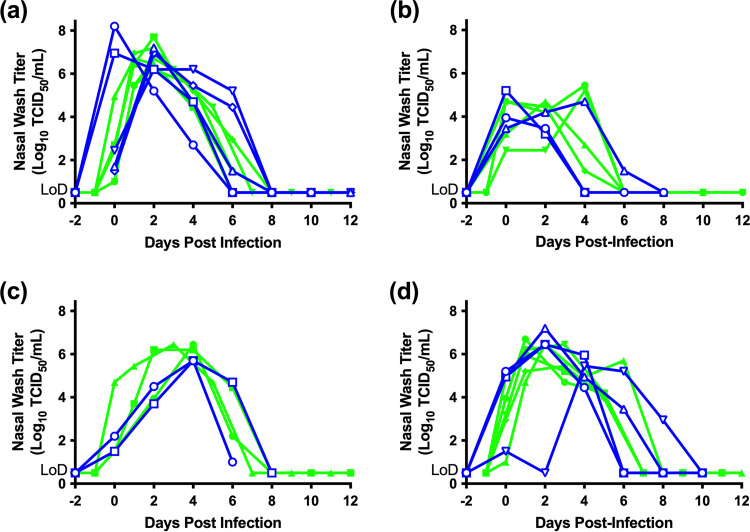
FIG 6.
Superimposed viral shedding curves for infected RC1 and RC2 animals. Displayed are nasal wash titers from the RC1 and RC2 ferrets for a given virus. The shedding curves have been normalized such that day 0 is the first day virus was detected by culture from the animals. Each panel displays the kinetics of viral replication in nasal washes from RC1 (green) and RC2 (blue) animals that shed virus for A/California/07/2009 (H1N1 pdm09) (a), A/Texas/50/2012 (H3N2) (b), A/Anhui/1/2013 (H7N9) (c), and A/seal/New Hampshire/179629/2011 (H3N8) (d) viruses, respectively. LoD denotes the limit of detection (0.5 × log [TCID50/mL]).

