

Abstract
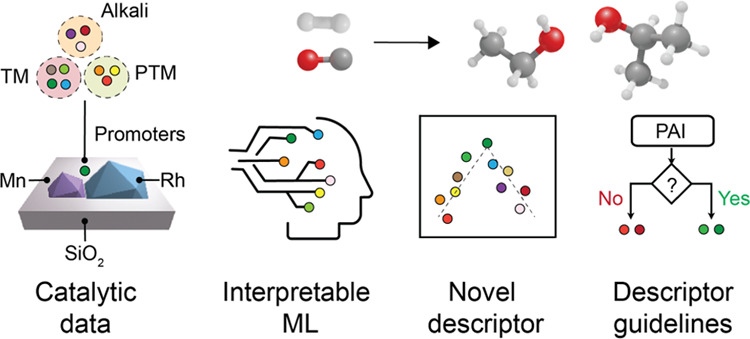
Rhodium-based catalysts offer remarkable selectivities toward higher alcohols, specifically ethanol, via syngas conversion. However, the addition of metal promoters is required to increase reactivity, augmenting the complexity of the system. Herein, we present an interpretable machine learning (ML) approach to predict and rationalize the performance of Rh-Mn-P/SiO2 catalysts (P = 19 promoters) using the open-source dataset on Rh-catalyzed higher alcohol synthesis (HAS) from Pacific Northwest National Laboratory (PNNL). A random forest model trained on this dataset comprising 19 alkali, transition, post-transition metals, and metalloid promoters, using catalytic descriptors and reaction conditions, predicts the higher alcohols space-time yield (STYHA) with an accuracy of R2 = 0.76. The promoter’s cohesive energy and alloy formation energy with Rh are revealed as significant descriptors during posterior feature-importance analysis. Their interplay is captured as a dimensionless property, coined promoter affinity index (PAI), which exhibits volcano correlations for space-time yield. Based on this descriptor, we develop guidelines for the rational selection of promoters in designing improved Rh-Mn-P/SiO2 catalysts. This study highlights ML as a tool for computational screening and performance prediction of unseen catalysts and simultaneously draws insights into the property–performance relations of complex catalytic systems.
Keywords: syngas, computational screening, feature engineering, alloy formation energy
Introduction
The catalytic conversion of synthesis gas (also referred to as syngas, CO + H2) to higher oxygenates (C2+ oxy) including alcohols, aldehydes, acetates, etc., offers a promising alternative to the production of higher-value fuels and chemicals.1 Given the intrinsic selectivity of rhodium (Rh) toward C2+ oxy, catalysts based on this metal are by far the most studied systems for higher alcohol synthesis (HAS).2,3 However, due to the inherent reaction kinetics of HAS, which shift the selectivities away from the desired higher alcohols (HA) and C2+ oxy, no commercial catalyst exists to date with practically relevant activity and selectivity.4 Depending on how the CO binds to the catalyst surface, methanol and hydrocarbon (HC) synthesis pathways compete with C2+ oxy formation.5 Specifically, transition metals that facilitate molecular CO adsorption, e.g., Cu and In, are selective to methanol, while those that promote CO dissociation, e.g., Fe and Co, are selective toward HCs.4,5 The most favorable mechanism for C2+ oxy formation on Rh is through the insertion of CO/CHO into CHx (x = 1–3) species, which requires simultaneous molecular and dissociative chemisorption of CO.6 While monometallic Rh is primarily selective toward methane and acetaldehyde, it hardly suffices the bifunctional requirement for HAS. For this purpose, various alkali- and transition-metal promoters are added, increasing alcohol formation and carbon chain growth capabilities.4,5 This significantly improves selectivity and/or activity toward C2+ oxy, specifically ethanol synthesis from syngas.
Fe and Mn are among the most commonly investigated promoters to improve Rh’s catalytic performance, either as binary or ternary systems.4,7 Bimetallic Rh–Fe catalysts are known to improve ethanol selectivity while decreasing methane selectivity due to the formation of Rh-FeOx interfacial sites.8 However, due to their low stability under reaction conditions and in situ Rh–Fe alloy formation induced by FeOx reduction via hydrogen spillover, the addition of a third metal is required for stable catalytic behavior. Likewise, the impact of Mn promotion on selectivity toward higher alcohols has been well reported.9−11 Mn is known to remain in an oxidized state under harsh reaction conditions (523–593 K, 3–8 MPa)1,5 typical of HAS. The modification of Rh with MnOx has mainly been described as (i) stabilization of isolated Rh+ sites, (ii) formation of Rh-MnOx interfacial sites,12 (iii) increase of Rh dispersion, or (iv) a combination of these effects.13 Although the role of Mn as a promoter is not fully elucidated yet, it has been proposed that the formation of bimetallic Rh-MnOx sites ultimately lowers the barrier for CO insertion, thereby promoting alcohol chain length growth.9,14 However, bimetallic Rh-Mn catalysts still suffer from a high selectivity toward methane and require further improvements. To this end, combinations of Rh, Mn, and Fe have also been tested for HAS. In the case of ternary Rh-Mn-Fe systems, the performance was dependent on the Fe addition levels.15,16 Low Fe content (≤0.1 wt %) strengthened the Rh-Mn interaction, thereby increasing the desorption rate of adsorbed CO, whereas higher Fe content (>0.1 wt %) increased the reducibility of Rh, resulting in greater availability of Rh species for HC formation.15 Among alkali promoters, Li is commonly investigated.6,17,18 and it is argued that Li in low quantities (≤0.1 wt %) acts as a structural promoter by increasing Rh dispersion, which in turn reduces CO dissociation.19,20 Other promoters that find a notable mention in the literature include V,21 La,22 Cr,23 and Ag.24
Experimental studies aimed at discovering high-performing promoted Rh-based catalysts have focused on the conventional trial-and-error approach, which is time- and resource-intensive. Moreover, density functional theory (DFT) simulations that can predict the performance of various such catalysts are limited either due to the catalyst structural complexities or have not been experimentally validated.25,26 Furthermore, there is a paucity of descriptors that elucidate the interplay between Rh and the promoters. Such descriptors, if identified, can guide the discovery or suggest suitable promoters for experimental validation. To address these limitations, we use a purely data-driven approach to predict and rationalize the performance of promoted Rh-based systems for HAS. Recent progress in machine learning (ML) has aroused profound interest in heterogeneously-catalyzed reactions such as oxidative coupling of methane,27 water–gas shift reaction,28 dry reforming of methane,29 CO2 hydrogenation to methanol,30 semihydrogenation of dibromomethane,31 and oxidation of propylene32 to mention a few. However, a significant factor impeding their greater application in catalysis is the lack of open-source datasets with standardized formats and the fact that published data primarily contains successful results, whereas ML requires the entire spectrum (i.e., conclusive, including unsuccessful results). This was also observed during the literature review in this study, as most published works in HAS exhibited severe inconsistency and disparity in reporting experimental procedures and catalyst performance, making catalytic data incomparable across studies. Evidently, no data-driven study on HAS via syngas has been reported as yet.
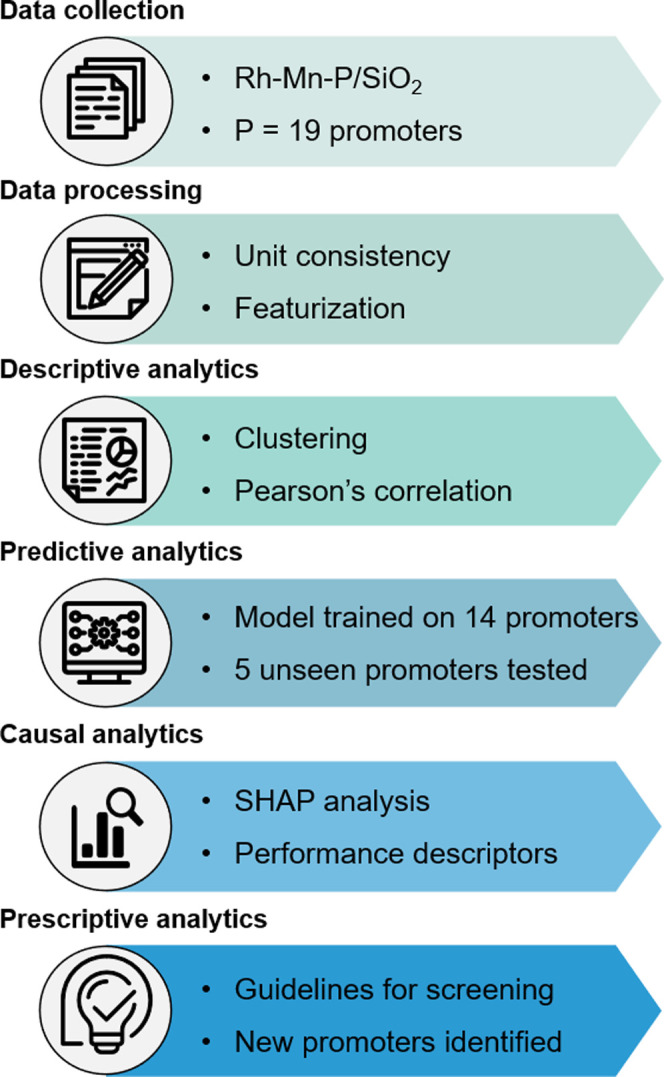
In this study, we develop an interpretable machine learning (ML) framework (Figure 1) using the open-source and consistent dataset obtained from the Pacific Northwest National Laboratory (PNNL) on promoter screening experiments on Rh-Mn-P/SiO2 systems for HAS. Here, the term “consistent dataset” implies that all of the catalysts were synthesized with similar compositions using the same protocol and tested under uniform reaction conditions, offering unbiased data for ML training and prediction. Specifically, we encode the chemical information of the catalysts (i.e., the elemental and intrinsic properties of the catalyst) and train a random forest regressor to predict the higher alcohols space-time yield (STYHA) of unseen catalysts outside of the PNNL dataset. Posterior feature-importance analysis guides the determination of catalytic descriptors, which in turn helps to rationalize the role of the Rh–promoter interaction essential to achieve high performance. This approach facilitates computational screening and performance prediction of previously untested catalysts, thereby complementing experimental efforts in the accelerated discovery of superior Rh-based catalysts for HAS.
Figure 1.
Process flow of the machine learning approach used in the study from data curation to descriptive, predictive, causal and prescriptive analytics.
Experimental Section
Data Collection
All data used in this study was obtained from the catalyst screening experiments for syngas to HAS conducted at PNNL between 2007 and 2010.33−36 In these PNNL studies, a preliminary screening of four distinct catalyst families, i.e., modified methanol synthesis (m-MS), Mo-, Rh- and Fischer-Tropsch synthesis (FTS)-based catalyst for HAS had suggested that the bimetallic Rh and Mn on silica offered the best combination for an improved STYHA. Based on these initial findings, subsequent studies were performed to further increase the STYHA, by adding promoters to the bimetallic Rh-Mn/SiO2 system. In total, 23 promoters ranging from alkali, transition, post-transition metals, and metalloids were evaluated, eventually forming a multimetallic Rh-Mn-P/SiO2 (P = Ag, Au, Ce, Co, Cs, Cu, Fe, Ga, Ge, In, Ir, La, Li, Mo, Na, Ni, Pd, Pt, Re, Ru, Sn, V, and W) system. Though there are several published works on this topic, the PNNL studies offered a single-point source for experimental data in HAS, with uniform synthesis methods, catalyst composition, and reaction conditions for the above-listed catalysts, along with successful and unsuccessful experiments. These reasons favored the selection of the PNNL dataset over literature data, as it provided consistent and unbiased data essential for ML applications.
Data Processing and Featurization
The PNNL reports primarily included information on catalyst composition, reaction conditions, and performance assessment, all of which were accepted impartially without any bias. In their study, all of the catalysts were synthesized via incipient wetness impregnation and had a fixed composition of 5.56 wt % Rh and 1.69 wt % Mn. Promoters were added at concentrations such that the Rh/Mn/P atomic ratios were 1.00:0.57:0.10, except for Li at 1.00:0.57:0.30. The catalyst performance was assessed under varying temperature (T, K), gas-hourly space velocity (GHSV, h–1), and feed H2/CO ratio at constant pressure (P, MPa) and fixed feed CO2 concentration (Table S1). The principal criteria to measure catalyst performance included information on CO conversion (XCO, %), higher alcohols selectivity (SHA, %), C2+ oxygenates selectivity (SC2+ oxy, %), methane selectivity (Smethane, %), hydrocarbon selectivity (SHC, %), higher alcohols space-time yield (STYHA, mgHA h–1 gcat–1), and higher oxygenates space-time yield (STYC2+ oxy, mgC2+ oxy h–1 gcat–1). Since all of the data was obtained from a single source, they were reported in standard formats and required minimal processing. However, for modeling convenience, the as-reported units of STYHA in mgHA h–1 mLcat–1 were converted to mgHA h–1 gcat–1, while T and P values were converted from °C and atm to K and MPa, respectively.
Featurization or feature engineering is the process of assigning new variables or transforming the original data as input features to train the ML algorithm.37,38 These features should preferably have physical meaning to aid the model interpretation in subsequent steps.39 For example, in catalysis, descriptors (electronic or structural) representing activity and stability serve as promising features to construct the ML models to rationalize catalyst performance.40 However, in experimental datasets of heterogeneously-catalyzed reactions, such descriptors are rarely provided, as they necessitate extensive characterization or DFT simulations. This also applied to the PNNL dataset, and the only catalyst-specific information included was that of its composition. To counter these limitations, various strategies have been recently used to encode catalytic descriptors, including elementary characteristics and local geometry,28,41 d-band descriptors,42,43 and intrinsic properties of substrate and adsorbates39,44 as input features in ML studies by accessing them from open-source databases.
In this context, various elemental characteristics of the promoters such as crystal radius (R, pm), Pauling’s electronegativity (χ), ionization potential (IP, eV), polarizability (α, Å3), density (ρ, kg m–3), specific heat (cp, J g–1 K–1), thermal conductivity (k, W m–1 K–1), atomization (ΔHa, kJ mol–1), enthalpy of fusion (ΔHf, kJ mol–1) and enthalpy of vaporization (ΔHv, kJ mol–1) were listed as input features into the PNNL dataset. Additionally, the valence s electrons (s), valence p electrons (p), valence d electrons (d), and valence f electrons (f), which effectively represent the geometric structure of the promoter, were also included as input features. To capture the Rh–promoter interplay, three intrinsic promoter properties were considered, alloy formation energy (Ef), energy of metal oxide formation (Eo), and cohesive energy (Ec). Ef is the reaction energy of forming an alloy from its elements and is a measure of the stability with respect to the corresponding elemental phases.45 In heterogeneous catalysis, alloying is often related to an influence in activity and/or selectivity more than proportional, e.g., Ag–Au in ethylene oxidation,46 Ni-Co for ethane dehydrogenation,47 or Pt–Au in ammonia oxidation.48 Similarly, Eo is the reaction energy of metal oxide formation from the corresponding elements. Eo indicates the stability of metal oxides and is used as a measure of the reducibility of the respective promoter as a prerequisite for alloy formation. Finally, Ec is the energy gained by forming a crystal from the corresponding metal atoms.49 Large cohesive energies represent the likelihood of stable bulk phases, implying a measure of promoter dispersion and thereby the tendency of metal–promoter interactions.12 To build the predictive ML model, all of the catalytic descriptors (i.e., the elemental, geometric, and intrinsic properties) and the reaction conditions were labeled as input features, while the STYHA was identified as the target variable. Details pertaining to the databases and calculations to obtain the catalytic descriptors are mentioned in Section S1 in the Supporting Information. The list of all input features considered in this study is presented in Table S2.
Descriptive Analytics
Once the dataset was compiled and curated, the k-means clustering, a form of unsupervised learning,50 was used to facilitate the comparative evaluation of the catalysts under fixed reaction conditions. From the PNNL reports, it was apparent that the catalyst screening and performance evaluation were carried out primarily by varying T and GHSV, with greater importance to the former. Thus, T was selected as the basis for performing the k-mean clustering. The clusters suggested by the k-means algorithm, along with the top-performing catalyst within each cluster, were statistically analyzed and visualized via bar plots. Details of the k-means algorithm are presented in Section S2 in the Supporting Information.
Furthermore, all of the input features used in the study were checked for correlation among themselves. Correlated variables tend to increase the model complexity without adding significance to its prediction capabilities.30 The correlation among the input features was calculated by Pearson’s correlation coefficient (PCC) given in eq 1.
| 1 |
where PCC is the Pearson’s correlation coefficient; xi and xmean are the sample and mean values of the x variable, respectively; and yi and ymean are the sample and mean values of the y variable, respectively. As a rule of thumb, strongly correlated features with a −0.75 ≥ PCC ≥ 0.75 were deemed redundant and discarded from the final model-building process.
Predictive Analytics
The primary motivation of this study was to develop an interpretable predictive model for STYHA as a function of catalytic descriptors and reaction conditions, with the potential to extrapolate the model to predict the performance of an unseen catalyst. Of the more than 20 promoters in the PNNL dataset, we could find the entire set of catalytic descriptors for 19 of them resulting in a total of 225 datapoints. Furthermore, the dataset comprising 19 promoters was split into two subsets, termed initial and blind sets. The initial set comprised 14 promoters as per the following groups: Li (alkali), Ce, Co, Cu, Fe, Ir, La, Mo, Pt, Ru, and V (transition), Ga and Sn (post-transition), and Ge (metalloid), with 189 datapoints. These elements were selected under a generic criterion that they sufficiently represented the various groups of the periodic table and the associated elemental and intrinsic properties of the promoters, while simultaneously serving for model training. The blind set comprised 5 metals (Ag, Ni, Pd, Re, and W) with 36 datapoints. The promoters in the blind set belonged to various groups in the periodic table from rows 3 to 6 and served as a validation set to test the model’s efficacy in predicting the performance of the unseen promoters. An overview of the metal promoters present in the initial and blind set and the exact number of datapoints per promoter is provided in Table S3. The motivation of such a framework was to extrapolate performance prediction outside the initial catalyst chemical space, allowing for computational screening and thereby reducing the experimental effort in the quest to identify high-performing catalysts.42
For modeling purposes, the initial set was split into an 85:15 ratio (i.e., 85% training data and 15% test data).30 Two ensemble tree-based ML algorithms, namely, random forest and gradient boosting trees, were developed on the training data and comparatively evaluated for their performance to predict the STYHA on the test data. Ensemble tree-based algorithms have recently gained popularity for their applications in heterogeneous catalysis.27,30,41 In contrast to the popular ML algorithms like neural networks and support vector machines, or the inherently explainable algorithms like linear or symbolic regression, they offer greater accuracy when dealing with small datasets (ca. 200–500 datapoints), along with ease of model tuning and faster convergence.30,31 These attributes of the ensemble tree-based algorithms motivated their selection in this study.
The tuning of the algorithm-specific hyperparameters was performed by grid search and the k-fold cross-validation (CV) for efficient hyperparameter tuning, as well as to avoid model overfitting.30,50 The metric used to evaluate model accuracy was based on the coefficient of determination (R2) and root-mean-square error (RMSE).27,28 A detailed description of the algorithms, hyperparameter tuning, cross-validation, and error metrics is presented in Sections S2–S4 in the Supporting Information, respectively. Eventually, the best-performing algorithm, which was trained and tested on the initial set, was extrapolated onto the blind set to predict the STYHA on the five unseen promoters.
Causal Analytics
Causal analytics, commonly referred to as feature importance, is the process of deducing the most important input features that have contributed to the model training and its final prediction.37 We clarify that the term causal analytics does not establish a mechanistic relationship between the input features and the target variable but rather helps to determine correlations between them.30 Herein, causal analytics was performed by employing the SHapley Additive exPlanations (SHAP) methodology on the best-performing algorithm, a posteriori feature-importance approach to make ML models interpretable.51 SHAP performs local feature perturbation to estimate the contributions from input features toward the predictions.52,53 In SHAP, an importance value is calculated for each feature variable for every prediction, thereby offering local interpretability. Moreover, by averaging the SHAP values across the entire dataset, the overall importance of the input features is also calculated, which leads to its global interpretability. Thus, SHAP offers both local and global interpretability, and features with large SHAP values are ranked higher and vice versa.52,53 All of the modeling activities were performed in Python (version 3.6), using open-source libraries including Pandas and Scikit-learn for machine learning models and Shap for model interpretation.
Prescriptive Analytics
While predictions and interpretations form the core of any ML workflow, their ultimate aim is to improve the system performance either by providing essential recommendations for optimization or alternatives that have been previously unexplored. Within this context, prescriptive analytics in catalysis could refer to recommendation to new catalyst formulations, guided experiments for process optimization, or discovery of novel descriptors or the catalyst itself. In this study, we make use of the insights and trends from the predictive models and causal analytics and eventually prescribe a descriptor for STYHA. Using this descriptor we screen 30 promoters from the periodic table and simultaneously predict and compare their performance to the catalyst in the PNNL dataset to identify potential promising candidates if any.
Results and Discussion
Statistical Assessment of the Dataset
To derive preliminary insights into the data, the unsupervised k-means clustering algorithm was used to create distinct data clusters based on T. Each of these clusters was further segregated into subclusters based on varying GHSV wherever applicable such that each cluster represented fixed reactions conditions to enable fair performance assessment of the catalysts (Figure 2). In cluster 1, the primary reaction conditions constituted (T = 528 ± 3 K and GHSV = 7500 h–1), while the STYHA ranged between 0 and 32 mgHA h–1 gcat–1. Moreover, in this cluster, transition-metal promoters, including Mo, Fe, Re, V, and W, had notable performances. In cluster 2 (548 ± 5 K and 7500 h–1), the maximum STYHA attained was 46 mgHA h–1 gcat–1 in the presence of Mo. Except for V, the top five promoters which appeared in cluster 1 also featured in cluster 2. Similar trends followed cluster 3 (573 ± 10 K and 11,000 h–1), with Li being the only alkali-metal promoter to be featured in the list of top 5 promoters in this cluster. Given the significant increase in T and GHSV, the average STYHA across the top 5 promoters in this cluster had almost doubled compared to clusters 1 and 2. Finally, cluster 4 (598 ± 10 K and 11,000 h–1) was the only case where Fe had displaced Mo as the highest-yielding promoter with STYHA at 73 mgHA h–1 gcat–1.
Figure 2.

Comparative evaluation of the various catalyst investigated in the PNNL dataset at fixed reaction conditions based on the recommendation of the k-means algorithm. Four distinct clusters are observed on the basis of T including (a) cluster 1 (528 ± 3 K and 7500 h–1), (b) cluster 2 (548 ± 5 K and 7500 h–1), (c) cluster 3 (573 ± 10 K and 11,000 h–1), and (d) cluster 4 (598 ± 10 K and 11,000 h–1). Within each cluster, the top 10 promoters are depicted as vertical bars in the descending order of performance.
Based on the cluster analysis, it was evident that Rh-Mn-Mo/SiO2 was the superior catalyst across different temperature regimes, except above 573 K. Interestingly, in the PNNL studies, much focus was given to Rh-Mn-Fe/SiO2 and Rh-Mn-Ir/SiO2, and subsequent optimization of the catalyst composition was performed on these systems to increase STYHA. While the rationale for preference of these catalysts over Rh-Mn-Mo/SiO2 remains unclear from their reports, a plausible reason could be the lack of adept statistical investigation on their sizeable dataset. With over 20 different types of catalysts screened under various reaction conditions, the PNNL dataset comprised close to 300 experimental datapoints. Identifying vital information in datasets of this magnitude is not a routine task and demands advanced statistical analysis and inference. The consistent omission of the best-performing promoter, i.e., Mo in the PNNL studies, which was only brought forth through our cluster analysis highlights the very same. Thus, we emphasize and advocate the application of advanced data-driven approaches in catalysis so that essential data and key trends are not overlooked by the human eye.
Finally, prior to the model-building process, all of the initial 20 input features were tested for correlation among themselves through the PCC (Figure 3). Here, it was observed that α, ρ, and IP were strongly correlated with χ, while ΔHa, ΔHf, and ΔHv, were strongly correlated with k. As a standard practice, these correlated features (α, ρ, IP, ΔHa, ΔHf, and ΔHv) were deemed redundant and thus discarded. Thus, the final set of input features used in the study effectively came down to 14 and are listed in Table 1.
Figure 3.
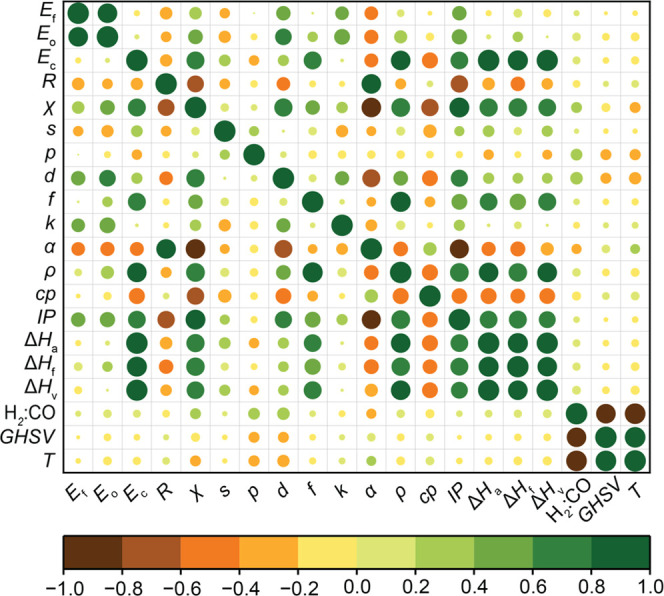
Pearson’s correlation matrix for the input features used in the study. The catalytic descriptors are promoter-specific and are abbreviated with their units as follows: alloy formation energy with Rh (Ef, eV), promoter oxide formation energy (Eo, eV), cohesive energy (Ec, eV), crystal radius (R, pm), Pauling’s electronegativity (χ), valence s electrons (s), valence p electrons (p), valence d electrons (d), valence f electrons (f), thermal conductivity (k, W m–1 K–1), polarizability (α, Å3), density (ρ, kg m–3), specific heat (cp, J g– K–1), ionization potential (IP, eV), enthalpy of atomization (ΔHa, kJ mol–1), enthalpy of fusion (ΔHf, kJ mol–1), enthalpy of vaporization (ΔHv, kJ mol–1). The reaction conditions are abbreviated with their units accordingly: H2/CO (feed H2/CO ratio), gas-hourly space velocity (GHSV, h–1), and temperature (T, K). The color bar indicates correlation among input features, where the orange and green represent negative and positive correlations, respectively. The colors in between denote intermediate values of correlation ranging from −1 (negative) to +1 (positive) calculated by PCC.
Table 1. Final List of Input Features Used for Modeling Activity.
| features | symbol | units |
|---|---|---|
| crystal radius | R | pm |
| Pauling’s electronegativity | χ | |
| valence s electrons | s | |
| valence p electrons | p | |
| valence d electrons | d | |
| valence f electrons | f | |
| specific heat | cp | J g–1 K–1 |
| thermal conductivity | k | W m–1 K–1 |
| cohesive energy | Ec | eV |
| alloy formation energy | Ef | eV |
| metal oxide formation energy | Eo | eV |
| temperature | T | K |
| gas-hourly space velocity | GHSV | h–1 |
| feed ratio | H2/CO |
ML-Based Prediction of Catalyst Performance
In this study, ensemble tree-based algorithms, namely, random forest and gradient boosting trees, were developed to predict the STYHA based on a set of 14 input features, broadly classified into two distinct categories of catalytic descriptors and reaction conditions. The comparative evaluation of the prediction capabilities of the two algorithms is shown via joint scatter plots of the actual versus predicted values of the STYHA (Figure 4a). Additionally, algorithm-specific optimal hyperparameters are presented in Table S7. Here, it was observed that both the algorithms had a comparable performance on the training and test data, where the random forest gave higher accuracy in the model predictions. The goodness of fit (represented as R2) of the random forest and gradient boosting trees models on the training data were 0.97 and 0.99, respectively, and on the test data 0.93 and 0.85, respectively. The better performance of random forest in comparison to gradient boosting trees was evident in the test R2 and was further substantiated by the fact that it had a lower RMSE between the two at 6.23 mgHA h–1 gcat–1.
Figure 4.

Model prediction by the random forest model on the (a) primary dataset comprising 14 promoters. The fivefold cross-validation method was employed during hyperparameter tuning for model generalization. (b) Validation set where the model was extrapolated to predict the performance of five unseen promoters. The red line originating from the origin is the regression line (x = y), the shaded region represents 90% confidence interval, and the root-mean-square error (RMSE) values in the plot have units of mgHA h–1 gcat–1.
Furthermore, the k-fold CV was employed during the hyperparameter tuning process to avoid model overfitting. Here, training data was divided into k subsets (k = 5 in this study), where one of the k subsets was used as the validation set, and the other k – 1 subsets formed the training set. The prediction accuracy was then averaged over all k trials to get the total effectiveness of the model. In this case, it was observed that the cross-validation R2 of the random forest and gradient boosting trees were 0.78 and 0.74, respectively. Another point worth consideration was that the random forest algorithm had experienced minor overfitting as its test R2 (0.93) and cross-validation R2 (0.78) were off by values of 0.15. Nonetheless, such minor overfitting is acceptable in small datasets as in this study, which effectively comprised only 160 training datapoints with 14 input features, bringing forth the dimensionality curse for ML algorithms, i.e., too little rows but too many columns for model training.52
Once the predictive model was developed and evaluated on the initial set, it was extrapolated to the blind set to predict the performance of the unseen catalyst. Successful predictions would imply the ability of the model to generalize, thereby offering an accelerated computational screening of potential promising promoters in the Rh-Mn-P/SiO2 systems. The blind set had a model accuracy with R2 = 0.76, which closely matched the cross-validation R2 (0.78) on the initial set. Moreover, the RMSE value of 6.23 on the blind set was also in accordance with the test RMSE value of 5.20 of the initial set (Figure 4b). For the PNNL dataset, where the STYHA varied between 0 and 83 mgHA h–1 gcat–1, such RMSE values between 5 and 6 mgHA h–1 gcat–1 on the initial and blind set indicate an acceptable error of less than 10% over the entire STYHA range.
The ML framework devised in this study included both catalytic descriptors and reaction conditions as input features and STYHA as a target variable. By learning from these chemical and parametric spaces, the model was able to extrapolate and predict the performance of 5 promoters it had never encountered before. Given the data-driven nature of the model, similar methodology can be used to predict other performance metrics including XCO, SHA, SC2+ oxy, or STYC2+ oxy depending on the requirement. We performed a correlation test between the above-mentioned metrics with STYHA, where a strong correlation would imply that these metrics could be predicted through a simple model retraining using the same feature set. However, this was not the case as no significant correlations were observed (Figure S1), and under such circumstances, separate models would have to be developed for each of the performance metrics of interest. Besides, we retrained the model, by accounting for the interactions between Mn and the promoter as an additional input feature. However, its inclusion did not alter the model performance significantly, nor was it ranked in the list of top 5 input features via SHAP. Further details of this analysis are provided in the Supporting Information, Section S4.
Sensitivity Analysis of the ML Model
The base case model discussed in the previous section was developed under the premise that should an ML algorithm be trained with sufficient representation of chemical and parametric space of the catalyst, it should have the ability to extrapolate and predict the performance of other unseen catalysts with similar properties. In doing so, the partition between initial and blind sets was arbitrarily chosen based on the modeler’s intuition. Despite the reasonable model accuracy as discussed above, a question of pertinent interest remains: how to identify the ideal split between the initial and blind set and the appropriate amount of data needed for predicting the performance of unseen catalyst? For this purpose, we carried out a series of sensitivity analyses to evaluate if the original split between the initial and blind set was truly a sufficient representation of the chemical space of the catalyst, and the extent to which the results could be sensitive to partition between them. The following scenarios were devised (i) progressively reducing the training: blind set ratio from 14:5 to (a)12:7 and (b)10:9, respectively to identify optimal split between the initial and blind set (ii) perform leave-one catalyst-out analysis such that we progressively evaluate all combinations of catalysts in the initial:blind set at 14:5 ratio. Such an analysis would be devoid of any human intuition on partitioning the data and would allow us to understand the true limits of this approach and (iii) model evaluation by including only transition-metal promoters in the dataset.
The rationale behind splitting the initial blind set at 12:7 (scenario 1a) was to represent that the model could learn from at least two catalysts and eventually predict one unseen catalyst (i.e., 12/7 = 1.7, ca. 2), while the 10:9 ratio (scenario 1b) accounted that the model had to predict the performance of 1 unseen catalyst by learning from 1 seen catalyst in the initial set. (10/9 = 1.1; ca. 1). While the model accuracy for both 12:7 and 10:9 split on the initial training data was very comparable to the original set, their performance on the blind set decreased (Table 2). The RMSE values were observed to be 10.03 mgHA h–1 gcat–1 and 11.7 mgHA h–1 gcat–1 for scenarios 1a and 1b, respectively. These numbers were higher compared to the RMSE of 6.23 mgHA h–1 gcat–1 in the base case, implying that the performance had decreased by an order of magnitude of 1.5. From this analysis, it could be deduced that the model developed herein requires to be trained with at least 3 catalysts in the initial set until it starts making reasonable predictions for every 1 new unseen catalyst, and therefore the optimal split would be 3:1, which relates to our base case split of 14:5. In the second sensitivity test (scenario 2), we progressively tried all combinations of the transition-metal catalysts in the initial blind split. To elaborate upon this, we progressively transferred one catalyst at a time from the initial to the blind set, and vice versa, and tracked the model performance in each iteration. The average error metrics obtained at the end of all iterative simulations would yield us the true accuracy and robustness of the model without the need for human intuition in devising the initial blind set. This analysis resulted in a total of 559 simulation experiments, and the average RMSE was observed to be 9.6 mgHA h–1 gcat–1. These findings imply that for the entire set of catalysts investigated in this study, irrespective of their combination in the initial and blind sets, the model performs with an average error of 9.6 mgHA h–1 gcat–1, which is approximately 12% error over the entire STYHA range in the PNNL dataset. In the final analysis (scenario 3), we discarded the four non-transition-metal promoters, namely, Ga, Sn, Li, and Ge, from the dataset and retrained the model only using transition-metal promoters. Here, the initial set had 10 promoters with 151 datapoints, while the blind set still had 5 promoters with 36 datapoints. In this case, the model performance on the initial training and blind set closely matched that of base case (Table 2). This effectively implied that much of the essence in model training was provided by the catalytic descriptors of transition metals. Overall, these sensitivity analyses helped to understand the robustness of the model as well as its limitations. These discussions on sensitivity should serve as an essential guide for ML practitioners in catalysis who may wish to apply similar methods to other systems.
Table 2. Sensitivity Analysis of the ML Model under Various Scenarios.
| scenario | initial:blind split | initial set datapoints | training R2 | blind set datapoints | validation R2 | validation RMSE |
|---|---|---|---|---|---|---|
| base case | 14:5 | 189 | 0.97 | 36 | 0.76 | 6.2 |
| 1 a | 12:7 | 170 | 0.97 | 55 | 0.27 | 10.03 |
| 1 b | 10:9 | 142 | 0.97 | 83 | 0.43 | 11.70 |
| 2 | 14:5 | various | 0.98 | various | 0.33 | 9.60 |
| 3 | 12:4 | 151 | 0.97 | 36 | 0.75 | 6.27 |
The bigger picture on offer is the potential of this approach to be used as a tool for the computational screening of catalysts. Starting with experiments that essentially encode the chemical information of a few prominent alkali-, transition-, or post-transition-metal catalysts (promoted or unpromoted), this approach can be efficiently used to predict catalyst performance and accelerate experimental efforts.
The bigger picture on offer is the potential of this approach to be used as a tool for the computational screening of catalysts. Starting with experiments that essentially encode the chemical information of a few prominent alkali-, transition-, or post-transition-metal catalysts (promoted or unpromoted), this approach can be efficiently used to predict catalyst performance and accelerate experimental efforts.
Interpretation of the Model Predictions
For data science to be pervasive in catalysis, it is of paramount importance that ML predictions are interpretable so that they are comprehended by computational and experimental researchers alike. Such endeavors, which ensure that the predictions are explainable and in alignment with the existing domain knowledge, will instill a greater sense of trust and acceptability within the community, specifically from an experimentalist point of view. For this purpose, the agnostic ML explainer, SHAP, was coupled with the random forest algorithm to determine the impact of the input features on the prediction of STYHA.30,51 The overall influence of each feature was calculated by normalized SHAP values (Figure 5).
Figure 5.

Feature-importance analysis is represented in the form of horizontal bar plots for normalized SHAP values. Temperature (T) and gas-hourly space velocity (GHSV) were identified as the top two features affecting STYHA. The alloy formation energy (Ef) and promoter cohesive energy (Ec) were revealed as the intrinsic properties of the catalyst that affect performance significantly.
It is common practice to test catalysts under varying T, P, GHSV, or feed gas ratios until the optimal reaction conditions are realized. Based on the thermodynamics of the reaction or mass transfer limitations, the catalyst performance in terms of activity increases or decreases depending on how the reaction conditions are varied. This was also the case in the PNNL dataset, wherein T and GHSV were the most frequently varied parameters to evaluate the performance of all of the investigated catalysts. From a data perspective, the constant variation in reaction conditions offers a tremendous opportunity for the algorithm to learn the correlation between them and the performance indicators. In direct coherence with the same, T and GHSV were identified as the top two features affecting the STYHA during SHAP analysis, and they cumulatively contributed to 54% of the model prediction. Similar observations were also reported in recent ML-based experimental catalysis studies.27,30,41
Among the several catalytic descriptors used, Ef and Ec were identified as critical features by the SHAP analysis and combinedly contributed to approximately 15% of the model variance. In heterogeneous catalysis, alloying is often related to an influence on activity and/or selectivity. In particular, the harsh conditions applied in hydrogenation reactions facilitate the in situ formation of alloys, which, in turn, is often correlated with catalytic performance.8,16,54 Recent studies suggested that the in situ formation of Rh–promoter alloys is unbeneficial in C2+ oxy synthesis from syngas, although a strong interaction between Rh and the respective promoter is required.8 Likewise, Rh is known to promote the reduction of metal oxides in its vicinity via H2 spillover, initiating the alloy formation accompanied by a decrease in Rh–promoter oxide interfacial sites.16 As these interfacial sites are proposed to be relevant for C–C coupling and ultimately promoting C2+ oxy formation,12 it is expected that Ef as a measure of alloy stability is directly linked to the catalytic performance of Rh-based catalysts, as also suggested by the SHAP analysis in this study.
Similarly, the Ec of the bulk metal is often used as a stability descriptor of nanostructured heterogeneous catalysts.49 In this manner, Ec reflects the stability of nanoparticles over isolated atoms and is thereby considered a measure of metal dispersion. In the above-mentioned SHAP analysis, Ec thereby reflects the promoter dispersion, which in turn might influence metal–promoter interactions. Previous studies have rationalized that these metal-promoter interactions are of utmost importance in generating Rh–promoter interfacial sites and/or stabilizing isolated Rh+ sites, leading to an improvement in Rh’s intrinsic reactivity.12,55 Finally, the valence d electrons were recognized as the third most crucial catalytic descriptor. The position of the d-band relative to the Fermi level has been identified as a descriptor for catalytic reactivity over many transition-metal surfaces.56,57 Since 75% of the promoters in the dataset were transition metals, the significance of the valence d electrons was pronounced from the SHAP inference. Additional discussion on local interpretability of the model is presented in the Supporting Information, Section S5.
Descriptor Engineering by Correlating Ef and Ec
While the SHAP results do not infer causality, they served as a potential guide to further evaluate the role and influence of the descriptors, specifically Ef and Ec, on catalyst performance. Based on this prompt, a quantitative assessment of STYHA as a univariate function of Ef and Ec was performed. To avoid any interaction influence of T and GHSV, as well as to marginalize any experimental error that might bias such an analysis, these functions were developed by averaging the reaction conditions of clusters 1 and 2 at (i) 538 ± 10 K and 7500 h–1 and that of cluster 3 and 4 at (ii) 583 ± 15 K and 11,000 h–1, respectively.
The scatter plot of Ec vs STYHA is presented in (Figure S4). Though it was not possible to derive any conclusive correlation between the two, a general observation was that transition-metal promoters with Ec > 4 eV, such as Fe, Mo, Pt, Ru, Ir, Re, and W, typically yielded higher STYHA. Importantly, the trend was consistent under both the reaction conditions investigated. Interestingly, when STYHA was mapped against Ef, volcano-like trends were observed (Figure S5). Transition-metal promoters such as Mo, Ir, Fe, Re, V, and W with Ef between −0.3 and 0.05 eV, which implied a strong affinity to form stable bonds with Rh, were identified as higher-performing promoters. The above findings and the significance of both the descriptors toward catalyst performance motivated the development of a novel descriptor that could capture the fine interplay between Ec and Ef on STYHA.
While Ef implies the probability of Rh–promoter alloy formation, Ec reflects the metal promoter dispersion over the support. Assuming that an enhanced promoter dispersion leads to an increase in Rh–promoter interactions, we logically reasoned that the ratio of Ef and Ec could mimic the likelihood of forming Rh–promoter oxide interface sites. Hence, this ratio serves as a simple descriptor for the surface reactivity of the catalyst. With this motivation, we devised a dimensionless number termed the promoter affinity index (PAI) given by eq 2.
| 2 |
Intuitively, large positive values of PAI indicate weak Rh–promoter interactions, while negative values indicate the formation of Rh–promoter alloys. In both cases, the formation of stable Rh–promoter oxide interface sites is prevented, hampering the formation of higher alcohols. On mapping STYHA as a function of PAI, volcano-like trends were observed for both reaction conditions (Figure 6). For better intuition and aesthetic reasons, a similar plot of STYHA vs PAI, but with error bars across the reaction conditions (Figure S6) is presented in the SI. This plot visually aids the comparison of various promoted catalysts with respect to the baseline Rh-Mn/SiO2 based on their PAI values. By definition, promoters with high Ec (>4 eV) and small positive Ef (0–0.15 eV) like Ru, Sn, Co, and Ni returned PAI values 0.0–0.1. Based on the metric, these promoters had a rather weak affinity to bond with Rh, potentially forming unstable bonds and hampering the STYHA. On the contrary, promoters such as Ga, La, In, Ce, and Li with low negative Ef (≤−0.2 eV) would invariably result in negative PAI values, typically ≤−0.1. This, in turn, indicated the affinity to strongly bind with Rh, thereby reducing the availability of active sites for the adsorbates and intermediates, eventually leading to suboptimal performance. For promoters like Fe, Mo, and Ir, which had rather small Ef (−0.05 ≤ Ef ≤ 0 eV) with high Ec (4–7 eV) or the likes of W and V with high Ec (>5 eV) and negative Ef (≤−0.25 eV), the resulting PAI values was found to be between −0.1 and 0.0. At these PAI values, it could be hypothesized that the bond strength between Rh and promoter would be just optimal and not too strong to hamper interactions of the adsorbates and intermediates on active sites, resulting in high STYHA.
Figure 6.

STYHA as a function of the dimensionless quantity - promoter affinity index (PAI). Volcano correlations for STYHA are observed across both the reaction conditions (a, b). The red circle depicts the baseline Rh-Mn/SiO2 system. Gray dotted lines are a guide to the eye.
Sensitivity Analysis of the PAI Descriptor
To evaluate the robustness of the descriptor, we devised a two-dimensional (2D) scatter plot and examined if the trends for PAI would remain unchanged to mean values between actual and predicted STYHA. Such a plot would serve as a stress test for PAI since both axes would be simulated. If strong correlations are observed, then interpolations across the materials space using the model would be robust. This stress test plot was performed across each of the unique reaction conditions, and volcano correlations were indeed observed further validating the role of PAI as a descriptor for STYHA (Figure S7). Furthermore, we reasoned that if PAI exhibited volcano trends with STYHA, the same must hold true in the case of total oxygenates space-time yield (STYoxy). Alcohols and oxygenates formation share the same reaction pathways, and it is only at the very end of the reaction network that hydrogenation of aldehydes and/or acids results in the formation of alcohols. It is claimed in the literature that the rate-limiting step for both the pathways is the hydrogenation of the H–CH3CO species, which takes place at the initial stages of the network.25,26 Under this context, if PAI can be considered as a descriptor for STYHA, it could also have some correlations with STYoxy. Interestingly, on plotting PAI vs STYoxy, volcano trends are indeed observed (Figure S8), further validating our claim on its role as a surface descriptor. Finally, we examined the sensitivity of PAI to the composition of the Rh–promoter system. Since PAI is dependent on Ef, which in turn changes as the composition of the alloy changes, we investigated if the PAI descriptor would work only for 1:1 ratio as originally calculated or if any other composition could also work. To this aim, we selected a Rh–promoter ratio of 3:1, which was closest to the actual catalyst composition and for which the data was readily available for most systems (17 of the total 19 used in this study). On calculating PAI for Ef at a 3:1 ratio, we observed changes in the PAI values for promoters such as Sn and Mo. However, for the rest of the promoters, the PAI value closely coincided with their original values calculated at a 1:1 ratio. On plotting STYHA as a function of PAI at this specific 3:1 ratio (Figure S9), we again observed volcano-like relations under both the reaction condition, though the correlations at reaction conditions of 583 ± 15 K was not very consistent as in the base case. Nonetheless, as a proof of concept, we discern that the trends for PAI at Rh–promoter composition of 1:1 and 3:1 are very comparable. This implies that any arbitrary, yet realistic composition chosen in between the above range should satisfy the requirement to calculate PAI, eventually yielding volcano correlations with STYHA.
Prominent research endeavors in Rh-catalyzed HAS have spanned for over four decades, and a plethora of catalyst formulations (promoted and unpromoted) have been investigated in the quest for superior performance. Specifically, in the case of promoted Rh-based catalysts, an understanding of their property–performance relation is still limited due to their structural complexities. It is worth mentioning that intrinsic properties of metals such as Ef and Ec have been known and available in the literature, but their correlation with catalyst performance, specifically in HAS, has been devoid of human intuition. In our study, the true potential of ML is highlighted, as it guided the identification of Ef and Ec as potential descriptors affecting STYHA, which were previously unexplored. Based on this prompt, we captured their collective effect in the form of a novel descriptor PAI, and devised data heuristics to suggest suitable promoters for futuristic experimental validation.
Qualitative Prediction of Promising Catalysts Using PAI Guidelines
Based on the consistency in the trends of PAI across various sensitivity analyses, we rationalized that PAI values could serve as useful guidelines to assist the selection of suitable promoters in the Rh-Mn-P/SiO2 systems. As the next gradual step, we screened the periodic table between rows 2 and 6, spanning across alkali, transition, post-transition, metalloids, and lanthanoids metals, as well as reactive nonmetals, in search for high-performing promoters guided by the optimal PAI values (Figure 7a). This resulted in the computational screening of over 30 different promoters exclusive from the PNNL dataset, provided data on Ef for these metals were readily available in open-source database. Eventually, we identified 5 metal promoters, including B, Nb, Cr, Pb, and Bi, whose PAI values ranged from −0.1 to 0.0. Given the deleterious and detrimental effects of Cr, Pb, and Bi on the environment, which would render limitations on any possibility of practical applications, we discarded them from further analysis. Of the remaining, we qualitatively predict how B and Nb would fare in terms of STYHA, using the random forest algorithm and compared it with the actual data of top promoters in the PNNL dataset under the given set of reaction conditions (Figure 7b,c). Though qualitative in nature, we raise a disclaimer that the performance of these promoters may not surpass those of Fe, Mo, and Ir, which have been identified as the best promoters in the PNNL study and substantiated by our work. However, their STYHA could be comparable with V and W, especially at lower temperature regimes. Nonetheless, the ML approach developed in this study facilitates computational screening and performance prediction for a broad spectrum of promoters (tested and untested) in Rh-based catalysts for HAS. As such, we believe it could serve as an invaluable tool for experimental researchers by guiding the selection of their experiments, which could be very time- and resource-effective.
Figure 7.

(a) Summary of the PAI guidelines that illustrates the performance in the Rh-Mn-P/SiO2 system for HAS. (b, c) Qualitative STYHA prediction of Nb and B at the given reaction conditions and their comparison with the true STYHA values of the known promoters. The error bars in Nb and B are derived from the RMSE values of the model prediction.
While the study presents the above-discussed merits, it has its own limitations. Given the inherent nature of the dataset used in this study, describing the reaction mechanism of HAS over the Rh-Mn-P/SiO2 was beyond the scope of this study. Moreover, factors such as active site and promoter speciation, nanoparticle morphology and proximity effects, etc., to mention a few, which are known to affect the catalyst performance in HAS would require a more in-depth analysis and could be made possible only by including characterization data as inputs to the model. It is apparent that the model is able to predict the performance of transition metal promoters better than other group, which could be largely attributed to the fact that this group comprised of 75% of the dataset. Should the model be able to predict performance of other groups, it will need more training data from the related group. Lastly, though the ML algorithm could predict the performance of 5 unseen promoters, it still had to be trained on the dataset of 14 promoters with 189 datapoints. Generating such experimental datasets with both the breadth in quality (different catalysts) and quantity (number of experiments) is laborious. Thus, improved ML strategies that learn from fewer datapoints without overfitting and extrapolating with better efficacy are required. Overall, this study offers unique and exciting opportunities to integrate experimental data with ML, eventually setting the basis to understand the interplay between Rh and the different types of promoters that have been investigated in Rh-Mn-P/SiO2 systems. Here, we emphasize that ML in catalysis primarily serves as a tool to a mean and is not meant to replace or compete with classical synthesis and testing procedures or characterization techniques in the search for application-specific novel catalysts. Rather, given their broad applications with robust predictions, they are meant to complement, guide, and expedite experimental efforts and DFT simulation in the very same quest.
Conclusions
A data-driven approach combining predictive and causal analytics was devised with the aim of predicting and understanding the role of promoters in Rh-based catalysts in HAS. A consistent dataset for HAS was curated by combining the experimental data for Rh-Mn-P/SiO2 catalysts from PNNL reports, along with catalytic descriptors obtained from open-source databases. This dataset was then subjected to various ML techniques, and three important strategies were demonstrated to evaluate the performance of Rh-Mn-P/SiO2 catalysts for HAS, specifically (i) the application of descriptive analytics in the form of clustering to compare catalysts under fixed reaction conditions (ii) the role of predictive analytics as a tool for computational screening of catalysts to reduce experimental efforts, and (iii) extraction of physically meaningful descriptors to describe the performance of these complex catalytic systems.
In summary, we have established an interpretable ML framework with robust prediction abilities of STYHA for Rh-Mn-P/SiO2 catalysts. Since the methodology is purely data-driven, it can be cross-deployed to other catalytic systems or reactions of interest. From a broader perspective, this framework enables the researchers to integrate experimental datasets with readily available catalytic descriptors to guide the synthesis of application-specific high-performing catalysts. Furthermore, we urge the catalysis community to open access to research data to advance the field of data-driven catalysis. To emphasize the same, the open access, otherwise shelved PNNL data was leveraged to arrive at important insights on the property–performance relations of Rh-Mn-P/SiO2 catalysts for HAS through this work. To promote this cause, as well as transparency and accessibility in research, the dataset and ML models developed in this study are made freely available to the catalysis research community.
Acknowledgments
This study was created as part of NCCR Catalysis (grant number 180544), a National Centre of Competence in Research funded by the Swiss National Science Foundation. The authors thank Dr. Georgios Giannakakis and Dr. Antonio José Martín Fernández for the fruitful discussions on the manuscript.
Supporting Information Available
The Supporting Information is available free of charge at https://pubs.acs.org/doi/10.1021/acscatal.2c04349.
Sources and calculations of catalytic descriptors (Sections S1); additional ML details (Sections S2–S4); significance of the role of Mn–promoter interactions and local SHAP analysis (Sections S5 and S6); details of the experimental dataset (Table S1); entire set of input features initially considered for modeling (Table S2); particulars of the modeling dataset along with catalytic descriptor data (Tables S3–S6); algorithm-specific hyperparameter tuning parameters (Table S7); comparison of model performance with and without Mn–promoter interactions as an input variable (Table S8); Pearson’s correlation matrix for catalytic performance parameters (Figure S1); additional feature-importance test (Figures S2 and S3); scatter plot of Ec vs STYHA and Ef vs STYHA (Figures S4 and S5); robustness of volcano correlations between PAI and STYHA derived through various scenarios (Figures S6–S9); and curated dataset and ML model compiled in this study is open sourced at GitHub (https://github.com/ssuvarnamanu/ML-for-HAS) (PDF)
The authors declare no competing financial interest.
Supplementary Material
References
- Liu G.; Yang G.; Peng X.; Wu J.; Tsubaki N. Recent Advances in the Routes and Catalysts for Ethanol Synthesis from Syngas. Chem. Soc. Rev. 2022, 51, 5606–5659. 10.1039/D0CS01003K. [DOI] [PubMed] [Google Scholar]
- Gupta M.; Smith M. L.; Spivey J. J. Heterogeneous Catalytic Conversion of Dry Syngas to Ethanol and Higher Alcohols on Cu-Based Catalysts. ACS Catal. 2011, 1, 641–656. 10.1021/cs2001048. [DOI] [Google Scholar]
- Subramani V.; Gangwal S. K. A Review of Recent Literature to Search for an Efficient Catalytic Process for the Conversion of Syngas to Ethanol. Energy Fuels 2008, 22, 814–839. 10.1021/ef700411x. [DOI] [Google Scholar]
- Luk H. T.; Mondelli C.; Ferré D. C.; Stewart J. A.; Pérez-Ramírez J. Status and Prospects in Higher Alcohols Synthesis from Syngas. Chem. Soc. Rev. 2017, 46, 1358–1426. 10.1039/C6CS00324A. [DOI] [PubMed] [Google Scholar]
- Ao M.; Pham G. H.; Sunarso J.; Tade M. O.; Liu S. Active Centers of Catalysts for Higher Alcohol Synthesis from Syngas: A Review. ACS Catal. 2018, 8, 7025–7050. 10.1021/acscatal.8b01391. [DOI] [Google Scholar]
- Xiaoding X.; Doesburg E. B. M.; Scholten J. J. F. Synthesis of Higher Alcohols from Syngas—Recently Patented Catalysts and Tentative Ideas on the Mechanism. Catal. Today 1987, 2, 125–170. 10.1016/0920-5861(87)80002-0. [DOI] [Google Scholar]
- Preikschas P.; Bauer J.; Knemeyer K.; d’Alnoncourt R. N.; Kraehnert R.; Rosowski F. Formation, Dynamics, and Long-Term Stability of Mn- and Fe-Promoted Rh/SiO2 Catalysts in CO Hydrogenation. Catal. Sci. Technol. 2021, 11, 5802–5815. 10.1039/D1CY00421B. [DOI] [Google Scholar]
- Preikschas P.; Plodinec M.; Bauer J.; Kraehnert R.; Naumann d’Alnoncourt R.; Schlögl R.; Driess M.; Rosowski F. Tuning the Rh-FeOx Interface in Ethanol Synthesis through Formation Phase Studies at High Pressures of Synthesis Gas. ACS Catal. 2021, 11, 4047–4060. 10.1021/acscatal.0c05365. [DOI] [Google Scholar]
- Ojeda M.; Granados M. L.; Rojas S.; Terreros P.; García-García F. J.; Fierro J. L. G. Manganese-Promoted Rh/Al2O3 for C2-Oxygenates Synthesis from Syngas: Effect of Manganese Loading. Appl. Catal., A 2004, 261, 47–55. 10.1016/j.apcata.2003.10.033. [DOI] [Google Scholar]
- Chen G.; Zhang X.; Guo C.-Y.; Yuan G. Manganese-Promoted Rh Supported on a Modified SBA-15 Molecular Sieve for Ethanol Synthesis from Syngas. Effect of Manganese Loading. C. R. Chim. 2010, 13, 1384–1390. 10.1016/j.crci.2010.03.025. [DOI] [Google Scholar]
- Liu J.; Guo Z.; Childers D.; Schweitzer N.; Marshall C. L.; Klie R. F.; Miller J. T.; Meyer R. J. Correlating the Degree of Metal-Promoter Interaction to Ethanol Selectivity over MnRh/CNTs CO Hydrogenation Catalysts. J. Catal. 2014, 313, 149–158. 10.1016/j.jcat.2014.03.002. [DOI] [Google Scholar]
- Yang N.; Yoo J. S.; Schumann J.; Bothra P.; Singh J. A.; Valle E.; Abild-Pedersen F.; Nørskov J. K.; Bent S. F. Rh-MnO Interface Sites Formed by Atomic Layer Deposition Promote Syngas Conversion to Higher Oxygenates. ACS Catal. 2017, 7, 5746–5757. 10.1021/acscatal.7b01851. [DOI] [Google Scholar]
- Carrillo P.; Shi R.; Senanayake S. D.; White M. G. In Situ Structural Study of Manganese and Iron Oxide Promoted Rhodium Catalysts for Oxygenate Synthesis. Appl. Catal., A 2020, 608, 117845 10.1016/j.apcata.2020.117845. [DOI] [Google Scholar]
- Mei D.; Rousseau R.; Kathmann S. M.; Glezakou V.-A.; Engelhard M. H.; Jiang W.; Wang C.; Gerber M. A.; White J. F.; Stevens D. J. Ethanol Synthesis from Syngas over Rh-Based/SiO2 Catalysts: A Combined Experimental and Theoretical Modeling Study. J. Catal. 2010, 271, 325–342. 10.1016/j.jcat.2010.02.020. [DOI] [Google Scholar]
- Yu J.; Mao D.; Han L.; Guo Q.; Lu G. Conversion of Syngas to C2+ Oxygenates over Rh-Based/SiO2 Catalyst: The Promoting Effect of Fe. J. Ind. Eng. Chem. 2013, 19, 806–812. 10.1016/j.jiec.2012.10.021. [DOI] [Google Scholar]
- Huang X.; Teschner D.; Dimitrakopoulou M.; Fedorov A.; Frank B.; Kraehnert R.; Rosowski F.; Kaiser H.; Schunk S.; Kuretschka C.; Schlögl R.; Willinger M.-G.; Trunschke A. Atomic-Scale Observation of the Metal–Promoter Interaction in Rh-Based Syngas-Upgrading Catalysts. Angew. Chem., Int. Ed. 2019, 58, 8709–8713. 10.1002/anie.201902750. [DOI] [PubMed] [Google Scholar]
- Ding D.; Yu J.; Guo Q.; Guo X.; Xiao X.; Mao D.; Lu G. The Effects of PVP-Modified SiO2 on the Catalytic Performance of CO Hydrogenation over Rh-Mn-Li/SiO2 Catalysts. RSC Adv. 2017, 7, 48420–48428. 10.1039/C7RA07011J. [DOI] [Google Scholar]
- Chen Y.; Zhang H.; Ma H.; Qian W.; Jin F.; Ying W. Direct Conversion of Syngas to Ethanol over Rh-Fe/γ-Al2O3 Catalyst: Promotion Effect of Li. Catal. Lett. 2018, 148, 691–698. 10.1007/s10562-017-2202-6. [DOI] [Google Scholar]
- Ngo H.; Liu Y.; Murata K. Effect of Secondary Additives (Li, Mn) in Fe-Promoted Rh/TiO2 Catalysts for the Synthesis of Ethanol from Syngas. React. Kinet., Mech. Catal. 2011, 102, 425–435. 10.1007/s11144-010-0263-2. [DOI] [Google Scholar]
- Han L.; Mao D.; Yu J.; Guo Q.; Lu G. Synthesis of C2-Oxygenates from Syngas over Rh-Based Catalyst Supported on SiO2, TiO2 and SiO2-TiO2 Mixed Oxide. Catal. Commun. 2012, 23, 20–24. 10.1016/j.catcom.2012.02.032. [DOI] [Google Scholar]
- Subramanian N. D.; Gao J.; Mo X.; Goodwin J. G.; Torres W.; Spivey J. J. La and/or V Oxide Promoted Rh/SiO2 Catalysts: Effect of Temperature, H2/CO Ratio, Space Velocity, and Pressure on Ethanol Selectivity from Syngas. J. Catal. 2010, 272, 204–209. 10.1016/j.jcat.2010.03.019. [DOI] [Google Scholar]
- Gao J.; Mo X.; Chien A. C.-Y.; Torres W.; Goodwin J. G. CO Hydrogenation on Lanthana and Vanadia Doubly Promoted Rh/SiO2 Catalysts. J. Catal. 2009, 262, 119–126. 10.1016/j.jcat.2008.12.006. [DOI] [Google Scholar]
- Xue F.; Chen W.; Song X.; Cheng X.; Ding Y. Promotional Effects of Cr and Fe on Rh/SiO2 Catalyst for the Preparation of Ethanol from CO Hydrogenation. RSC Adv. 2016, 6, 35348–35353. 10.1039/C5RA28075C. [DOI] [Google Scholar]
- Mo X.; Gao J.; Goodwin J. G. Role of Promoters on Rh/SiO2 in CO Hydrogenation: A Comparison Using DRIFTS. Catal. Today 2009, 147, 139–149. 10.1016/j.cattod.2009.01.016. [DOI] [Google Scholar]
- Schumann J.; Medford A. J.; Yoo J. S.; Zhao Z.-J.; Bothra P.; Cao A.; Studt F.; Abild-Pedersen F.; Nørskov J. K. Selectivity of Synthesis Gas Conversion to C2+ Oxygenates on Fcc(111) Transition-Metal Surfaces. ACS Catal. 2018, 8, 3447–3453. 10.1021/acscatal.8b00201. [DOI] [Google Scholar]
- Ulissi Z. W.; Medford A. J.; Bligaard T.; Nørskov J. K. To Address Surface Reaction Network Complexity Using Scaling Relations Machine Learning and DFT Calculations. Nat. Commun. 2017, 8, 14621 10.1038/ncomms14621. [DOI] [PMC free article] [PubMed] [Google Scholar]
- Nguyen T. N.; Nhat T. T. P.; Takimoto K.; Thakur A.; Nishimura S.; Ohyama J.; Miyazato I.; Takahashi L.; Fujima J.; Takahashi K.; Taniike T. High-Throughput Experimentation and Catalyst Informatics for Oxidative Coupling of Methane. ACS Catal. 2020, 10, 921–932. 10.1021/acscatal.9b04293. [DOI] [Google Scholar]
- Smith A.; Keane A.; Dumesic J. A.; Huber G. W.; Zavala V. M. A Machine Learning Framework for the Analysis and Prediction of Catalytic Activity from Experimental Data. Appl. Catal., B 2020, 263, 118257 10.1016/j.apcatb.2019.118257. [DOI] [Google Scholar]
- Şener A. N.; Günay M. E.; Leba A.; Yildirim R. Statistical Review of Dry Reforming of Methane Literature Using Decision Tree and Artificial Neural Network Analysis. Catal. Today 2018, 299, 289–302. 10.1016/j.cattod.2017.05.012. [DOI] [Google Scholar]
- Suvarna M.; Araújo T. P.; Pérez-Ramírez J. A Generalized Machine Learning Framework to Predict the Space-Time Yield of Methanol from Thermocatalytic CO2 Hydrogenation. Appl. Catal., B 2022, 315, 121530 10.1016/j.apcatb.2022.121530. [DOI] [Google Scholar]
- Saadun A. J.; Pablo-García S.; Paunović V.; Li Q.; Sabadell-Rendón A.; Kleemann K.; Krumeich F.; López N.; Pérez-Ramírez J. Performance of Metal-Catalyzed Hydrodebromination of Dibromomethane Analyzed by Descriptors Derived from Statistical Learning. ACS Catal. 2020, 10, 6129–6143. 10.1021/acscatal.0c00679. [DOI] [Google Scholar]
- Foppa L.; Sutton C.; Ghiringhelli L. M.; De S.; Löser P.; Schunk S. A.; Schäfer A.; Scheffler M. Learning Design Rules for Selective Oxidation Catalysts from High-Throughput Experimentation and Artificial Intelligence. ACS Catal. 2022, 12, 2223–2232. 10.1021/acscatal.1c04793. [DOI] [PMC free article] [PubMed] [Google Scholar]
- Gerber M. A.; White J. F.; Stevens D. J.. Mixed Alcohol Synthesis Catalyst Screening, PNNL-16763; Pacific Northwest National Lab. (PNNL): Richland, WA, United States, 2007.
- Gerber M. A.; White J. F.; Gray M. J.; Stevens D. J.. Mixed Alcohol Synthesis Catalyst Screening 2007 Progress Report, PNNL-17074; Pacific Northwest National Lab. (PNNL): Richland, WA, United States, 2007.
- Gerber M. A.; White J. F.; Gray M. J.; Stevens D. J.. Evaluation of Promoters for Rhodium-Based Catalysts for Mixed Alcohol Synthesis, PNNL-17857; Pacific Northwest National Lab. (PNNL): Richland, WA, United States, 2008.
- Gerber M. A.; Gray M. J.; Albrecht K. O.; White J. F.; Rummel B. L.; Stevens D. J.. Optimization of Rhodium-Based Catalysts for Mixed Alcohol Synthesis 2010 Progress Report, PNNL-22081; Pacific Northwest National Lab. (PNNL): Richland, WA, United States, 2010.
- Toyao T.; Maeno Z.; Takakusagi S.; Kamachi T.; Takigawa I.; Shimizu K. Machine Learning for Catalysis Informatics: Recent Applications and Prospects. ACS Catal. 2020, 10, 2260–2297. 10.1021/acscatal.9b04186. [DOI] [Google Scholar]
- Erdem Günay M.; Yildirim R. Recent Advances in Knowledge Discovery for Heterogeneous Catalysis Using Machine Learning. Catal. Rev. 2021, 63, 120–164. 10.1080/01614940.2020.1770402. [DOI] [Google Scholar]
- Prabhu A. M.; Choksi T. S. Data-Driven Methods to Predict the Stability Metrics of Catalytic Nanoparticles. Curr. Opin. Chem. Eng. 2022, 36, 100797 10.1016/j.coche.2022.100797. [DOI] [Google Scholar]
- Yang Z.; Gao W. Applications of Machine Learning in Alloy Catalysts: Rational Selection and Future Development of Descriptors. Adv. Sci. 2022, 9, 2106043 10.1002/advs.202106043. [DOI] [PMC free article] [PubMed] [Google Scholar]
- Suzuki K.; Toyao T.; Maeno Z.; Takakusagi S.; Shimizu K.; Takigawa I. Statistical Analysis and Discovery of Heterogeneous Catalysts Based on Machine Learning from Diverse Published Data. ChemCatChem 2019, 11, 4537–4547. 10.1002/cctc.201900971. [DOI] [Google Scholar]
- Williams T.; McCullough K.; Lauterbach J. A. Enabling Catalyst Discovery through Machine Learning and High-Throughput Experimentation. Chem. Mater. 2020, 32, 157–165. 10.1021/acs.chemmater.9b03043. [DOI] [Google Scholar]
- Ma X.; Li Z.; Achenie L. E. K.; Xin H. Machine-Learning-Augmented Chemisorption Model for CO2 Electroreduction Catalyst Screening. J. Phys. Chem. Lett. 2015, 6, 3528–3533. 10.1021/acs.jpclett.5b01660. [DOI] [PubMed] [Google Scholar]
- Li X.; Li B.; Yang Z.; Chen Z.; Gao W.; Jiang Q. A Transferable Machine-Learning Scheme from Pure Metals to Alloys for Predicting Adsorption Energies. J. Mater. Chem. A 2022, 10, 872–880. 10.1039/D1TA09184K. [DOI] [Google Scholar]
- Bartel C. J. Review of Computational Approaches to Predict the Thermodynamic Stability of Inorganic Solids. J. Mater. Sci. 2022, 57, 10475–10498. 10.1007/s10853-022-06915-4. [DOI] [Google Scholar]
- Pu T.; Tian H.; Ford M. E.; Rangarajan S.; Wachs I. E. Overview of Selective Oxidation of Ethylene to Ethylene Oxide by Ag Catalysts. ACS Catal. 2019, 9, 10727–10750. 10.1021/acscatal.9b03443. [DOI] [Google Scholar]
- Jalid F.; Khan T. S.; Haider M. A. CO2 Reduction and Ethane Dehydrogenation on Transition Metal Catalysts: Mechanistic Insights, Reactivity Trends and Rational Design of Bimetallic Alloys. Catal. Sci. Technol. 2021, 11, 97–115. 10.1039/D0CY01290D. [DOI] [Google Scholar]
- Wang H.; Lin M.; Murayama T.; Feng S.; Haruta M.; Miura H.; Shishido T. Selective Catalytic Oxidation of Ammonia to Nitrogen over Zeolite-Supported Pt-Au Catalysts: Effects of Alloy Formation and Acid Sites. J. Catal. 2021, 402, 101–113. 10.1016/j.jcat.2021.08.002. [DOI] [Google Scholar]
- Zhuang H.; Tkalych A. J.; Carter E. A. Surface Energy as a Descriptor of Catalytic Activity. J. Phys. Chem. C 2016, 120, 23698–23706. 10.1021/acs.jpcc.6b09687. [DOI] [Google Scholar]
- Tan D.; Suvarna M.; Shee Tan Y.; Li J.; Wang X. A Three-Step Machine Learning Framework for Energy Profiling, Activity State Prediction and Production Estimation in Smart Process Manufacturing. Appl. Energy 2021, 291, 116808 10.1016/j.apenergy.2021.116808. [DOI] [Google Scholar]
- Esterhuizen J. A.; Goldsmith B. R.; Linic S. Interpretable Machine Learning for Knowledge Generation in Heterogeneous Catalysis. Nat. Catal. 2022, 5, 175–184. 10.1038/s41929-022-00744-z. [DOI] [Google Scholar]
- Suvarna M.; Jahirul M. I.; Aaron-Yeap W. H.; Augustine C. V.; Umesh A.; Rasul M. G.; Günay M. E.; Yildirim R.; Janaun J. Predicting Biodiesel Properties and Its Optimal Fatty Acid Profile via Explainable Machine Learning. Renewable Energy 2022, 189, 245–258. 10.1016/j.renene.2022.02.124. [DOI] [Google Scholar]
- Kumar R.; Singh A. K. Chemical Hardness-Driven Interpretable Machine Learning Approach for Rapid Search of Photocatalysts. npj Comput. Mater. 2021, 7, 1–13. 10.1038/s41524-021-00669-4. [DOI] [Google Scholar]
- Prieto G.; Beijer S.; Smith M. L.; He M.; Au Y.; Wang Z.; Bruce D. A.; de Jong K. P.; Spivey J. J.; de Jongh P. E. Design and Synthesis of Copper-Cobalt Catalysts for the Selective Conversion of Synthesis Gas to Ethanol and Higher Alcohols. Angew. Chem., Int. Ed. 2014, 53, 6397–6401. 10.1002/anie.201402680. [DOI] [PubMed] [Google Scholar]
- Wang Y.; Luo H.; Liang D.; Bao X. Different Mechanisms for the Formation of Acetaldehyde and Ethanol on the Rh-Based Catalysts. J. Catal. 2000, 196, 46–55. 10.1006/jcat.2000.3026. [DOI] [Google Scholar]
- Medford A. J.; Vojvodic A.; Hummelshøj J. S.; Voss J.; Abild-Pedersen F.; Studt F.; Bligaard T.; Nilsson A.; Nørskov J. K. From the Sabatier Principle to a Predictive Theory of Transition-Metal Heterogeneous Catalysis. J. Catal. 2015, 328, 36–42. 10.1016/j.jcat.2014.12.033. [DOI] [Google Scholar]
- Chowdhury A. J.; Yang W.; Walker E.; Mamun O.; Heyden A.; Terejanu G. A. Prediction of Adsorption Energies for Chemical Species on Metal Catalyst Surfaces Using Machine Learning. J. Phys. Chem. C 2018, 122, 28142–28150. 10.1021/acs.jpcc.8b09284. [DOI] [Google Scholar]
Associated Data
This section collects any data citations, data availability statements, or supplementary materials included in this article.