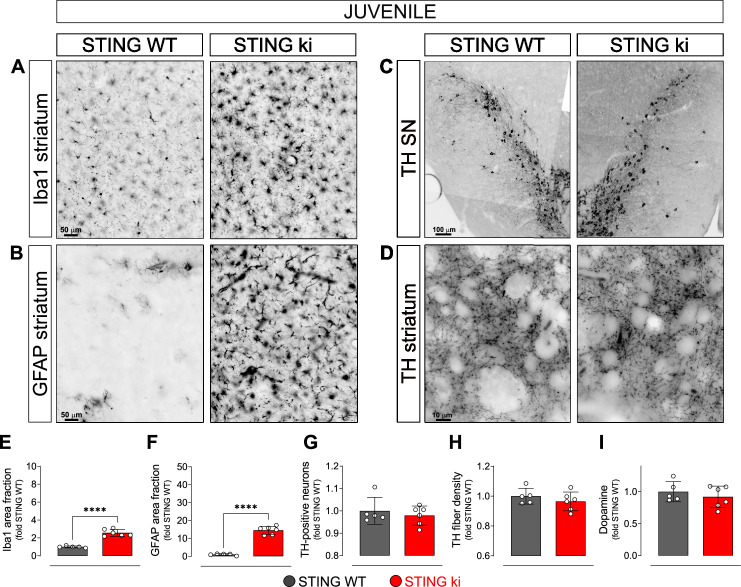
Figure 2. Neuroinflammation without neurodegeneration in juvenile mice with constitutive STING activation.
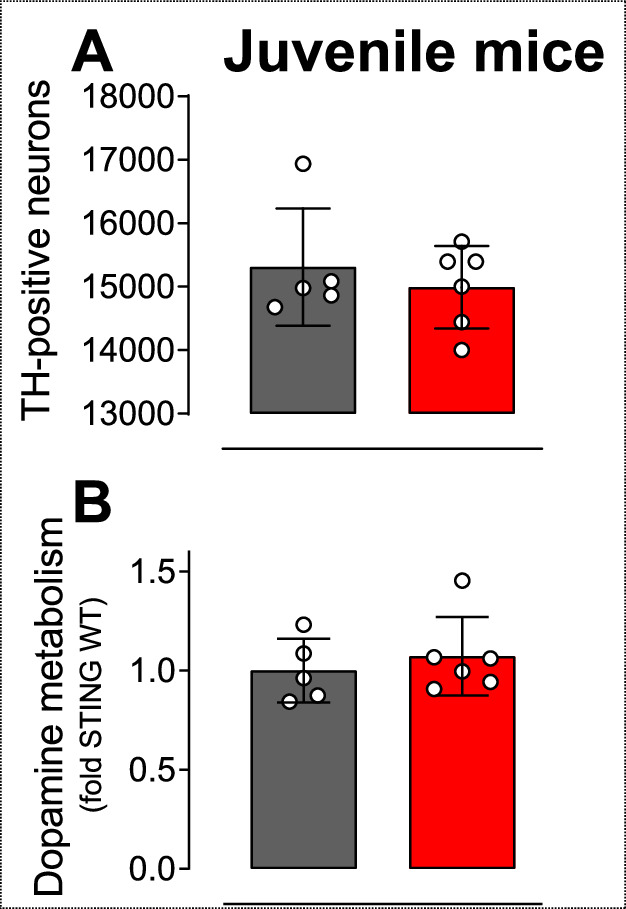
(A) Representative images of striatal sections stained for the microglia marker Iba1 from 5-week-old STING WT and STING ki mice. Scale bar: 50 μm (B) Representative images of striatal sections stained for the astroglia marker GFAP from 5-week-old STING WT and STING ki mice. Scale bar: 50 μm (C) Representative images of midbrain sections containing the substantia nigra (SN, stitched from two microscopy fields) stained for tyrosine hydroxylase (TH) from 5-week-old STING WT and STING ki mice. Scale bar: 100 μm (D) Representative images of striatal sections stained for TH from 5-week-old STING WT and STING ki mice. Scale bar: 10 μm. (E) Area fraction positive for Iba1, normalized to the mean of STING WT (***: p=0,0009; t-test, n=5–6). (F) Area fraction positive for GFAP, normalized to the mean of STING WT brains (***: p=0.0007; t-test, n=5–6). (G) Number of TH-positive neurons (mean ± SD; t-test). Graph showing the counted numbers of dopaminergic neurons is on Figure 2—figure supplement 1A. (H) Area fraction positive for TH (mean ± SD, t-test, n=5–6). (I) Dopamine concentration in striatal lysates from 5-week-old STING WT and STING ki mice, measured by HPLC and normalized to the mean of STING WT (mean ± SD, t-test, n=5–6). Dopamine metabolites are in Figure 2—figure supplement 1B.
Figure 2—figure supplement 1. Neuroinflammation without neurodegeneration in juvenile mice.


