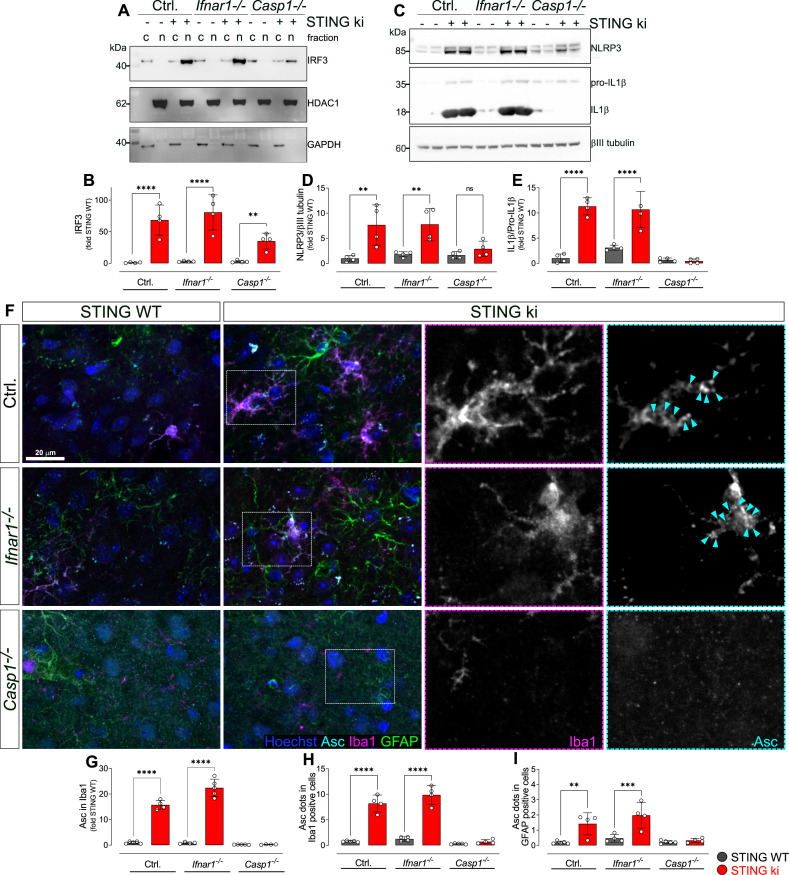
Figure 6. Activation of IRF3 and NF-kB-related signalling pathways in double transgenic mice with STING N153S/WT ki and knock-out for Ifnar1 or Caspase-1.
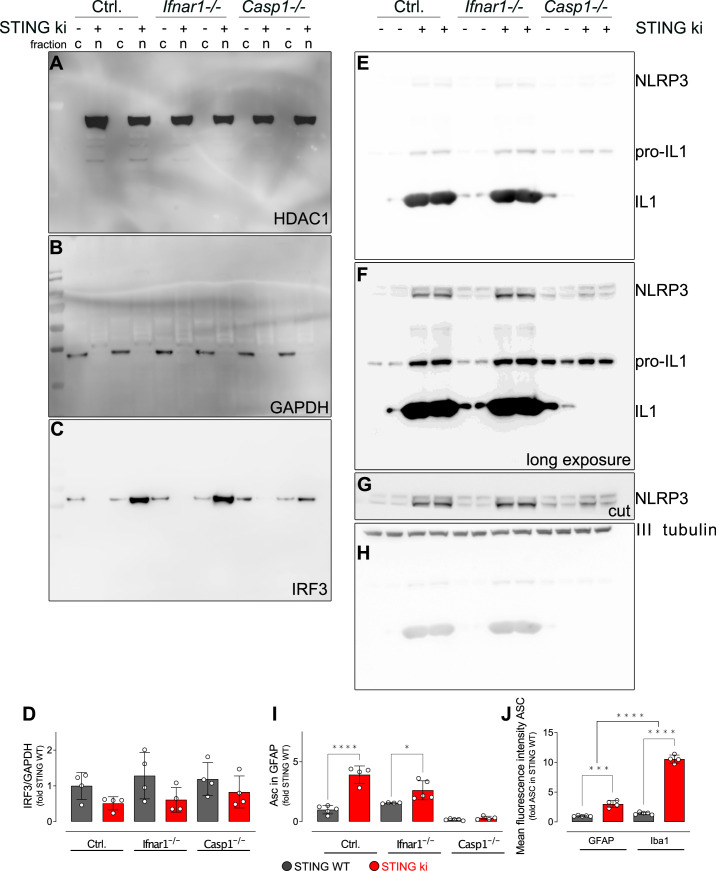
(A) Representative western blot images showing interferon regulatory factor 3 (IRF3, upper panel), the nuclear marker histone deacetylase 1 (HDAC1, middle panel) and cytoplasmic marker glycerinaldehyd-3-phosphat-dehydrogenase (GAPDH, lower panel) detected from the striatum. Images of the whole membrane stained for the different proteins are shown on Figure 6—figure supplement 1A-C. (B) Ratio of IRF3 and HDAC1, expressed as relative to the mean of STING WT (****: p<0.00001; **: p=0.0043; two-way ANOVA with Tukey post-hoc test, n=4). Ratio of IRF3 and GAPDH expressed as relative to the mean of STING WT is shown on Figure 6—figure supplement 1D. (C) Representative western blot images showing NLR family pyrin domain containing 3 (NLRP3, upper panel), Il1b and pro-Il1b (middle panel) and the loading control βIII tubulin (lower panel) detected from the striatum. Images of the whole membrane stained for the different proteins are shown on Figure 6—figure supplement 1E-H. (D) Ratio of NLRP3 and βIII tubulin, expressed as relative to the mean of STING WT (**: p<0.0057; **: p=0.0029; two-way ANOVA with Tukey post-hoc test, n=4). (E) Ratio of Il1b and pro-Il1b, expressed as relative to the mean of STING WT (****: p<0.00001; two-way ANOVA with Tukey post-hoc test, n=4). (F) Representative images of striatal sections stained for the astroglia marker GFAP (green), microglia marker Iba1 (magenta), apoptosis-associated speck-like protein (ASC, cyan) and Hoechst (blue) from STING WT or STING ki mice on a background of interferon a receptor knockout (Ifnar1-/-), caspase-1 knockout (Casp1-/-) or Ifnar1+/+, Casp1+/+ (Ctrl.). Scale bar: 20 μm. Magnified insets show Iba1 and ASC, cyan arrowheads indicate ASC specks. (G) Area fraction of ASC signal within microglia as relative to the mean of STING WT (****: p<0.00001; two-way ANOVA with Tukey post-hoc test, n=4–5). (H) Number of ASC-positive dots within microglia as relative to the mean of STING WT (****: p<0.00001; two-way ANOVA with Tukey post-hoc test, n=4–5). (I) Number of ASC-positive dots within astroglia as relative to the mean of STING WT (**: p=0.0083; ***: p=0.0006; two-way ANOVA with Tukey post-hoc test, n=4–5). Graph showing area fraction of ASC signal within astroglia is on Figure 6—figure supplement 1I.


