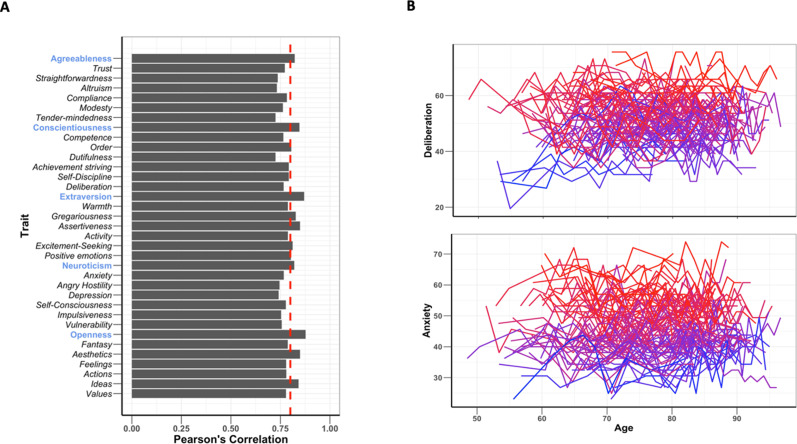
Appendix 1—figure 5. Stability of Revised NEO Personality Inventory (NEO-PI-R) traits across multiple visits.
(A) Test–retest stability of the NEO-PI-R traits. Red dash line is Pearson’s correlation of 0.8. All the traits have a high test–retest reliability. (B) The stability of two randomly selected personality traits (Deliberation and Activity) across multiple measurement visits. Plot color represents starting trait values; blue shows individual’s lower initial trait values, and red shows higher initial trait values. The plot shows that subsequent trait measurement tends to stabilize around the initial measurement values.

