

Abstract
DNA methylation (DNAm) patterns across the genome changes during aging and development of complex diseases including type 2 diabetes (T2D). Our study aimed to estimate DNAm trajectories of CpG sites associated with T2D, epigenetic age (DNAmAge), and age acceleration based on four epigenetic clocks (GrimAge, Hannum, Horvath, phenoAge) in the period 10 years prior to and up to T2D onset. In this nested case–control study within Doetinchem Cohort Study, we included 132 incident T2D cases and 132 age- and sex-matched controls. DNAm was measured in blood using the Illumina Infinium Methylation EPIC array. From 107 CpG sites associated with T2D, 10 CpG sites (9%) showed different slopes of DNAm trajectories over time (p < 0.05) and an additional 8 CpG sites (8%) showed significant differences in DNAm levels (at least 1%, p-value per time point < 0.05) at all three time points with nearly parallel trajectories between incident T2D cases and controls. In controls, age acceleration levels were negative (slower epigenetic aging), while in incident T2D cases, levels were positive, suggesting accelerated aging in the case group. We showed that DNAm levels at specific CpG sites, up to 10 years before T2D onset, are different between incident T2D cases and healthy controls and distinct patterns of clinical traits over time may have an impact on those DNAm profiles. Up to 10 years before T2D diagnosis, cases manifested accelerated epigenetic aging. Markers of biological aging including age acceleration estimates based on Horvath need further investigation to assess their utility for predicting age-related diseases including T2D.
Supplementary Information
The online version contains supplementary material available at 10.1007/s11357-022-00626-z.
Keywords: DNA methylation, Type 2 diabetes, Epigenetic clock, Biological age, Aging markers
Introduction
Type 2 diabetes (T2D) is a complex, metabolic disease with increasing prevalence worldwide. According to the International Diabetes Federation, 463 million people were estimated to have diabetes in 2019 and this number is expected to increase to 700 million in 2045. From those estimates, type 2 diabetes accounts for 90% of all diabetes cases and almost 20% of those cases are older than 65 years [1]. The expanding aging of the world’s population together with the obesity epidemic is major contributors to the increasing prevalence of diabetes.
Besides age, lifestyle and obesity also genetic factors have been implicated in T2D. The heritability for T2D was estimated at 72% [2] and recent genome-wide association studies have found hundreds of single nucleotide polymorphisms (SNPs) associated with T2D [3, 4]. However, environmental and lifestyle factors also play a substantial role in T2D development [5, 6] and their interaction with genetic susceptibility could provide new insights into mechanisms contributing to T2D [7]. Epigenetic modifications, of which DNA methylation (DNAm) is a major aspect, have been proposed as the biological mechanism underlying gene-environment interaction [8]. DNAm involves methyl group (-CH3) binding to the cytosine, mainly occurring on cytosine-guanine dinucleotides (CpG sites) [9]. DNAm plays an important role in development of diseases because of its ability to alter gene expression [10]. However, a blood-based longitudinal epigenome-wide association study (EWAS) on incident T2D showed only one out of 15 CpG sites (on CPT1A gene) with a possible causal role in T2D [11]. Similar conclusions were drawn from blood-based BMI-EWAS, where DNAm changes were mainly a consequence of adiposity, the major risk factor for T2D. Nevertheless, those changes predicted future T2D, when combined into a methylation risk score [12]. Thus, DNAm markers in blood could help in personalized prediction and prevention of T2D.
Chronological age above 45 is considered a risk factor for T2D [13]. However, given the large variation in healthy aging [14], biological age may be preferred over chronological age as a predictor of disease [15]. DNAm may reflect biological ageing. Therefore, DNAm is used in biological age predictors such as epigenetic clocks. The Horvath, Hannum, GrimAge, and PhenoAge epigenetic clocks [16–19] are well known examples of these clocks. The difference between a person’s predicted epigenetic age and their chronological age, the so-called age acceleration, may be a proxy for general health and rate of aging of an individual. A positive age acceleration indicates a higher biological than chronological age and has been associated with negative health outcomes including chronic obstructive pulmonary disease (COPD), T2D, ischemic heart disease, and cardiovascular disease [17, 20, 21].
Previous EWAS studies using blood samples have reported lists of CpG sites that are significantly associated with prevalent and incident T2D [22]. Furthermore, they have shown that single studies often have insufficient power to be used for a meaningful hypothesis-free discovery study. Therefore, we chose here to conduct a hypothesis-based study. Recently, we conducted a longitudinal meta-EWAS discovery study and reported 76 CpG sites associated with incident T2D [23]. We selected from this published literature a list of 111 unique CpG sites associated with incident and prevalent T2D, for which we investigated the trajectories over time with the development of the disease. Specifically, we estimated DNAm trajectories of those CpG sites in the period prior to and up to T2D onset, and explored differences in these trajectories between incident T2D cases and controls from the longitudinal Doetinchem Cohort Study [23]. In addition, we aimed to estimate trajectories of epigenetic age (DNAmAge) and age acceleration and explored differences in trajectories using four epigenetic clocks: Horvath, Hannum, phenoAge, and GrimAge.
Methods
Study design and population
For this nested case–control study, we used data from incident T2D cases and age- and sex-matched controls from the Doetinchem Cohort Study, an ongoing, prospective, population-based study from Doetinchem, the Netherlands [24, 25]. The aim of the cohort was to study impact of lifestyle and biological factors on health during adulthood and in old age. In brief, a random sample from the general population of women and men aged between 20 and 59 were selected for the first measurement round in 1987–1991. The cohort is re-examined every 5 years with extensive questionnaires, clinical measurements, and blood samples collection: i.e., round 1 in 1987–1991 (N = 7768); round 2 in 1993–1997 (N = 6117); round 3 in 1998–2002 (N = 4918); round 4 in 2003–2007 (N = 4520); round 5 in 2008–2012 (N = 4018), and round 6 in 2013–2017 (N = 3438) participants.
For this particular study, we selected 132 incident T2D cases from rounds 3 to 6 of the cohort based on self-reported diagnosis from questionnaires, confirmed by a general practitioner based on the WHO definition (fasting plasma glucose values of ≥ 7.0 mmol/L (126 mg/dl), 2-h post-load plasma glucose ≥ 11.1 mmol/L (200 mg/dl), HbA1c ≥ 6.5% (48 mmol/mol), or a random blood glucose ≥ 11.1 mmol/L (200 mg/dl) in the presence of signs and symptoms) [25, 26]. Controls were healthy participants with no family history of T2D, no history of gestational diabetes, and normoglycemia at any time during the follow-up (defined by WHO, i.e., a random blood glucose < 7.8 mmol/L). We matched cases and controls on age (± 2 years), sex, and round of the Doetinchem Cohort Study measurement. For each participant, when blood samples were available, we included all three time points: (1) T-10: approximately 10 years before T2D diagnosis; (2) T-5: approximately 5 years before T2D diagnosis; (3) T0: time of T2D diagnosis (Fig. 1). For controls, we included samples from equivalent measurement rounds. All anthropometric, clinical and lifestyle factors were measured according to standard protocols, with details described elsewhere [24, 25]. The study was approved by the Medical Ethics Committee of the University Medical Center Utrecht. All participants provided informed consent.
Fig. 1.
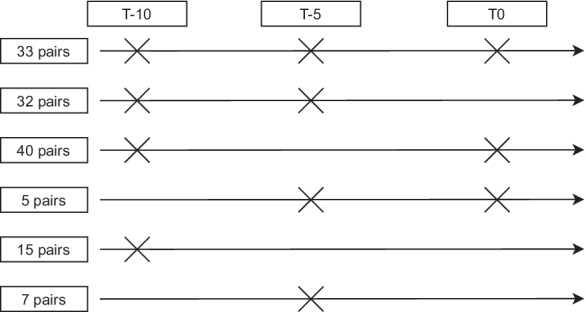
Timeline diagram showing sampling of 132 T2D case–control pairs from the Doetinchem Cohort Study for each timepoint. T-10 and T-5 represent approximately 10 and 5 years, respectively, before T2D diagnosis; T0 = T2D diagnosis
DNA methylation
For all participants, blood samples from three different measurement rounds — where possible — were lifted from the freezers (see Supplementary Table S1). DNA was isolated from whole blood samples employing a commonly used salting out method [27]. Next, 500 ng of genomic DNA was bisulfite modified using the EZ DNAm kit (Zymo Research, Irvine, California, USA) and hybridized to the Illumina Infinium Methylation EPIC chip according to the manufacturer’s protocols. The original IDAT files were generated by the Illumina iScan BeadChip scanner. Data were generated by the Genome Analysis Facility of UMCG (Groningen, The Netherlands) and GenomeScan (Leiden, The Netherlands). Pre-processing and quality control of the combined methylation data from two labs were done using minfi software [28]. We removed probes containing a SNP in the probe sequence, probes with a poor detection p-value (p-value > 0.001), and probes on X and Y chromosomes. Then, quantile normalization of intensity values (separated into 6 categories according to probe type and colour channel) was applied using limma software [29]. Adjustment for batch effects was done using ComBat, and leukocyte composition was estimated using the Houseman approach [30, 31]. We removed extreme outliers (< 25th percentile − 3*IQR (interquartile range) or > 75th percentile + 3*IQR)) in DNAm data [32], leaving 803,591 probes for the analyses.
Epigenetic age and epigenetic age acceleration calculation
Raw DNAm data were used to calculate epigenetic age based on four clocks: DNAmAge Horvath, DNAmAge Hannum, phenoAge, and GrimAge using an online web tool [33]. Age acceleration values per time point were calculated by regressing epigenetic age on its chronological age with adjustment for estimated white blood cell composition (percentage of CD4T cells, CD8T cells, B cells, NK cells, monocytes, and granulocytes, estimated using the Houseman algorithm [31]) and batch effects (i.e., epigenetic age ~ chronological age + WBC composition + batch effects). Then, we used the residuals of the model as age acceleration values [16].
Statistical analysis
To investigate trajectories of DNAm before T2D diagnosis, we selected genome-wide significant (p-value < 1 × 10⁻⁷) CpG sites associated with incident and prevalent T2D based on relevant published literature on T2D-EWAS [22, 34–36]. DNAm trajectories for these CpG sites were compared between cases and controls, using linear mixed models implemented in the nlme R package [37]. We modelled fixed effects for T2D case/control status, time, and the interaction between T2D case/control status and time. Additionally, a random intercept and random slope was included. We applied a first-order autoregressive correlation matrix to account for repeated measurements within participants. In addition, we adjusted for age at time of diagnosis (T0), sex, and estimated white blood cell composition (percentage of CD4T cells, CD8T cells, B cells, NK cells, monocytes, and granulocytes, estimated using the Houseman algorithm) [31]. From this first model, we extracted model parameters and plotted DNAm trajectories for cases and controls separately.
In subsequent model 2, we additionally adjusted for clinical and lifestyle factors, i.e., BMI, smoking and physical activity, lipid levels (including total cholesterol, triglycerides and HDL cholesterol), and C-reactive protein (CRP) levels to investigate their influence on DNAm trajectories.
To investigate differences in trajectories of DNAmAge and age acceleration between incident T2D cases and controls, we used linear mixed models with the following fixed effects: T2D case/control status, time, and the interaction between T2D case/control status and time, with a random intercept and a random slope for time. We adjusted age acceleration models for sex, while the DNAmAge models were adjusted for sex, estimated white cell types, and batch effects.
CpG sites showing significantly different DNAm trajectories or showing differences in DNAm levels at all time points were queried in the EWAS Atlas to identify significantly associated traits (p-value < 1.0E − 4 or adjusted p-value < 0.05) reported in the literature [38].
A two-sided p-value < 0.05 was considered statistically significant. All analyses were performed using R v(4.0.3) and the nlme R-package [37].
Results
Study population characteristics
A total of 132 incident T2D cases and 132 age-, sex-, and round-matched controls were included in the current study (Fig. 1). Based on blood sample availability in the Doetinchem Cohort Study biobank for these 132 case–control pairs, we included a total of 550 DNAm samples collected for the three time points (240 samples from 120 case–control pairs at T-10; 154 samples from 77 case–control pairs at T-5; and 156 samples from 78 case–control pairs at T0; Fig. 1; Supplementary Table S1).
Clinical characteristics of the total case–control study population at the time of diagnosis (T0) are presented in Table 1. The mean age at T0 was 60 years and 45% of the study population were women. Significant differences in BMI, waist-to-hip ratio (WHR), random glucose, triglycerides, HDL cholesterol, CRP levels, and blood pressure were observed between incident T2D cases and controls at T0. Additionally, incident T2D cases and controls differed in socioeconomic status (represented by the highest educational level obtained) and the level of physical activity defined by the Cambridge Physical Activity Index (p < 0.05; Table 1).
Table 1.
General characteristics of cases and controls from the Doetinchem Cohort Study at the time of diagnosis
| Cases | Controls | p-value | |
|---|---|---|---|
| N | 132 | 132 | |
| Sex- female N (%) | 60 (45%) | 60 (45%) | 1 |
| Age (years) | 60.1 (9.0) | 60.0 (9.0) | 0.97 |
| BMI (kg/m2) | 30.0 (5.0) | 26.6 (4.4) | 2.4 × 10⁻⁸ |
| WHR | 0.97 (0.08) | 0.91 (0.08) | 3.3 × 10⁻¹⁰ |
| Random glucose (mmol/l) | 7.9 (3.3) | 5.0 (0.8) | < 2.2 × 10⁻¹⁶ |
| Total cholesterol (mmol/l) | 5.6 (1.1) | 5.6 (1.0) | 0.87 |
| Triglycerides (mmol/l) | 2.0 [1.3;2.8] | 1.3 [1.0;1.9] | 3.5 × 10⁻⁹ |
| HDL cholesterol (mmol/l) | 1.2 (0.3) | 1.4 (0.4) | 2.6 × 10⁻⁸ |
| LDL cholesterol (mmol/l)a | 3.5 (1.0) | 3.5 (0.9) | 0.7 |
| CRP (mg/L) | 2.7 [1.3;7.0] | 1.2 [0.6; 2.8] | 6.6 × 10⁻⁷ |
| SBP | 140.0 (21.0) | 130.1 (18.1) | 3.3 × 10⁻⁵ |
| DBP | 84.0 (11.0) | 80.0 (9.3) | 0.001 |
|
Socioeconomic status 1 = Low 2 = Medium 3 = High |
75 (57%) 37 (28%) 19 (15%) |
65 (50%) 30 (23%) 36 (27%) |
0.04 |
|
Cambridge Physical Activity Index 1 Inactive 2 Moderately inactive 3 Moderately active 4 Active |
11 (8%) 38 (29%) 47 (36%) 36 (27%) |
3 (2%) 34 (26%) 43 (33%) 52 (39%) |
0.05 |
|
Smoking Current-smokers Ex-smokers Never smokers |
34 (26%) 58 (45%) 38 (29%) |
20 (16%) 59 (45%) 51 (39%) |
0.06 |
aLDL cholesterol calculated based on Friedewald equation. CRP and TG were log-transformed. Data are shown as mean (SD) for normally distributed variables, as median and 25th and 75th quintiles for not normally distributed variables and as number of individuals (%) for categorical variables; p-values are obtained from Student’s t test for normally distributed variables or from Mann–Whitney U test for not normally distributed variables and χ2 square for categorical variables; significant p values < 0.05
Clinical characteristics for each of the three time points (T-10, T-5, and T0) for these participants are presented in Supplementary Table S1. Throughout the study period, future T2D cases showed significantly higher BMI, WHR, random glucose, total cholesterol, triglycerides, LDL cholesterol, CRP, and blood pressure levels compared to controls (p-value for case–control status). However, only trajectories of BMI, WHR, random glucose, total cholesterol, and LDL cholesterol showed significant differences between incident T2D cases and controls (p-value for slope < 0.05; Supplementary Table S1). All these traits showed expected diverging trajectories between cases and controls except for total cholesterol.
CpG sites associated with T2D
Based on a recent meta-EWAS on incident T2D [23] and relevant published literature on T2D-EWAS, we compiled a list of 111 unique CpG sites associated with incident and prevalent T2D [34–36] (Supplementary Table S2). From these 111 CpG sites, 107 were available in our DNAm dataset for further analysis (Supplementary Table S2). Comparison of the trajectories for these 107 CpG sites revealed ten sites with different slopes over time between incident T2D cases and controls (p < 0.05; Supplementary Table S3; Supplementary Fig. 1). Four out of these ten CpG sites showed significant differences in DNAm levels for at least two time points, including cg06500161 (ABCG1), cg08994060 (PFKFB3), cg15020801 (PNPO), and cg19693031 (TXNIP) (Fig. 2). CpG sites on ABCG1, PFKFB3, and TXNIP showed diverging trajectories, with the largest difference between incident T2D cases and controls at the time of diagnosis (T0). CpG cg15020801 (PNPO) showed a trajectory converging between cases and controls, showing the largest difference in DNAm levels 10 years before diagnosis (T-10) (Fig. 2). Adjustment for clinical and lifestyle factors, i.e., BMI, smoking, level of physical activity, lipid levels, and CRP levels (see “Methods” section), did not affect the observed differences in DNAm slopes between incident T2D cases and controls (Supplementary Table 3).
Fig. 2.

DNAm trajectories of four CpG sites showing significantly different slopes and significant differences in methylation levels for at least two timepoints between incident T2D cases and controls. Trajectories were extracted from linear mixed effects models adjusted for age at time of diagnosis (T0), sex, cell type proportion, and batch effects. Ribbons represent 95% confidence intervals
Besides differences in trajectories, DNAm levels may also differ consistently between future T2D cases and controls. Therefore, we selected CpG sites, from the compiled list of 111 unique CpG sites associated with incident and prevalent T2D (Supplementary Table S2), based on significant differences (at least 1%) in DNAm levels at all three time points showing nearly parallel trajectories (i.e., no significant differences in slopes) between incident T2D cases and controls. This analysis resulted in eight CpG sites (Supplementary Table S4; Fig. 3). Of these, five CpG sites showed higher DNAm levels in incident T2D cases compared to controls: cg11024682 (SREBF1), cg11202345 (LGALS3BP), cg05778424 (AKAP1), cg19750657 (UFM1), and cg07504977. The remaining three CpG sites (cg14476101 (PHGDH), cg18181703 (SOCS3), and cg26262157 (PFKFB3)) showed lower DNAm levels in the incident T2D cases compared to controls (Fig. 3).
Fig. 3.

DNAm trajectories for eight CpG sites showing significantly (p < 0.05) different DNAm levels at each time point (T-10, T-5, and T0) between incident T2D cases and controls. Trajectories were extracted from linear mixed effects models adjusted for age at time of diagnosis (T0), sex, cell type proportion, and batch effects. Ribbons represent 95% confidence intervals
Characteristics of the 12 CpG sites showing either different trajectories (four CpG sites; Fig. 2) or consistent differences in DNAm level (eight CpG sites; Fig. 3) are presented in Table 2. Two CpG sites are located within the same gene (PFKFB3). Our query in the EWAS Atlas revealed that most of these 12 CpG sites have been significantly associated with other metabolic traits such as obesity, waist circumference and WHR, metabolic syndrome, lipids traits, insulin resistance, fasting plasma glucose, and blood pressure, next to T2D (Table 2).
Table 2.
Characteristics of 12 CpG sites showing different trajectories and/or levels in incident T2D
| CpG | CHR | BP position | Gene name | Location in gene | Relation to CpG-island | EWAS Atlas associations |
|---|---|---|---|---|---|---|
| cg06500161 | 21 | 43,656,587 | ABCG1 | Body | S_Shore | Blood triglyceride levels; body mass index (BMI); hypertriglyceridemic waist; metabolic syndrome (MetS); plasma fasting HOMA-IR levels; plasma fasting insulin levels; triglyceride postprandial responses to a high-fat dietary challenge; type 2 diabetes (T2D); waist circumference (WC); waist to height ratio (WHtR); waist to hip ratio (WHR); metabolic trait; blood high-density lipoprotein (HDL) levels; hepatic fat; insulin resistance |
| cg08994060 | 10 | 6,214,026 | PFKFB3 | Body | Aging, acute Lymphoblastic leukaemia; down syndrome; preeclampsia; prenatal mercury (Hg) exposure; type 2 diabetes (T2D); gestational age; inflamed Crohn’s disease (CD) | |
| cg15020801 | 17 | 46,022,809 | PNPO | Body | Cognitive function; smoking | |
| cg19693031 | 1 | 145,441,552 | TXNIP | 3'UTR | Alcohol consumption; blood HbA1c levels; diastolic blood pressure; down syndrome; inflammatory bowel disease; maternal smoking; metabolic syndrome (MetS); systolic blood pressure; type 2 diabetes (T2D); simple hepatic steatosis | |
| cg05778424 | 17 | 55,169,508 | AKAP1 | 5'UTR | Air pollution (NO2); multiple sclerosis; myalgic encephalomyelitis/chronic fatigue syndrome; type 2 diabetes (T2D) | |
| cg07504977 | 10 | 102,131,012 | N_Shelf | Body mass index (BMI); papillary thyroid carcinoma; puberty; waist circumference (WC); atopy; hormone therapy | ||
| cg11024682 | 17 | 17,730,094 | SREBF1 | Body | S_Shelf | Aging; blood triglyceride levels; body mass index (BMI); metabolic syndrome (MetS); myalgic encephalomyelitis/chronic fatigue syndrome; serum liver enzyme levels (gamma-glutamyl transferase, GGT); triglyceride postprandial responses to a high-fat dietary challenge; type 2 diabetes (T2D); waist circumference (WC); waist to height ratio (WHtR) |
| cg11202345 | 17 | 76,976,057 | LGALS3BP | 1stExon | Abdominal obesity; body mass index (BMI); preterm birth; waist circumference (WC) | |
| cg14476101 | 1 | 120,255,992 | PHGDH | Body | S_Shore | Aging; alcohol consumption; blood triglyceride levels; body mass index (BMI); diastolic blood pressure; maternal pre-pregnancy obesity; mortality; serum liver enzyme levels (gamma-glutamyl transferase, GGT); systolic blood pressure; type 2 diabetes (T2D); waist circumference (WC); waist to hip ratio (WHR); metabolic trait; atopy; hepatic fat; insulin resistance; SETD1B-related syndrome |
| cg18181703 | 17 | 76,354,621 | SOCS3 | Body | N_Shore | Aging; alcohol consumption; body mass index (BMI); cognitive function; Crohn's disease (CD); educational attainment; lung function; obesity; smoking; soluble tumor necrosis factor receptor 2 (sTNFR2) levels in plasma; type 2 diabetes (T2D); Werner syndrome; Nicolaides–Baraitser syndrome (NCBRS); insulin resistance; SETD1B-related syndrome; chemotherapy for breast cancer |
| cg19750657 | 13 | 38,935,967 | UFM1 | 3'UTR | Body mass index (BMI); obesity; preeclampsia; preterm birth; waist circumference (WC); plasma adiponectin levels | |
| cg26262157 | 10 | 6,214,079 | PFKFB3 | Body | Aging, Acute Lymphoblastic Leukemia; down syndrome; preeclampsia; prenatal mercury (Hg) exposure; type 2 diabetes (T2D); gestational age; inflamed Crohn's disease (CD) |
DNAmAge and epigenetic age acceleration
Mean chronological and epigenetic ages for incident T2D cases and controls were estimated using four different epigenetic clocks, i.e., GrimAge, Hannum, Horvath, and phenoAge. The resulting findings are presented in Fig. 4. All four clocks showed a high correlation with chronological age, ranging from 0.81 for GrimAge to 0.89 for Hannum with slightly higher correlations for all clocks in the control group compared to cases (Supplementary Table S5). Mean DNAmAge for Horvath and Hannum as well as for phenoAge was lower than the chronological age at all time points in both groups, while mean GrimAge was higher than chronological age (Fig. 4). Mean epigenetic age from all four clocks at the three time points studied (T-10, T-5, and T0) was lower in the control group compared to incident T2D cases. However, this difference in epigenetic age was not statistically significant. Furthermore, we observed no significant differences in increase of epigenetic age over time between cases and controls (Supplementary Table S6).
Fig. 4.

Trajectories and levels of DNAmAges and age acceleration based on four epigenetic clocks in incident T2D cases and controls. Trajectories were extracted from linear mixed effects models. DNAmAge models were adjusted for sex, estimated white cell types and batch effects and age acceleration models for sex. Ribbons represent 95% confidence intervals. The dotted line in the upper plots represents mean chronological age (which was the same for cases and controls due to age-matching); in the lower plots, the dotted line is y = 0, indicating no age acceleration
Besides differences in epigenetic age as such, (future) T2D cases may age more rapidly compared to controls. Therefore, mean age acceleration values for incident T2D cases and controls were estimated; the results are presented in Fig. 4. Age acceleration values in the control group were negative at all three time points (T-10, T-5, and T0), suggesting a lower rate of aging. In incident T2D cases, mean age acceleration levels were positive, suggesting accelerated aging in the case group. However, the slopes were not statistically different between the groups (p ≥ 0.05; Supplementary Table S6). Only the Horvath-based age acceleration showed a significant difference in level (i.e., years) between incident T2D cases and controls throughout the study period (p < 0.05; Supplementary Table S6).
Discussion
To the best of our knowledge, this is the first case–control study of trajectories of DNAm markers associated with T2D. By including multiple time points up to approximately 10 years before diagnosis, we showed significantly different DNAm trajectories of 10 blood-based CpG sites between incident T2D cases and control, including four CpG sites which also showed differences in DNAm levels. Furthermore, in our study, DNAmAges and age accelerations showed no significant difference in trajectories (slopes) between cases and controls. However, we observed positive age acceleration values in incident T2D cases and negative age acceleration values in controls, suggesting accelerated biological aging is associated with development of T2D.
Trajectories of DNAm markers
The present case–control study, nested within the prospective Doetinchem Cohort Study, allowed us to capture changes in methylation profile prior to disease onset. Such a design captures epigenetic dynamics during part of the life-course. Most of the published T2D-EWAS studies used a cross-sectional approach with DNAm and disease measured at the same time point. Only a few longitudinal studies on T2D-EWAS have been published to date, with only one time point measured before diagnosis [11, 35]. We included CpG sites associated with incident and prevalent T2D to capture DNAm trajectories over time. A total of 10 out of the 107 studied CpG sites showed significantly different trajectories (slopes) between incident T2D cases and controls throughout the study period (from approximately 10 years prior to actual T2D diagnosis). Those trajectories differ per CpG site and could be categorized into two main groups: diverging and converging trajectories for cases and controls. Most (7/10) CpG sites showed diverging trajectories, with increasing differences in DNAm levels between cases and controls towards the manifestation of T2D. However, two CpG sites, at the TENC1 and PNPO gene, showed converging DNAm trajectories, with a large difference in DNAm level at T-10, but reaching the same level at T0 for cases and controls. We focused on the four CpG sites that differed both in trajectory and in mean DNAm levels, i.e., the CpG sites located at the TXNIP, ABCG1, PFKFB3, and PNPO gene; Fig. 2). The CpG sites cg19693031 and cg06500161 mapping to the TXNIP and ABCG1 gene, respectively, were previously shown to be robustly associated with either incident or prevalent T2D [11, 34, 35, 39–41]. We observed a sharp decline in DNAm level for TXNIP and a sharp incline for ABCG1 in the incident T2D cases at those two CpG sites, with a growing difference observed towards the manifestation of T2D (Fig. 2). The PFKFB3 gene plays a role in control of glycolytic flux, and its increased expression has been observed in diabetic mouse liver [42]. cg08994060 mapping to the PFKFB3 gene had previously been identified as a mediator of the association between prenatal famine exposure and triglyceride levels [43]. The fourth CpG site was mapped to the PNPO (pyridoxine 5′-phosphate oxidase) gene, which is known to be involved in the formation of the biologically active form of vitamin B6, i.e., pyridoxal 5′-phosphate (PLP) [44]. Substantial evidence has been reported linking vitamin B6 to diabetes, including T2D [45]. This evidence includes reduced plasma levels of PLP in T2D patients [46–48]. Also, this specific CpG site was identified in CRP-EWAS, a chronic low-grade inflammation marker implicated in a pathogenesis of complex diseases and reported as a mediator of the association between prenatal famine exposure and triglycerides levels [43, 49]. In our study, the CpG that mapped to the PNPO gene showed a large difference between (future) T2D cases and controls at T-10. An inverse relationship between plasma PLP and inflammation markers was reported for T2D patients [45]. The observed change in DNAm levels may be indicative of a compensatory mechanism to restore PLP concentrations. All four CpG sites show promise as predictive biomarkers for personalized prevention, but potential implications for clinical use requires further study.
Another eight CpG sites showed consistent differences in DNAm levels across all time points with nearly parallel trajectories between incident T2D cases and controls (Fig. 3). These trajectories might be related to processes such as natural aging, as DNAm levels exhibit similar slopes in cases and controls. The respective eight CpG sites are located in genes directly related to diabetes, obesity, and/or metabolic syndrome. CpG sites of the genes SREBF1, LGALS3BP, PHGDH, and UFM1 were identified in multiple BMI and lipids EWAS (LDL and HDL cholesterol, triglycerides, and free cholesterol; Table 2) [50–54]. The SOCS3 methylation locus was also reported to be inversely correlated with the clinical definition of the metabolic syndrome [55]. DNAm levels of these eight CpG sites in blood may reflect early metabolic changes occurring many years before T2D diagnosis. Gradually increasing levels of hyperglycemia may cause DNAm changes that perhaps initiate compensatory mechanisms in response to developing metabolic dysregulation. Also, risk factors for T2D such as obesity and aging may affect the DNAm profiles and hence trigger the development of insulin resistance and T2D [56, 57].
Accelerated epigenetic age in incident T2D
First-generation epigenetic clocks (Horvath and Hannum) were designed specifically to predict age in healthy individuals, whereas phenoAge and GrimAge aimed to capture biological aging processes to improve prediction of mortality and morbidity [16–19]. Deviation of the estimated epigenetic age from chronological age provides valuable information about biological aging. The biological age markers intend to measure functional decline, risk of age-related diseases, and mortality [58]. We calculated epigenetic age and age acceleration based on first-generation (Horvath and Hannum) and second-generation (phenoAge and GrimAge) epigenetic clocks. We observed a high correlation between epigenetic age and chronological age over time for all four epigenetic clocks (Supplementary Table S5). Furthermore, controls showed a lower epigenetic age than cases, presumably because of the “healthy” status of this group. Apart from GrimAge, the epigenetic age estimations in our dataset were lower compared to the chronological age in both incident T2D cases and controls. Similar findings were presented in a 20-year follow-up of the Swedish Adoption/Twin Study of Aging (SATSA), where all four clocks yielded epigenetic age estimations that were lower than the chronological age [59]. It has previously been described that both Horvath and Hannum clocks underestimate chronological age especially in older individuals, which has been explained by loci approaching the limits of 0 or 100% methylation (DNA methylation saturation). Additionally, elevated levels of 5-hydroxymethylcytosine (5hmC) may offset age-predictors, as it is undistinguishable from methylated cytosine [60]. The GrimAge clock is a new-generation epigenetic clock which comprises biomarkers based on DNAm surrogates of seven plasma proteins plus packyears of smoking. Smoking is a known factor influencing DNA methylation levels [61]. One possible explanation for the higher epigenetic age estimated with GrimAge than the chronological age is the high number of smokers in our dataset (37% and 30% of current smokers at T-10 in cases and controls, respectively).
Age acceleration reflects a higher than expected rate of biological aging and has been associated with increased risk of mortality, cancer, and cardiovascular disease [17, 19, 62–64]. Aging mechanisms lead to multiple pathologies, and therefore, differences in the rate of aging will have implications for a wide array of diseases and conditions. Similarly, slower GrimAge acceleration was associated with better cardiovascular health starting with young adulthood up to 20 years later, suggesting it might be a useful biomarker of age-related cardiovascular outcomes [65]. Although the trajectories (slopes) of age acceleration were not significantly different between incident T2D cases and controls, our analysis showed that already approximately 10 years before diagnosis T2D cases-to-be had positive age acceleration values compared to controls, regardless of the clock used. This suggests enhanced biological aging associated with the development of T2D.
Next steps should include evaluating dynamics of the epigenetic clocks in the general population, as well as in response to various treatments and interventions. An important goal of such research would also be to determine causality: is DNAm driving aging processes, or should it rather be considered as a surrogate marker of aging?
Strengths and limitations
Strengths of this study include repeated measurements of the 132 case–control pairs with 260 DNAm samples collected at three consecutive time points from as early as 10 years before T2D diagnosis. We combined in this study investigation of trajectories of known blood-based DNAm biomarkers for T2D and epigenetic age and age acceleration. We included both first- and second-generation epigenetic clocks including Horvath clock, Hannum, phenoAge, and GrimAge. Given the limited number (≤ 3) of repeated measurements, we were unable to examine non-linear trajectories. Also, for several case–control pairs, only a single timepoint was measured, which may have limited the power to detect differences in trajectories between incident cases and controls. Another potential limitation of our study is the use of blood-based DNAm profiles. For T2D, more detailed insights in mechanisms driving disease development could be provided from metabolically active tissues such as adipose tissue, liver, or skeletal muscle. DNAm varies between cell types; therefore, whole blood may not fully reflect changes in other tissues. Also, using whole blood in epigenetic studies and in estimating epigenetic age has been shown to be confounded by the effect of cell type composition. The latter issue was addressed by adjusting all our analyses for composition of cell type using the Houseman algorithm [31]. We did not correct the analyses for multiple testing because of the hypothesis-based design of the study; we tested a strict selection of CpG sites that were previously shown to be genome-wide significantly associated with T2D. The identified methylation changes over the 10 years were small (up to few % change), as expected based on previous EWAS studies on complex diseases. The utility of epigenetic clocks with respect to measures of biological aging (e.g., cognitive and functional impairment/frailty), mortality, and other complex diseases beyond type 2 diabetes has been shown previously [62, 65–67]. However, several limitations of the epigenetic clocks should be considered including the small proportion of DNA methylation markers included in the estimation, the modest correlations with chronological age, and the confounding effect of genetic and environmental factors, as well as technical differences in the selected DNA methylation arrays. Finally, selection of case–control pairs limits extrapolation of our results to the general population, for which representative cohort studies of DNAm trajectories would be needed.
Conclusions
In conclusion, we investigated trajectories of known CpG sites associated with prevalent and incident T2D in a case–control study nested within the longitudinal Doetinchem Cohort Study. Our results showed that DNAm levels, up to 10 years before T2D manifestation, slightly differ between T2D cases-to-be and healthy controls at specific CpG sites. Some of those CpG sites annotate to genes involved in glucose and lipid homeostasis. We observed distinct patterns of clinical traits over time between cases-to-be and controls, which may have an impact on DNAm profiles. Therefore, changes in blood DNAm could be considered as markers of altered metabolism and might be useful for T2D prediction beyond traditional clinical markers. We also showed that up to 10 years before T2D diagnosis, cases manifest accelerated epigenetic aging compared to healthy controls. Markers of biological aging including age acceleration estimates based on Horvath need further investigation to assess their utility for predicting age-related diseases including T2D.
Supplementary Information
Below is the link to the electronic supplementary material.
Acknowledgements
We thank the participants of the Doetinchem Cohort Study, as well as the field workers of the Municipal Health Services in Doetinchem (C. te Boekhorst, I. Hengeveld, L. de Klerk, I. Thus, and C. de Rover) for their contribution to the data collection of this study. We are grateful to P. Vissink for logistic management and A. Blokstra for data management (both from the National Institute for Public Health and the Environment).
Funding
This work was supported by the Ministry of Health, Welfare and Sport of the Netherlands, the National Institute for Public Health and the Environment (RIVM; grant number S/132005), and by Biobanking and Biomolecular Resources Research Infrastructure-NL (grant number CP2011-27).
Declarations
Conflict of interest
The authors declare that they have no conflict of interest.
Footnotes
Publisher's note
Springer Nature remains neutral with regard to jurisdictional claims in published maps and institutional affiliations.
Chris H.L. Thio, Paul Wackers, Harold Snieder, Annemieke M. W. Spijkerman, and Mirjam Luijten contributed equally to this work.
References
- 1.Saeedi P, Petersohn I, Salpea P, et al Global and regional diabetes prevalence estimates for 2019 and projections for 2030 and 2045: Results from the International Diabetes Federation Diabetes Atlas, 9th edition. Diabetes Research and Clinical Practice. 2019;157. 10.1016/j.diabres.2019.107843 [DOI] [PubMed]
- 2.Willemsen G, Ward KJ, Bell CG, et al. The concordance and heritability of type 2 diabetes in 34,166 twin pairs from International Twin Registers: The Discordant Twin (DISCOTWIN) Consortium. Twin Res Hum Genet. 2015;18(6):762–771. doi: 10.1017/thg.2015.83. [DOI] [PubMed] [Google Scholar]
- 3.Mahajan A, Taliun D, Thurner M, et al. Fine-mapping type 2 diabetes loci to single-variant resolution using high-density imputation and islet-specific epigenome maps. Nat Genet. 2018;50(11):1505–1513. doi: 10.1038/s41588-018-0241-6. [DOI] [PMC free article] [PubMed] [Google Scholar]
- 4.Xue A, Wu Y, Zhu Z, et al. Genome-wide association analyses identify 143 risk variants and putative regulatory mechanisms for type 2 diabetes. Nat Commun. 2018;9(1):2941. doi: 10.1038/s41467-018-04951-w. [DOI] [PMC free article] [PubMed] [Google Scholar]
- 5.Gill JMR, Cooper AR. Physical activity and prevention of type 2 diabetes mellitus. Sports Med. 2008;38(10):807–824. doi: 10.2165/00007256-200838100-00002. [DOI] [PubMed] [Google Scholar]
- 6.Carter P, Gray LJ, Troughton J, Khunti K, Davies MJ. Fruit and vegetable intake and incidence of type 2 diabetes mellitus: systematic review and meta-analysis. BMJ. 2010;341:c4229. doi: 10.1136/bmj.c4229. [DOI] [PMC free article] [PubMed] [Google Scholar]
- 7.Franks PW, Pearson E, Florez JC. Gene-environment and gene-treatment interactions in type diabetes. Diabetes Care. 2013;36(5):1413–1421. doi: 10.2337/dc12-2211. [DOI] [PMC free article] [PubMed] [Google Scholar]
- 8.Liu L, Li Y, Tollefsbol TO. Gene-environment interactions and epigenetic basis of human diseases. Curr Issues Mol Biol. 2008;10(1–2):25–36. [PMC free article] [PubMed] [Google Scholar]
- 9.Bird A. DNA methylation patterns and epigenetic memory. Genes Dev. 2002;16:6–21. doi: 10.1101/gad.947102. [DOI] [PubMed] [Google Scholar]
- 10.Jin Z, Liu Y. DNA methylation in human diseases. Genes and Diseases. 2018;5:1–8. doi: 10.1016/j.gendis.2018.01.002. [DOI] [PMC free article] [PubMed] [Google Scholar]
- 11.Cardona A, Day FR, Perry JRB, et al Epigenome-wide association study of incident type 2 diabetes in a British population: EPIC-Norfolk study. Diabetes db180290. 2019; [DOI] [PMC free article] [PubMed]
- 12.Wahl S, Drong A, Lehne B, et al. Epigenome-wide association study of body mass index, and the adverse outcomes of adiposity. Nature. 2017;541(7635):81–86. doi: 10.1038/nature20784. [DOI] [PMC free article] [PubMed] [Google Scholar]
- 13.2. Classification and diagnosis of diabetes: <em>Standards of Medical Care in Diabetes—2019</em> Diabetes Care 42(Supplement 1) 2019;S13 LP-S28. 10.2337/dc19-S002 [DOI] [PubMed]
- 14.Lowsky DJ, Olshansky SJ, Bhattacharya J, Goldman DP. Heterogeneity in healthy aging. The Journals of Gerontology: Series A. 2013;69(6):640–649. doi: 10.1093/gerona/glt162. [DOI] [PMC free article] [PubMed] [Google Scholar]
- 15.Jylhävä J, Pedersen NL, Hägg S. Biological age predictors EBioMedicine. 2017;21:29–36. doi: 10.1016/j.ebiom.2017.03.046. [DOI] [PMC free article] [PubMed] [Google Scholar]
- 16.Horvath S. DNA methylation age of human tissues and cell types. Genome Biol. 2013;14(10):R115. doi: 10.1186/gb-2013-14-10-r115. [DOI] [PMC free article] [PubMed] [Google Scholar]
- 17.Lu AT, Quach A, Wilson JG, et al. DNA methylation GrimAge strongly predicts lifespan and healthspan. Aging. 2019;11(2):303–327. doi: 10.18632/aging.101684. [DOI] [PMC free article] [PubMed] [Google Scholar]
- 18.Hannum G, Guinney J, Zhao L, et al. Genome-wide methylation profiles reveal quantitative views of human aging rates. Mol Cell. 2013;49(2):359–367. doi: 10.1016/j.molcel.2012.10.016. [DOI] [PMC free article] [PubMed] [Google Scholar]
- 19.Levine ME, Lu AT, Quach A, et al. An epigenetic biomarker of aging for lifespan and healthspan. Aging. 2018;10(4):573–591. doi: 10.18632/aging.101414. [DOI] [PMC free article] [PubMed] [Google Scholar]
- 20.Hillary RF, Stevenson AJ, McCartney DL, et al. Epigenetic measures of ageing predict the prevalence and incidence of leading causes of death and disease burden. Clin Epigenetics. 2020;12(1):115. doi: 10.1186/s13148-020-00905-6. [DOI] [PMC free article] [PubMed] [Google Scholar]
- 21.Grant CD, Jafari N, Hou L, et al. A longitudinal study of DNA methylation as a potential mediator of age-related diabetes risk. Geroscience. 2017;39(5–6):475–489. doi: 10.1007/s11357-017-0001-z. [DOI] [PMC free article] [PubMed] [Google Scholar]
- 22.Walaszczyk E, Luijten M, Spijkerman AMW, et al. DNA methylation markers associated with type 2 diabetes, fasting glucose and HbA1c levels: a systematic review and replication in a case–control sample of the Lifelines study. Diabetologia. 2018;61(2):354–368. doi: 10.1007/s00125-017-4497-7. [DOI] [PMC free article] [PubMed] [Google Scholar]
- 23.Fraszczyk E, Spijkerman AMW, Zhang Y, et al. Epigenome-wide association study of incident type 2 diabetes: a meta-analysis of five prospective European cohorts. Diabetologia. 2022;65(5):763–776. doi: 10.1007/s00125-022-05652-2. [DOI] [PMC free article] [PubMed] [Google Scholar]
- 24.Verschuren W, Blokstra A, Picavet H, Smit H. Cohort profile: the Doetinchem Cohort Study. Int J Epidemiol. 2008;37(6):1236–1241. doi: 10.1093/ije/dym292. [DOI] [PubMed] [Google Scholar]
- 25.Picavet HSJ, Blokstra A, Spijkerman AMW, Verschuren WMM. Cohort profile update: the Doetinchem Cohort Study 1987–2017: lifestyle, health and chronic diseases in a life course and ageing perspective. Int J Epidemiol. 2017;46(6):1751–1751g. doi: 10.1093/ije/dyx103. [DOI] [PMC free article] [PubMed] [Google Scholar]
- 26.WHO Classification of diabetes mellitus. https://apps.who.int/iris/handle/10665/325182
- 27.Miller SA, Dykes DD, Polesky HF. A simple salting out procedure for extracting DNA from human nucleated cells. Nucleic Acids Res. 1988;16(3):1215. doi: 10.1093/nar/16.3.1215. [DOI] [PMC free article] [PubMed] [Google Scholar]
- 28.Aryee MJ, Jaffe AE, Corrada-Bravo H, et al. Minfi: a flexible and comprehensive Bioconductor package for the analysis of Infinium DNA methylation microarrays. Bioinformatics. 2014;30(10):1363–1369. doi: 10.1093/bioinformatics/btu049. [DOI] [PMC free article] [PubMed] [Google Scholar]
- 29.Ritchie ME, Phipson B, Wu D, et al. limma powers differential expression analyses for RNA-sequencing and microarray studies. Nucleic Acids Res. 2015;43(7):e47–e47. doi: 10.1093/nar/gkv007. [DOI] [PMC free article] [PubMed] [Google Scholar]
- 30.Johnson WE, Li C, Rabinovic A. Adjusting batch effects in microarray expression data using empirical Bayes methods. Biostatistics. 2007;8(1):118–127. doi: 10.1093/biostatistics/kxj037. [DOI] [PubMed] [Google Scholar]
- 31.Houseman EA, Accomando WP, Koestler DC, et al. DNA methylation arrays as surrogate measures of cell mixture distribution. BMC Bioinformatics. 2012;13:86. doi: 10.1186/1471-2105-13-86. [DOI] [PMC free article] [PubMed] [Google Scholar]
- 32.Sharp GC, Arathimos R, Reese SE, et al. Maternal alcohol consumption and offspring DNA methylation: findings from six general population-based birth cohorts. Epigenomics. 2018;10(1):27–42. doi: 10.2217/epi-2017-0095. [DOI] [PMC free article] [PubMed] [Google Scholar]
- 33.DNA methylation age and the epigenetic clock. http://labs.genetics.ucla.edu/horvath/htdocs/dnamage/
- 34.Kulkarni H, Kos MZ, Neary J, et al. Novel epigenetic determinants of type 2 diabetes in Mexican-American families. Hum Mol Genet. 2015;24(18):5330–5344. doi: 10.1093/hmg/ddv232. [DOI] [PMC free article] [PubMed] [Google Scholar]
- 35.Chambers JC, Loh M, Lehne B, et al. Epigenome-wide association of DNA methylation markers in peripheral blood from Indian Asians and Europeans with incident type 2 diabetes: a nested case-control study. Lancet Diabetes Endocrinol. 2015;3(7):526–534. doi: 10.1016/S2213-8587(15)00127-8. [DOI] [PMC free article] [PubMed] [Google Scholar]
- 36.Al Muftah WA, Al-Shafai M, Zaghlool SB, et al. Epigenetic associations of type 2 diabetes and BMI in an Arab population. Clin Epigenetics. 2016;8:13. doi: 10.1186/s13148-016-0177-6. [DOI] [PMC free article] [PubMed] [Google Scholar]
- 37.Pinheiro JC, Bates DJ, DebRoy S, Sakar D The Nlme package: linear and nonlinear mixed effects models, R Version. 2012;3
- 38.Li M, Zou D, Li Z, et al. EWAS Atlas: a curated knowledgebase of epigenome-wide association studies. Nucleic Acids Res. 2019;47(D1):D983–D988. doi: 10.1093/nar/gky1027. [DOI] [PMC free article] [PubMed] [Google Scholar]
- 39.Kriebel J, Herder C, Rathmann W, et al. Association between DNA methylation in whole blood and measures of glucose metabolism: KORA F4 study. PLoS ONE. 2016;11(3):e0152314. doi: 10.1371/journal.pone.0152314. [DOI] [PMC free article] [PubMed] [Google Scholar]
- 40.Soriano-Tárraga C, Jiménez-Conde J, Giralt-Steinhauer E, et al. Epigenome-wide association study identifies TXNIP gene associated with type 2 diabetes mellitus and sustained hyperglycemia. Hum Mol Genet. 2016;25(3):609–619. doi: 10.1093/hmg/ddv493. [DOI] [PubMed] [Google Scholar]
- 41.Florath I, Butterbach K, Heiss J, et al. Type 2 diabetes and leucocyte DNA methylation: an epigenome-wide association study in over 1,500 older adults. Diabetologia. 2016;59(1):130–138. doi: 10.1007/s00125-015-3773-7. [DOI] [PubMed] [Google Scholar]
- 42.Duran J, Obach M, Navarro-Sabate A, et al. Pfkfb3 is transcriptionally upregulated in diabetic mouse liver through proliferative signals. The FEBS Journal. 2009;276(16):4555–4568. doi: 10.1111/j.1742-4658.2009.07161.x. [DOI] [PubMed] [Google Scholar]
- 43.Tobi EW, Slieker RC, Luijk R, et al DNA methylation as a mediator of the association between prenatal adversity and risk factors for metabolic disease in adulthood. Science Advances. 2018;4(1). 10.1126/sciadv.aao4364 [DOI] [PMC free article] [PubMed]
- 44.Stover PJ, Field MS. Vitamin B-6. Adv Nutr. 2015;6(1):132–133. doi: 10.3945/an.113.005207. [DOI] [PMC free article] [PubMed] [Google Scholar]
- 45.Mascolo E, Vernì F Vitamin B6 and diabetes: relationship and molecular mechanisms. International Journal of Molecular Sciences. 2020;21(10). 10.3390/ijms21103669 [DOI] [PMC free article] [PubMed]
- 46.Nix WA, Zirwes R, Bangert V, et al. Vitamin B status in patients with type 2 diabetes mellitus with and without incipient nephropathy. Diabetes Research and Clinical Practice. 2015;107(1):157–165. doi: 10.1016/j.diabres.2014.09.058. [DOI] [PubMed] [Google Scholar]
- 47.Ahn HJ, Min KW, Cho Y-O. Assessment of vitamin B(6) status in Korean patients with newly diagnosed type 2 diabetes. Nutr Res Pract. 2011;5(1):34–39. doi: 10.4162/nrp.2011.5.1.34. [DOI] [PMC free article] [PubMed] [Google Scholar]
- 48.Satyanarayana A, Balakrishna N, Pitla S, et al. Status of B-vitamins and homocysteine in diabetic retinopathy: association with vitamin-B12 deficiency and hyperhomocysteinemia. PLOS ONE. 2011;6(11):e26747. doi: 10.1371/journal.pone.0026747. [DOI] [PMC free article] [PubMed] [Google Scholar]
- 49.Ligthart S, Marzi C, Aslibekyan S, et al. DNA methylation signatures of chronic low-grade inflammation are associated with complex diseases. Genome Biol. 2016;17(1):255. doi: 10.1186/s13059-016-1119-5. [DOI] [PMC free article] [PubMed] [Google Scholar]
- 50.del Gomez-Alonso M, C, Kretschmer A, Wilson R, , et al. DNA methylation and lipid metabolism: an EWAS of 226 metabolic measures. Clin Epigenetics. 2021;13(1):7. doi: 10.1186/s13148-020-00957-8. [DOI] [PMC free article] [PubMed] [Google Scholar]
- 51.Truong V, Huang S, Dennis J, et al. Blood triglyceride levels are associated with DNA methylation at the serine metabolism gene PHGDH. Sci Rep. 2017;7(1):11207. doi: 10.1038/s41598-017-09552-z. [DOI] [PMC free article] [PubMed] [Google Scholar]
- 52.Hedman ÅK, Mendelson MM, Marioni RE, et al. Epigenetic patterns in blood associated with lipid traits predict incident coronary heart disease events and are enriched for results from genome-wide association studies. Circ Cardiovasc Genet. 2017;10(1):e001487. doi: 10.1161/CIRCGENETICS.116.001487. [DOI] [PMC free article] [PubMed] [Google Scholar]
- 53.Mendelson MM, Marioni RE, Joehanes R, et al. Association of body mass index with DNA methylation and gene expression in blood cells and relations to cardiometabolic disease: a Mendelian randomization approach. PLoS Med. 2017;14(1):e1002215. doi: 10.1371/journal.pmed.1002215. [DOI] [PMC free article] [PubMed] [Google Scholar]
- 54.Eberlé D, Clément K, Meyre D, et al. SREBF-1 gene polymorphisms are associated with obesity and type 2 diabetes in French obese and diabetic cohorts. Diabetes. 2004;53(8):2153–2157. doi: 10.2337/diabetes.53.8.2153. [DOI] [PubMed] [Google Scholar]
- 55.Ali O, Cerjak D, Kent JW, Jr, et al. Methylation of SOCS3 is inversely associated with metabolic syndrome in an epigenome-wide association study of obesity. Epigenetics. 2016;11(9):699–707. doi: 10.1080/15592294.2016.1216284. [DOI] [PMC free article] [PubMed] [Google Scholar]
- 56.Bacos K, Gillberg L, Volkov P, et al. Blood-based biomarkers of age-associated epigenetic changes in human islets associate with insulin secretion and diabetes. Nat Commun. 2016;7:11089. doi: 10.1038/ncomms11089. [DOI] [PMC free article] [PubMed] [Google Scholar]
- 57.Rönn T, Volkov P, Gillberg L, et al. Impact of age, BMI and HbA1c levels on the genome-wide DNA methylation and mRNA expression patterns in human adipose tissue and identification of epigenetic biomarkers in blood. Hum Mol Genet. 2015;24(13):3792–3813. doi: 10.1093/hmg/ddv124. [DOI] [PubMed] [Google Scholar]
- 58.Field AE, Robertson NA, Wang T, Havas A, Ideker T, Adams PD. DNA methylation clocks in aging: categories, causes, and consequences. Mol Cell. 2018;71:882–895. doi: 10.1016/j.molcel.2018.08.008. [DOI] [PMC free article] [PubMed] [Google Scholar]
- 59.Li X, Ploner A, Wang Y, et al. Longitudinal trajectories, correlations and mortality associations of nine biological ages across 20-years follow-up. Elife. 2020;9:e51507. doi: 10.7554/eLife.51507. [DOI] [PMC free article] [PubMed] [Google Scholar]
- 60.el Khoury LY, Gorrie-Stone T, Smart M, et al. Systematic underestimation of the epigenetic clock and age acceleration in older subjects. Genome Biol. 2019;20(1):283. doi: 10.1186/s13059-019-1810-4. [DOI] [PMC free article] [PubMed] [Google Scholar]
- 61.Lee K, Pausova Z Cigarette smoking and DNA methylation. Frontiers in Genetics. 2013;4 [DOI] [PMC free article] [PubMed]
- 62.Marioni RE, Shah S, McRae AF, et al. DNA methylation age of blood predicts all-cause mortality in later life. Genome Biol. 2015;16(1):25. doi: 10.1186/s13059-015-0584-6. [DOI] [PMC free article] [PubMed] [Google Scholar]
- 63.Perna L, Zhang Y, Mons U, Holleczek B, Saum KU, Brenner H. Epigenetic age acceleration predicts cancer, cardiovascular, and all-cause mortality in a German case cohort. Clin Epigenetics. 2016;8(1):64. doi: 10.1186/s13148-016-0228-z. [DOI] [PMC free article] [PubMed] [Google Scholar]
- 64.Zheng Y, Joyce BT, Colicino E, et al. Blood epigenetic age may predict cancer incidence and mortality. EBioMedicine. 2016;5:68–73. doi: 10.1016/j.ebiom.2016.02.008. [DOI] [PMC free article] [PubMed] [Google Scholar]
- 65.Joyce BT, Gao T, Zheng Y, et al. Epigenetic age acceleration reflects long-term cardiovascular health. Circ Res. 2021;129(8):770–781. doi: 10.1161/CIRCRESAHA.121.318965. [DOI] [PMC free article] [PubMed] [Google Scholar]
- 66.Hillary RF, Stevenson AJ, Cox SR, et al. An epigenetic predictor of death captures multi-modal measures of brain health. Mol Psychiatry. 2021;26(8):3806–3816. doi: 10.1038/s41380-019-0616-9. [DOI] [PMC free article] [PubMed] [Google Scholar]
- 67.Verschoor CP, Lin DTS, Kobor MS, et al. Epigenetic age is associated with baseline and 3-year change in frailty in the Canadian Longitudinal Study on Aging. Clin Epigenetics. 2021;13(1):163. doi: 10.1186/s13148-021-01150-1. [DOI] [PMC free article] [PubMed] [Google Scholar]
Associated Data
This section collects any data citations, data availability statements, or supplementary materials included in this article.