

Abstract
Adults aged 60 and over are most vulnerable to mild traumatic brain injury (mTBI). Nevertheless, the extent to which chronological age (CA) at injury affects TBI-related brain aging is unknown. This study applies Gaussian process regression to T1-weighted magnetic resonance images (MRIs) acquired within 7 days and again 6 months after a single mTBI sustained by 133 participants aged 20–83 (CA = 42.6 ± 17 years; 51 females). Brain BAs are estimated, modeled, and compared as a function of sex and CA at injury using a statistical model selection procedure. On average, the brains of older adults age by 15.3 ± 6.9 years after mTBI, whereas those of younger adults age only by 1.8 ± 5.6 years, a significant difference (Welch’s t32 = − 9.17, p ≃ 9.47 × 10⁻¹¹). For an adult aged 30 to 60, the expected amount of TBI-related brain aging is 3 years greater than in an individual younger by a decade. For an individual over 60, the respective amount is 7 years. Despite no significant sex differences in brain aging (Welch’s t108 = 0.78, p > 0.78), the statistical test is underpowered. BAs estimated at acute baseline versus chronic follow-up do not differ significantly (t264 = 0.41, p > 0.66, power = 80%), suggesting negligible TBI-related brain aging during the chronic stage of TBI despite accelerated aging during the acute stage. Our results indicate that a single mTBI sustained after age 60 involves approximately 10 years of premature and lasting brain aging, which is MRI detectable as early as 7 days post-injury.
Keywords: Magnetic resonance imaging, Neurodegeneration, Machine learning, Biological age, Chronological age
Introduction
The chronological age () of an individual increases linearly with time. By contrast, biological age () increases can be nonlinear due to their dependence on genetics, environment, and their interaction [1]. In typically aging adults of the same , the expected value is approximately equal to because the average rate of biological aging is about equal to that of chronological aging. Thus, the difference between an individual’s and her/his reflects whether that individual is aging relatively faster or slower compared to typically aging individuals of the same . If one’s is younger than one’s , one is biologically younger than expected; conversely, if exceeds , one is biologically older than expected [1]. The difference between and , commonly referred to as age gap (, occasionally abbreviated as , which stands for brain age gap), reflects the extent to which biological senescence, which is associated with disease risk and mortality [2], deviates from its expected amount [3].
Due to the deleterious effects of mild traumatic brain injury (mTBI) upon neural structure and function, this condition is a risk factor for both accelerated brain aging and neurodegenerative diseases [4–6]. Because reflects excessive structural and physiological aging, brain is strongly associated with cognitive decline and with risk of death from conditions like Alzheimer’s and Parkinson’s diseases [7–9]. Thus, to assist efforts aimed at delaying or mitigating neurological disease, it can be useful to early identify individuals at high risk for accelerated brain aging.
In the context of TBI, brain estimates derived from magnetic resonance imaging (MRI) are thought to reflect TBI-related neuroanatomic deviations from normality [7–9]. This study uses T1-weighted MRIs and Gaussian process regression to approximate brain in 133 mTBI participants imaged both 7 days and 6 months after their first (and only) mTBI. This is the first study that leverages MRI to quantify how sex and at injury affect brain aging after TBI. Our findings can assist (A) stratification of TBI patients based on their risk for accelerated brain aging and cognitive impairment, (B) personalized assessment of neurological disease risk after TBI, and (C) identification of TBI victims who could benefit from lifestyle changes and/or other interventions.
Methods
Participants
This study was undertaken in adherence with the US Code of Federal Regulations (45 CFR 46) and with approval from the institutional review boards or similar ethical monitoring bodies at the respective institutions where data had been acquired. A total of 3377 healthy controls (HCs, age = 40.6 ± 21.4 years (y), range: 18–92 y) were included in the training set of Cole et al. [7, 10, 11]. A total of 133 mTBI patients (age = 42.6 ± 17.0 years (y), range: 20–83 y; 51 females) were enrolled. Subjects were recruited with the assistance of board-certified clinicians and/or other health professionals who had treated them as outpatients and who had referred them for assessment and/or neuroimaging. Recruitment bias was reduced by inviting all volunteers to participate if they satisfied the study’s inclusion/exclusion criteria and if they could provide written informed consent. To be included, mTBI patients had to have (a) MRIs acquired 6 months post-injury at 3 T, (b) a single mTBI due to a ground-level fall, (c) no clinical findings on acute T1- or T2-weighted MRI, (d) an acute Glasgow Coma Scale score greater than 12 (μ = 14.4, σ = 0.6) upon initial medical evaluation, (e) loss of consciousness of fewer than 30 min (μ ≃ 13 min, σ ≃ 5 min), and (f) post-traumatic amnesia of fewer than 24 h (μ ≃ 5.2 h, σ ≃ 3.5 h). Exclusion criteria included (a) a documented clinical history of pre-traumatic neurological disease, psychiatric disorder, and/or drug/alcohol abuse (including any TBI sustained prior to their last) and (b) MRI contraindications.
Neuroimaging and cognitive assessments
MRIs were acquired at two timepoints, i.e., 7 days and 6 months after injury (corresponding to the acute baseline and chronic follow-up phases of TBI, respectively). T1-weighted MRIs were collected using a 3D magnetization-prepared rapid acquisition gradient echo sequence with repetition time (TR) = 1950 ms, echo time (TE) = 2.98 ms, inversion time (TI) = 900 ms, and voxel size = 1.0 mm × 1.0 mm × 1.0 mm. T2-weighted MRIs were acquired with TR = 2500 ms, TE = 360 ms, and voxel size = 1.0 mm × 1.0 mm × 1.0 mm. Prior to analysis, all MRIs were de-identified and de-linked. The average interval between imaging sessions was ± = 5.6 ± 0.3 months (range: 0.51 to 6.3 months). Cognitive functioning was assessed using the Brief Test of Adult Cognition by Telephone (BTACT) [12, 13], which quantifies episodic verbal memory (EVM; immediate recall: EVMI; delayed recall: EVMD) of words on a 15-item list, working memory span (WMS, evaluated using a backward digit span task), inductive reasoning (IR, measured using a number series completion task), processing speed (PS, assessed using a backward counting task), and verbal fluency (VF, evaluated using a category fluency task).
estimation
estimates were obtained within R software [14] using brainageR version 2.0 [7, 10, 11], which leverages T1-weighted MRIs for Gaussian process regression using kernlab [15], and which was instantiated with default parameters [7, 10, 11]. This nonparametric statistical approach [16] uses Bayesian inference to constrain the complexity of a statistical model learned from the training sample of 3377 HCs described previously. In contrast to regression (where the effects of predictors on dependent variables are studied), brainageR is a machine learning approach acting like a black-box, in the sense that users are not provided interpretable insights on the MRI features being used to estimate . Because the Gaussian process regression model was trained on a reference sample of HCs, this framework provides the setting to compare any diseased population’s rate of aging against the typical (healthy) rate of aging. In our context, the model of Cole et al. facilitates our comparison of mTBI participants against Cole et al.’s reference sample of HCs. Our own model proceeds to estimate brain for subjects in our test sample (TBI participants) using the model of Cole et al., which was trained on HCs’ MRI features.
Suppose that the MRI features of a TBI participant best resemble those of MRIs acquired from HCs who are chronologically older than the TBI participant by an amount equal to the , defined as . Then, it follows that the TBI participant is biologically older than expected for HC individuals of her/his , i.e., and . Conversely, if the TBI participant’s MRI features best resemble those of MRIs acquired from HCs who are chronologically younger than the participant, then and . Finally, if the TBI participant’s MRI features best resemble those of MRIs acquired from HCs who are of about the same as the participant, then and ≃ 0. If a TBI participant has a positive , then her/his brain is older than expected for a typical HC of the same as the TBI participant. Similarly, if a TBI participant has a negative , then her/his brain is younger than expected for a typical HC of the same as the TBI participant. In summary, is the difference between observed and expected brain age.
bias correction and modelling
Estimating using brainageR involves an inherent bias [11, 17], in that estimates are poorer and poorer for subjects whose s differ more and more from their sample mean [17, 18]. This is partly due to the distributional robustness properties of linear statistical estimators, which is closely related to the empirical influence function of the sample [19]. To correct this estimation bias, we follow the approach of Beheshti et al. [17], who modeled (the biased value of the , where stands for biased) using a polynomial function of the form . Here, is the coefficient of the -th power of in the polynomial describing , and is the order of the model (polynomial), i.e., the highest power of included in the model. A linear model, which is a special case of this formulation, is often most appropriate for samples whose brain aging is typical [17]. TBI, however, often involves brain s that are older than expected [11], which may suggest accelerated brain aging after TBI, at least in some cases. If this is true, then the relationship between , on the one hand, and both and , on the other hand, may be nonlinear. For this reason, a linear relationship between and was not assumed here. Instead, the most suitable model order (i.e., value of ) was identified using a strategy described in the following section. s were corrected using the formula , where stands for corrected. The (bias-corrected ) is . Hence forward, unless otherwise noted, and are assumed to have been bias-corrected, i.e., and refer to and , respectively. Relatedly, can be used to quantify the brain’s rate of post-traumatic biological aging as a function of . Because could change nonlinearly with time as a function of at injury, we model as a function of using a polynomial function and determine the most appropriate order of this polynomial as described below. Of note, bias correction accounts for an inherent nuisance effect pertaining to estimation; this correction does not remove the dependence of on . Bias-corrected can be modeled as a function of age at injury and of sex.
Model selection
To identify the most appropriate order of the polynomial model for bias correction, we use the compare function in MATLAB (MathWorks, Natick, MA) to pairwise-compare polynomial models for that had different values of . The compare function calculates the Akaike and Bayesian information criteria of two input models and uses a likelihood ratio test to determine which model best explains the underlying data without overfitting. Under the null hypothesis , the observed likelihood ratio test statistic is Wilks’ , which has an approximate χ2 reference distribution (see chapter 5 in [20]). When comparing two models, compare computes the value for the likelihood ratio test by comparing the observed value of against this χ2 distribution. To implement the simulated likelihood ratio test, compare first generates the reference distribution of under . Then, it assesses the statistical significance of the alternate (higher order) model by comparing against this reference distribution [21, 22]. The number of degrees of freedom of is equal to = , where and are the degrees of freedom for the models associated with the null and alternative hypotheses, respectively. In our case, is the difference between the orders of the polynomials used in the models being compared; for example, when comparing a fourth-order model to a seventh-order model, = 7 – 4 = 3. A similar procedure was implemented to identify the most suitable order of the polynomial function modeling the (bias-corrected) as a function of . Thus, model selection was implemented for two distinct purposes: (A) to identify how best to model as a function of and, thereby, to correct estimates and obtain (bias-corrected) values, and (B) to model as a function of . The ability of each model for bias correction to capture cognitive function was evaluated by comparing the correlations between cognitive scores and , in the scenarios where the latter was estimated using first- to fourth-order polynomial models.
Statistical analysis
Our analysis involves three statistical factors: age, sex, and time. Age and sex are between-subject factors whereas time is a within-subject factor with two repeated measures (acute baseline and chronic follow-up). Let denote the age gap for level of statistical factor . For example, and are (bias-corrected) s measured at the baseline and follow-up timepoints, respectively. Part I of our analysis seeks to investigate, systematically, how each factor affects (and therefore brain aging); part II aims to study differences between distinct levels of each factor.
In part I, the overall objective is to test null hypotheses of the form provided that the statistical test has statistical power of at least 80% (although typical for neuroimaging studies, this power threshold is admittedly somewhat arbitrary). Student’s tests are used to infer if there is significant TBI-related brain aging within cohort subgroups. First, across both sexes, we tested (i.e., the significance of TBI-related brain aging) at each timepoint within distinct age groupings. The first such grouping involves (A) younger adults (YAs) and older adults (OAs), results being reported and tabulated separately for YAs and OAs. The second group involves (B) decadal age groups (i.e., = 20–29 y, = 30–39 y, …, = 60–69 y, = 70–83), results being reported and tabulated separately for each. This analysis was repeated for males (C: YAs and OAs; D: decadal groups) and females (E: YAs and OAs; F: decadal groups) separately. A table was created to list results for A, B, C, D, E, and F above under headings labeled accordingly, i.e., in this alphabetical order. One motivation for focusing carefully and systematically on each of these age groups during our analysis is the fact that age at injury is a major biological factor influencing treatment adherence [23]. For example, in patients with severe TBI, YAs adhere to their caretakers’ advice more strictly than OAs. By contrast, after mild-to-moderate TBI, OAs adhere to caretakers’ advice more strictly than YAs [23]. Furthermore, age at injury is a major factor influencing clinical guidelines and decision making [24].
Part II involves identifying significant age gap differences between levels and () of each factor . In this part of the analysis, if there is adequate power, factor levels are compared by testing null hypotheses of the form . Welch’s tests for samples with unequal variances are used to infer if there is any significant difference in TBI-related brain aging between timepoints across participants of any age or sex (step A), between YAs and OAs of either sex at either timepoint (steps B and C), between successive decadal age groups (e.g., vs. , vs. , etc.) comprising participants of either sex (step D), between decadal age groups comprising participants of each sex (step E), or between the sexes for participants of any age in each decadal age group (steps F and G). A table was created to list results for steps A through G above under headings labeled accordingly, i.e., in this alphabetical order.
Results
Correction of estimation bias
Table 1 summarizes correction using polynomials whose orders are determined via model selection. Our results identify the fourth-order model as most suitable ( = 7.0747, = 0.0078), under the combined requirement of both parsimony (fewer model parameters) and higher likelihood to have generated the data. The fourth-order model exhibits significantly larger likelihood ratios than all lower-order models, and no model of order higher than 4 (except the fifth-order model) has a likelihood ratio significantly larger than that of the fourth-order model. Although the fifth-order model has a higher likelihood ratio than the fourth-order model, the former can be rejected as biologically implausible because it yields improbable values ( = 125.8 y, = 160.3 y, range: − 50.4 to 789.2 y).
Table 1.
Likelihood ratios and associated values for the comparisons of bias correction models of order = 1, …, 6
| 2 | 3 | 4 | 5 | 6 | ||
|---|---|---|---|---|---|---|
| 1 | 0.0098 | 0.0002 | < 0.0001 | < 0.0001 | < 0.0001 | |
| 6.6657 | 16.8480 | 23.9220 | 39.5820 | 41.1050 | ||
| 2 | 0.0014 | 0.0002 | < 0.0001 | < 0.0001 | ||
| 10.1820 | 17.2570 | 32.9160 | 34.4390 | |||
| 3 | 0.0078 | < 0.0001 | < 0.0001 | |||
| 7.0747 | 22.7340 | 24.2570 | ||||
| 4 | < 0.0001 | 0.0002 | ||||
| 15.6600 | 17.1820 | |||||
| 5 | 0.2172 | |||||
| 1.5229 |
Each cell specifies the likelihood ratio and value associated with testing the null hypothesis that the model whose order is indicated by the column header captures more information than the model whose order is specified in the row header. For example, for row 3 and column 4, the table indicates that the model of order 4 captures significantly more information in the data than the model of order 3 ( = 0.0078, = 7.0747). A larger value of the likelihood ratio test statistic indicates that a higher-order model captures more information than a lower-order model. For all model comparisons, has degrees of freedom () equal to the difference in order of the models (see “Methods” section). For example, for row 3 and column 5, = 5 − 3 = 2
For YAs, across the four polynomial orders used for bias correction, Spearman’s rank correlation coefficient between and each cognitive measure was within a range that differed from their mean by at most 2% (Table 2). By contrast, for OAs, the fourth-order correction yielded values of whose magnitudes were 18% (EVMD) to 106% (PS) larger than those obtained using the first-order correction. The second- and third-order corrections typically yielded values of whose magnitudes were larger than those of the first-order correction but smaller than those of the fourth-order correction.
Table 2.
Comparison of first-, second-, third-, and fourth-order ( = 1, 2, 3, 4) bias correction effects on Spearman’s rank correlation coefficient between (as corrected using a polynomial of respective order) and cognitive measures (EVMI, EVMD, WMS, IR, PS, and VF) for (A) YAs and (B) OAs
| (A) YAs | ||||||||||||
| EVMI | EVMD | WMS | IR | PS | VF | |||||||
| m | ρ | ∆ | ρ | ∆ | ρ | ∆ | ρ | ∆ | ρ | ∆ | ρ | ∆ |
| 1 | -0.54 | 0 | -0.62 | 0 | -0.37 | 0 | –0.54 | 0 | –0.67 | 0 | –0.39 | 0 |
| 2 | –0.54 | 0 | –0.62 | 0 | –0.37 | 0 | –0.53 | 1 | –0.67 | 0 | –0.39 | 0 |
| 3 | –0.53 | 1 | –0.63 | 0 | –0.37 | 0 | –0.53 | 1 | –0.67 | 0 | –0.39 | 0 |
| 4 | –0.54 | 0 | –0.62 | 0 | –0.37 | 0 | –0.53 | 1 | –0.67 | 0 | –0.40 | 1 |
| (B) OAs | ||||||||||||
| EVMI | EVMD | WMS | IR | PS | VF | |||||||
| m | ρ | ∆ | ρ | ∆ | ρ | ∆ | ρ | ∆ | ρ | ∆ | ρ | ∆ |
| 1 | –0.14 | 0 | –0.38 | 0 | –0.25 | 0 | –0.23 | 0 | –0.09 | 0 | –0.22 | 0 |
| 2 | –0.06 | 60 | –0.34 | 12 | –0.16 | 36 | –0.18 | 24 | –0.04 | 57 | –0.14 | 35 |
| 3 | –0.06 | 57 | –0.34 | 12 | –0.16 | 36 | –0.18 | 24 | –0.04 | 54 | –0.14 | 35 |
| 4 | –0.28 | –105 | –0.45 | –18 | –0.40 | –60 | –0.32 | –39 | –0.18 | –106 | –0.34 | –58 |
Δ is the mean percentage difference in , computed across subjects, between (i) corrected using a polynomial of order 1, and (ii) corrected using a polynomial of order . In other words, Δ = [() – (1)]/(1), where () is corrected using a polynomial of order . Thus, for OAs’ scores, the fourth-order model correction results in a correlation between corrected s and EVMI scores whose magnitude is 105% larger, on average, than in the scenario where is corrected using a first-order polynomial
EVMD episodic verbal memory—delayed recall, EVMI episodic verbal memory—immediate recall, IR inductive reasoning, OA old adult, PS processing speed, VF verbal fluency, WMS working memory span, YA young adult
Descriptive statistics for s corrected using a fourth-order polynomial are provided in Table 3, which indicates that the average amount of TBI-related brain aging sustained by YAs and OAs is 1.8 ± 1.5 y and 15.3 ± 14.2 y, respectively, a significant difference. Tallying participants by decadal age group confirms that the average amount of TBI-related brain aging is relatively modest in adults under 60, but quite substantial in older ones.
Table 3.
Relationship betweenandat injury by age group
| CA | N | BA | AG | CI (AG) | |||||
|---|---|---|---|---|---|---|---|---|---|
| TP1 | TP2 | TP1 | TP2 | TP1 | TP2 | ||||
| (A) YAs and OAs | |||||||||
| 20 – 59 | 108 | 38.1 | 38.3 | 1.8 | 1.5 | –9.4, | 13.4 | –10.4, | 12.2 |
| 60 – 83 | 25 | 84.8 | 84.1 | 15.3 | 14.2 | 1.6, | 28.6 | –0.2, | 29.3 |
| (B) decadal age groups | |||||||||
| 20 – 29 | 43 | 23.9 | 23.1 | –0.3 | –1.4 | –10.6, | 8.8 | –11.6, | 4.5 |
| 30 – 39 | 25 | 35.1 | 35.5 | 2.3 | 2.2 | –9.7, | 13.9 | –9.5, | 9.8 |
| 40 – 49 | 17 | 45.7 | 44.9 | 3.8 | 3.0 | –6.9, | 13.0 | –7.1, | 11.2 |
| 50 – 59 | 23 | 51.2 | 52.9 | 3.5 | 5.0 | –6.9, | 16.7 | –6.7, | 11.6 |
| 60 – 69 | 14 | 65.7 | 66.2 | 12.8 | 13.7 | –0.1, | 25.0 | 2.3, | 21.3 |
| 70 – 83 | 11 | 77.2 | 73.9 | 18.5 | 14.9 | 6.1, | 33.0 | –3.3, | 26.0 |
Listed are average bias-correcteds for (A) YAs (20–59 y) vs. OAs (60–83 y), as well as for (B) eachdecadal age group (20–29 y, 30–39 y, etc.). Also provided are sample sizes (), means, and their 95% CIs for both the acute and chronic timepoint (TP1 and TP2, respectively). All results are reported in years and are based on bias-correctedestimates
age gap,chronological age, CI confidence interval, TP timepoint
Brain aging as a function of at injury
Based on the optimal model identified by model selection, our results indicate that (bias-corrected) s increase monotonically with at injury. Results also indicate that s are better modeled by a second-order polynomial than by a first-order one ( = 21.9, = 2.9 × 10⁻⁶, Table 4). For this reason, a second-order polynomial is used in this study to model s as a function of . Figure 1 displays, along the horizontal axis, at injury, and, along the vertical axis, s that are uncorrected (1A), linearly corrected (1B), and quartically corrected (1C). After linear correction (Fig. 1B), s suggest a biologically implausible negative trend with . This misleading impression is rectified by the quartic correction, which not only achieves parsimony (Table 1), but also obviates the nonlinear increase in s with . Table 3 lists (bias-corrected) s and their associated s for each timepoint and every age group. Table 3A contains results for YAs and OAs, whereas (decadal) age group results are listed Table 3B. Notably, the mean s of OAs (who coincide with participants in the decadal age groups and ) reflect the quadratic increase with (Fig. 1). Figure 2 illustrates how this trend is paralleled by structural brain changes on T1-weighted MRIs in a pair of YAs and in a pair of OAs (one TBI participant and HC in each pair). Figure 2 illustrates how YAs, regardless of diagnosis status (YA HC: Fig. 2A; YAs with TBI: 2B), experience smaller decreases in brain size and smaller increases in lateral ventricle size, over comparable time intervals, than OAs (HC OA: Fig. 2C; OA with TBI: 2D). The brain features indicative of post-traumatic atrophy in the YAs with TBI (Fig. 2B) are subtler than those of the OAs with TBI (Fig. 2D), who exhibit greater brain atrophy (e.g., appreciable sulcal widening, greater lateral ventricle increases than the HC OAs; Fig. 2C), in agreement with our findings of significantly greater brain aging in OAs.
Table 4.
Like Table 1, for the model selection to identify the optimal order of the polynomial describing as a function of
| 2 | 3 | ||
|---|---|---|---|
| 1 | < 0.0001 | < 0.0001 | |
| 21.9040 | 22.2000 | ||
| 2 | 0.5859 | ||
| 0.2968 |
All s are bias corrected
corrected age gap, chronological age
Fig. 1.
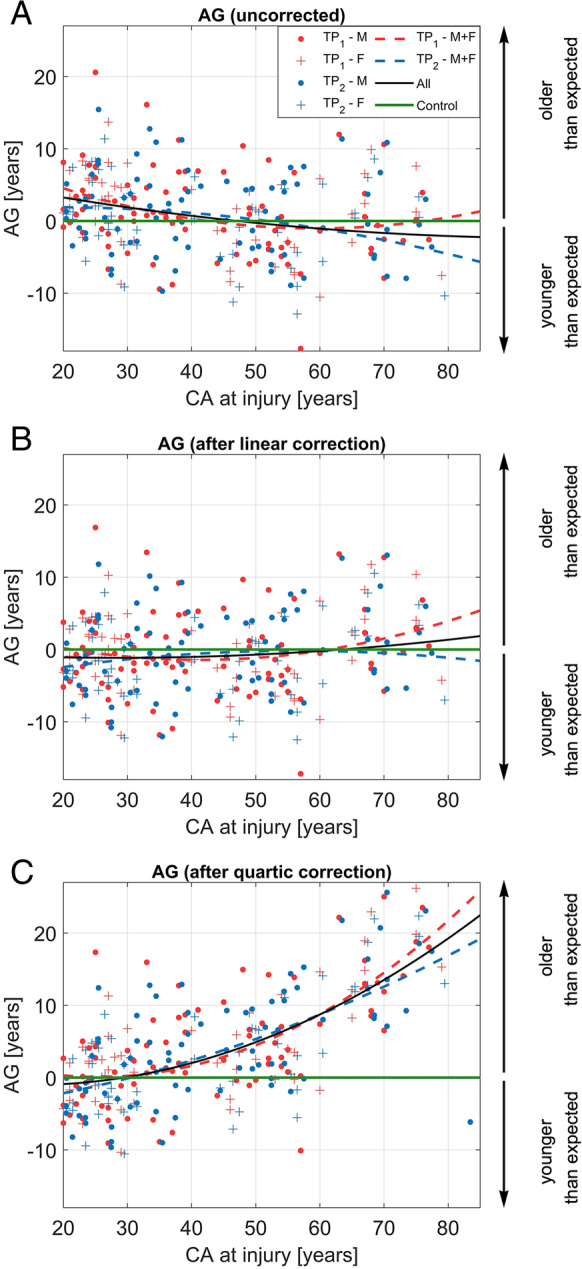
(Color online) s for the uncorrected model (A), linear correction (B), and quartic correction (C). s are plotted as a function of at injury both at the acute and chronic timepoints (TP1 and TP2, respectively). In (A), (B), and (C), second-order polynomials model as a function of for males (M, circles), females (F, crosses) at TP1 (red data points and trendline), TP2 (blue data points and trendline), and across both TPs (black trendline). In other words, red and blue dashed lines correspond to quadratic polynomial functions whose coefficients were calculated using data from the first (acute baseline) and second (chronic follow-up) timepoints, respectively. The black trace is the polynomial function whose coefficients were calculated using data from both timepoints. The horizontal green line corresponds to the null hypothesis = 0, from which older adults’ s deviate significantly. Importantly, the second-order polynomial lines in each inset are guides to the eye and are distinct from the polynomials involved for the corrections themselves (see “Methods” section). Vertical arrows indicate the sign of (i.e., the direction of the aging effect) and its interpretation in terms of aging trajectory (downward arrow: negative , i.e., the participant is younger than expected; upward arrow: positive , i.e., the participant is older than expected). age gap, chronological age, F females, M males, TP timepoint
Fig. 2.

(Grayscale) Comparison of neuroanatomic features across (A) a younger HC male ( = 24), (B) a younger male participant with TBI ( = 24 y) imaged at the acute baseline, (C) an older HC female participant ( = 75 y), and (D) an older female participant with TBI ( = 75 y) imaged at the acute baseline. The first, second, and third columns correspond to axial, sagittal, and coronal views, respectively. Notable features that assist subject comparison include lateral ventricle size and sulcal depth/width. Comparison of (A) and (B) indicates larger ventricles and sulcal enlargement in the younger participant with TBI (blue arrows show the difference in sulcal enlargement). Whereas comparison of (C) and (D) also illustrates greater brain atrophy after TBI in the OAs, the extent of this phenomenon is clearly greater than in the YAs (red arrows). Comparison of (A) and (C) highlights typical aging-related brain atrophy, whereas comparison of (B) and (D) additionally illustrates TBI-related brain aging, which includes injury-related biological aging
Hypothesis testing
In part I of the statistical analysis, step 1 indicates that, across all ages and both sexes, the average amount of significant TBI-related brain aging is significant at baseline ( = 4.3 y, = 7.9 y, = 6.3, = 9.8 × 10⁻⁹, power = 99%) and follow-up ( = 3.9 y, = 7.9 y, = 5.7, = 2.1 × 10⁻⁷, power = 99%). Whereas the average amount of TBI-related brain aging is 4.3 y at baseline vs. 3.9 y at follow-up, this difference is not significant ( = 0.41, = 0.66, power = 80%). Results for step A of part I are reported in Table 5A, revealing that the average of OAs is significantly greater than 0 at both timepoints (acute baseline: = 15.3 y, = 6.9 y, = 11.2, = 5.0 × 10⁻¹¹, power = 99%; chronic follow-up: = 14.2 y, = 7.2 y, = 9.8, = 6.5 × 10⁻¹⁰, power = 99%, see Fig. 3A and B, respectively). Step B confirms that, across all decadal age groups that include both sexes, only OAs exhibit significant TBI-related brain aging (Table 5B). In steps C and F of part I, although some tests are underpowered, the sex-specific decadal group tests echo the results in step B and their implications, reflecting comparable TBI effects across sexes (Table 5C through F). Steps D and F of part I reveal that, at each timepoint, males and females each have mean s significantly greater than 0. For males, at baseline, = 4.5 y and = 8.1 y ( = 5.0, = 5.6 × 10⁻⁶, power = 99%). For males, at follow-up, = 4.3 y and = 8.0 y ( = 4.9, = 8.9 × 10⁻⁵, power = 99%). For females, at baseline, = 4.0 y and = 7.7 y ( = 3.8, = 0.0007, power = 99%). For females, at follow-up, = 3.2 y and = 7.8 y ( = 2.9, = 0.0079, power = 88%).
Table 5.
Results of one-sample t tests of the null hypothesis = 0 y at the acute baseline (TP1) and chronic follow-up (TP2)
| CA | − log10 | power [%] | ||||||||||
|---|---|---|---|---|---|---|---|---|---|---|---|---|
| [y] | [y] | |||||||||||
| TP1 | TP2 | TP1 | TP2 | TP1 | TP2 | TP1 | TP2 | TP1 | TP2 | |||
| (A) Both sexes, YAs and OAs | ||||||||||||
| 20–59 | 108 | 1.8 | 1.5 | 5.6 | 5.9 | 3.3 | 2.6 | 107 | 2.64* | 1.87 | 95 | 83 |
| 60–83 | 25 | 15.3 | 14.2 | 6.9 | 7.2 | 11.2 | 9.8 | 24 | 10.30*** | 9.19*** | 99 | 99 |
| (B) Both sexes, by decadal age group | ||||||||||||
| 20–29 | 43 | − 0.3 | − 1.4 | 5.2 | 5.1 | − 0.3 | − 1.8 | 42 | 0.43 | 1.07 | 10 | 54 |
| 30–39 | 25 | 2.3 | 2.2 | 6.0 | 5.9 | 1.9 | 1.9 | 24 | 1.17 | 1.15 | 58 | 57 |
| 40–49 | 17 | 3.8 | 3.0 | 5.4 | 5.0 | 2.9 | 2.5 | 16 | 2.00* | 1.58 | 88 | 76 |
| 50–59 | 23 | 3.5 | 5.0 | 5.2 | 5.8 | 3.2 | 4.1 | 22 | 2.33* | 3.24** | 93 | 99 |
| 60–69 | 14 | 12.8 | 13.7 | 6.4 | 5.7 | 7.4 | 9.0 | 13 | 5.46*** | 6.44*** | 99 | 99 |
| 70–83 | 11 | 18.5 | 14.9 | 6.2 | 9.1 | 9.9 | 5.4 | 10 | 6.10*** | 3.70** | 99 | 99 |
| All | 133 | 4.3 | 3.9 | 7.9 | 7.9 | 6.3 | 5.7 | 132 | 8.01*** | 6.67*** | 99 | 99 |
| (C) Males only, YAs and OAs | ||||||||||||
| 20–59 | 67 | 2.0 | 2.3 | 6.2 | 6.3 | 2.7 | 2.9 | 66 | 1.92* | 2.16* | 85 | 89 |
| 60–83 | 15 | 15.5 | 13.6 | 6.3 | 8.2 | 9.5 | 6.5 | 14 | 6.92*** | 4.90*** | 99 | 99 |
| (D) Males only, by decadal age group | ||||||||||||
| 20–29 | 21 | -0.7 | -2.0 | 5.7 | 5.4 | -0.6 | -1.7 | 20 | 0.49 | 1.01 | 14 | 50 |
| 30–39 | 22 | 2.4 | 2.7 | 6.2 | 6.0 | 1.8 | 2.1 | 21 | 1.11 | 1.29 | 55 | 64 |
| 40–49 | 9 | 5.1 | 4.8 | 5.9 | 4.1 | 2.6 | 3.5 | 8 | 1.59 | 2.22* | 76 | 94 |
| 50–59 | 14 | 3.5 | 6.1 | 5.9 | 6.1 | 2.2 | 3.7 | 13 | 1.40 | 2.63* | 71 | 98 |
| 60–69 | 7 | 12.8 | 13.7 | 5.2 | 5.9 | 6.6 | 6.1 | 6 | 3.62** | 3.42** | 99 | 99 |
| 70–83 | 8 | 17.8 | 13.6 | 6.6 | 10.2 | 7.6 | 3.8 | 7 | 4.27*** | 2.34* | 99 | 96 |
| All | 82 | 4.5 | 4.3 | 8.1 | 8.0 | 5.0 | 4.9 | 81 | 5.25*** | 5.05*** | 99 | 99 |
| (E) Females only, YAs and OAs | ||||||||||||
| 20–59 | 41 | 1.3 | 0.3 | 4.6 | 5.0 | 1.9 | 0.3 | 40 | 1.14 | 0.43 | 57 | 55 |
| 60–83 | 10 | 15.1 | 15.0 | 7.9 | 5.7 | 6.1 | 8.3 | 9 | 3.94** | 5.08*** | 99 | 99 |
| (F) Females only, by decadal age group | ||||||||||||
| 20–29 | 22 | 0.2 | − 0.8 | 4.7 | 4.9 | 0.2 | − 0.8 | 21 | 0.41 | 0.54 | 7 | 18 |
| 30–39 | 3 | 1.3 | − 1.1 | 5.2 | 3.5 | 0.4 | − 0.5 | 2 | 0.51 | 0.54 | 9 | 10 |
| 40–49 | 8 | 2.4 | 0.9 | 4.6 | 5.4 | 1.5 | 0.5 | 7 | 0.88 | 0.47 | 38 | 11 |
| 50–59 | 9 | 3.5 | 3.0 | 4.1 | 5.2 | 2.6 | 1.7 | 8 | 1.58 | 1.03 | 70 | 43 |
| 60–69 | 7 | 12.9 | 13.6 | 8.0 | 5.9 | 4.3 | 6.2 | 6 | 2.54* | 3.44** | 98 | 99 |
| 70–83 | 3 | 20.4 | 18.3 | 5.5 | 4.8 | 6.5 | 6.6 | 2 | 2.46* | 2.49* | 99 | 99 |
| All | 51 | 4.0 | 3.2 | 7.7 | 7.8 | 3.8 | 2.9 | 50 | 3.17** | 2.10* | 98 | 88 |
This null hypothesis is equivalent to the statement that the group in question exhibits no TBI-related brain aging. Listed are sample sizes , the mean and standard deviation of (in years), the t statistic of the test, − log10 values (where is the value of the test), and statistical power as a percentage. Values of − log10 greater than 1.3, 3, and 4 are significant at thresholds () of 0.05, 0.001, and 0.0001, respectively. These significance levels are indicated by *, **, and ***, respectively, provided that the power of the corresponding statistical test is at least 80%. All s are bias corrected
age gap, degrees of freedom, TP timepoint, y year(s)
Fig. 3.

(Color online) Boxplots of s for each decadal age group in the age range from 20 to 83 for (A) TP1, (B) TP2, and (C) both TPs partitioned into two columns with the left column containing the decadal groupings and the right column containing YA vs. OA. Horizontal red lines indicate the median of the respective group. The width of each boxplot notch indicates median variability within the respective age group and is computed such that non-overlapping notches between groups indicate significantly different medians at = 5%. Horizontal blue lines marking the bottom and top edges of each box designate the 25th and 75th percentiles, respectively, of within the respective age group. Whiskers extend to values within 1.5 × IQR above or below each box. Red crosses indicate outliers outside 1.5 × IQR. All s are bias corrected. Vertical arrows indicate the sign of (i.e., the direction of the aging effect) and its interpretation in terms of aging trajectory (downward arrow: negative , i.e., the participant is younger than expected; upward arrow: positive , i.e., the participant is older than expected). age gap, IQR interquartile range, TP timepoint
In part II of the analysis, step A indicates that, across participants of all ages and both sexes, there is no significant TBI-related brain aging occurring between timepoints (baseline: = 4.3 y, = 7.9 y; follow-up: = 3.9 y, = 7.9 y; = 0.41, > 0.65, see Table 6A), although the test is underpowered (power = 28%). Steps B and C identify significant TBI-related brain aging difference between OAs and YAs of either sex at both baseline ( = 1.8 y, = 5.6 y; = 15.3 y, = 6.9 y; = − 9.2, = 9.5 × 10⁻¹¹, power = 99%) and follow-up ( = 1.5 y, = 5.9 y; = 14.2 y, = 7.2 y; = − 8.2, = 1.2 × 10⁻⁹, power = 99%, see Table 6B and C). For steps D and E, all statistical tests are underpowered, and no statistical inferences are therefore advisable. For steps F and G of part II, no significant sex differences in brain aging are found at either timepoint, although the test for the baseline is slightly underpowered (baseline: = 4.5 y, = 8.1 y; = 4.0 y, = 7.7 y; = 0.4, > 0.64, power = 76%; follow-up: = 4.3 y, = 8.0 y; = 3.2 y, = 7.8 y; = 0.78, > 0.78, power = 93%, see Table 6F and G).
Table 6.
Results of statistical tests to infer if there is any significant difference in TBI-related brain aging between levels of each statistical factor in the analysis (age, sex, or time)
| Test | Sex(es) | TP(s) | Age(s) | − log10 | Power (%) | ||||
|---|---|---|---|---|---|---|---|---|---|
| A | Both | 1 vs. 2 | All ages | 133 | 133 | 0.4129 | 264 | 10.1805 | 28 |
| B | Both | 1 | YAs vs. OAs | 108 | 25 | − 9.1680 | 32 | 10.0238* | 99 |
| C | Both | 2 | YAs vs. OAs | 108 | 25 | − 8.2048 | 32 | 18.9330* | 99 |
| D | M vs. F | 1 | All ages | 81 | 52 | 0.3569 | 110 | 10.1944 | 99 |
| E | M vs. F | 2 | All ages | 81 | 52 | 0.7830 | 108 | 10.1066 | 21 |
The statistical comparisons are as follows: (A) the acute baseline timepoint (TP1) vs. the chronic timepoint (TP2) across participants of all ages and both sexes (analysis part II, step 1); (B) YAs vs. OAs at TP1 across both sexes (analysis part II, step 2); (C) YAs vs. OAs at TP2 across both sexes (analysis part II, step 2); (D) males vs. females at the acute timepoint (TP1) across all ages (analysis part II, step 5); (E) males vs. females at the chronic follow-up timepoint (TP2) across all ages (analysis part II, step 5). Columns 2–4 indicate the composition of the samples compared in each statistical test. For example, test A compares timepoint 1 (acute baseline) to timepoint 2 (chronic follow-up) across all ages and both sexes. Similarly, test B compares YAs to OAs at timepoint 1 across both sexes, and test D compares males to females at timepoint 1 across all ages. Listed in columns 5–10, respectively, are the sample sizes ( and ) of the groups compared, Welch’s statistic, the degrees of freedom, − log10 (where is the value of the test), and statistical power. Values of − log10 greater than 4 are significant at = 0.0001, indicated by * if the power of the test is at least 80%
F females, M males, OA older adult, TP timepoint, YA younger adult
Discussion
Estimating can be useful for identifying individuals at relatively high risk of aging-related diseases. For example, accelerated brain aging after TBI is a known risk factor for cognitive decline, cognitive impairment, and neurodegenerative diseases, including Alzheimer’s and Parkinson’s diseases [8, 9, 25–27]. Thus, MRI-based estimates can help to identify individuals who may need to prioritize lifestyle changes or who could benefit most from clinical interventions, potentially to include patient-tailored treatments [28–30]. Conversely, estimation can facilitate identification of individuals resilient to TBI-related brain senescence, which may be useful because such individuals’ genotypic, phenotypic, and endophenotypic profiles could help to identify biological factors that are neuroprotective against TBI [31–33].
Modeling and validation
Prior studies have demonstrated (A) the feasibility of accurate estimation from structural and/or diffusion neuroimaging [1, 11], (B) the within- and between-scanner reliability of estimation procedures [10], and (C) the ability to predict mortality from estimates [7]. Most existing models for estimation assume that is linearly associated with both and , which is often true in typical aging [17, 18]. It is unclear, however, whether this assumption holds for neurological conditions like TBI, where accelerated cognitive decline and brain atrophy have been documented [34–38]. Because such accelerated processes may be indicative of nonlinear trends in brain aging as a function of at injury, it is reasonable to hypothesize that nonlinear models can be useful for bias correction in the presence of such nonlinearities.
The results of our model selection procedure suggest that, compared to linear models, adequately selected polynomial functions modeling the relationship between and can capture significantly more information than linear models without overfitting. This statement is supported by the results of our analysis to compare the Spearman rank correlations between bias-corrected s and cognitive measures. This analysis highlights how fourth-order bias corrections result in (A) stronger correlations between s and cognitive scores for OAs, and in (B) correlations for YAs that are comparable across bias correction models. Thus, higher-order corrections like ours could be most beneficial when assessing the s of OAs, whose brain aging accelerates considerably after TBI compared to those of YAs. Future studies should further evaluate the utility of nonlinear models using independent approaches for estimation other than cognitive measures. Such approaches could include methylation clocks or other strategies that do not rely on imaging alone to estimate [39–43].
Interpretation and implications
This study quantifies, in years, the vulnerability of OAs to injury-related aging that is observed above and beyond typical aging. The study also identifies the at injury when injury accelerates the rate of brain aging. According to this study, the average amount of post-traumatic brain aging increases substantially and nonlinearly with after 60 y. This suggests that the transition from middle to old (chronological) age is accompanied by substantial changes in the brain’s vulnerability to TBI. By contrast, single mTBIs sustained before age 60 do not seem to result in significant brain increases in individuals with no history of neurological or psychiatric disease. It is conceivable, however, that YAs do undergo significant brain aging after mTBI, although samples larger than ours may be needed to detect it. In a large cohort of mTBI participants with the same , the expected at the time just before injury is 0 y because s are normally distributed around their mean. In the limit of large , this expected value of is equal to the . This property of Gaussianity reflects the fact that models like brainageR are trained so that y for typically aging (i.e., uninjured) brains. Therefore, our findings suggest that the post-injury aging is mTBI related, but only on average over our cohort of participants.
Because brain is proportional to neurodegenerative disease risk [44–46], TBI-related brain aging in older adults could reflect increases in such risk. The finding that at injury is a stronger determinant of brain aging than sex requires further study and interpretation through mechanistic research on how at injury and sex affect brain aging. We investigated participants with relatively recent single TBIs of mild severity (i.e., concussions) and with no prior history of other TBIs. Thus, our findings may not be readily generalizable to remote injuries, to injury severities greater than mild, or to individuals with a history of more than one TBI. Because TBI chronicity, severity, and count affect neurodegenerative disease risk in complex ways [47], researchers should aim to clarify how these factors affect brain aging after injury.
The apparent lack of significant brain differences between timepoints suggests that, according to our modeling and results, most MRI-detectable brain aging occurred within the first 7 days after injury. For this reason, the lack of significant brain differences between timepoints should not be construed to imply that mTBI does not result in excessive brain aging. Instead, our study suggests that TBI-related brain aging does not increase significantly in samples like ours either during or beyond the first 6 months post-trauma. Thus, in victims of a single mTBI, it is possible that acute injury effects on brain structure affect TBI-related brain aging more strongly than chronic injury effects. A complementary hypothesis consistent with this scenario is that acute injury effects on brain structure persist after the first 6 months post TBI. This may cause the apparent lack of mean changes across timepoints, as reported here. Testing this hypothesis requires data from additional timepoints, and our observational study introduces a strategy for screening mTBI patients in view of therapeutic intervention at the discretion of clinicians, rather than specifically for treating them. Thus, our inferences highlight the importance of such screening to facilitate early interventions that could prevent or alleviate biological aging. They also raise questions about the extent to which subacute or chronic pathophysiological processes can lead to structural brain alterations reflective of brain aging on MRI. It is unknown whether neuroprotective interventions undertaken during the subacute or chronic stages of TBI could help to decelerate or forestall such processes. It is also unknown whether their effect on brain aging would be adequately captured on MRIs. Thus, substantial additional research is required to understand how TBI can lead to brain aging, how well MRI can capture this phenomenon, and what the optimal window is for interventions to alleviate it. Future work to develop post-TBI therapeutic interventions relying on estimation-informed approaches can reveal the utility of this measure for identifying, monitoring, attenuating, and perhaps even reversing structural brain changes that estimates epitomize. This can also help address the heterogeneous aging vulnerability to aging-related degeneration by identifying those most seriously affected.
Comparison with other studies
Our findings are supported by research indicating that older TBI patients’ differential activity pertaining to immune regulation and neural recovery contribute to a lower probability of MRI evidence for post-traumatic recovery [48]. Cole et al. [11] studied 99 participants with TBIs of all severities (17% mild, 83% moderate or severe) who had been scanned, on average, 2.4 y post-injury. These authors found average s of 4.7 ± 10.8 y for gray matter, and 6.0 ± 11.2 y for white matter, as well as significant increases with time since injury. In our study, such increases were not found, possibly because (A) our follow-up period was considerably shorter (0.5 y vs. 2.4 y, on average), (B) our sample did not include participants with moderate or severe TBIs (whose brains probably age faster), and (C) our participants sustained recent TBIs, whereas the sample of Cole et al. was considerably more heterogeneous with respect to injury chronicity. Despite such methodological differences, our results are consistent with the conclusion of Cole et al. that TBI accelerates the rate of brain atrophy. This is because, according to our findings, the older the at injury, the greater the average amount of TBI-related brain aging. Our finding of no significant TBI-related brain aging between baseline and follow-up replicates that of Gan et al. [49], whose neuroimage analysis approach is similar to ours with the notable exception that these authors used a linear model to describe as a function of at injury. In a sample smaller than ours, these authors also found that OAs experience significantly more brain aging than YAs after mTBI (OAs: 6.7 ± 5.6 y; YAs: 1.3 ± 5.5 y).
Limitations
Our findings may partly be confounded by comorbidities unrelated to TBI. In one study of hospital patients with geriatric TBI [50], 11% had pre-existing dementia, 22% had pre-existing hypertension, and 99% had at least one pre-existing condition. Another study [51] suggests that 73% of older TBI patients have a medical condition before injury, compared to only 28% of younger patients. Finally, 80% of all adults over the age of 65 have at least one chronic condition and 50% have at least two such conditions [52], e.g., hypertension [53]. These and other comorbidities of OAs experiencing mTBIs may, in ways unknown to us, affect our estimates of excessive brain aging observed approximately one week after injury. For example, persons who are already vulnerable to accelerated senescence before injury may go on to experience accelerated aging after injury, but this aging may be related partly to their mTBI and partly to unrelated processes that accelerate aging. However, our estimated AGs reflect the sum of accelerated post-traumatic aging processes regardless of whether they are causally related to mTBI, and our models cannot establish such causality with certainty. We are only able to extract the additional aging in OAs on average. Ideally, mTBI patients should be studied in the absence of unrelated comorbidities, particularly those of a vascular nature. However, this can be very challenging due to the high prevalence of vascular disease among older adults. In addition, findings from normotensive older patients with TBI but without vascular disease can be of limited relevance because only a modest fraction of older individuals lack either the symptoms or the post-mortem pathology of vascular disease.
Our categorization of participants as younger or older than 40 is, admittedly, somewhat arbitrary. We selected this age threshold between groups for two reasons. First, it resulted in a relatively balanced statistical design with about equal numbers of participants in each of the two groups. Second, recent research suggests that contrasting young and early middle-aged adults against old and late middle-aged adults can provide insight into disease mechanisms that are initiated early in the aging process, as in the undulating senescence model [54]. Indeed, our Fig. 1 suggests a noticeable difference in mTBI effects upon brain age in adults older versus younger than 40, the former being considerably more resilient than the latter (as reflected by their much smaller age gaps). Similarly, splitting our sample by decade is also somewhat arbitrary, and other divisions (e.g., 5-year bins, etc.) can also be justified. Given our sample size, however, splitting the sample by decade is more appropriate due to the need of preserving adequate statistical power for hypothesis tests. Furthermore, quantifying TBI-related brain acceleration by decade is useful because many clinical guidelines are formulated for decadal groups [23]. Furthermore, it is important to note that our treatment of age effects is not limited to the setting where participants are grouped according to their ages. Specifically, our study synergizes decadal analysis with the analysis of age as a continuous variable, viz. Figure 1. Admittedly, treatment of age, sex, and their interaction within linear (mixed effects) regression models is appealing. However, whereas such models provide insight on the significances of age and sex as statistical random variables, treating age as a continuous variable within these models does not accommodate the task of comparing persons within certain age groups (e.g., 30s vs. 40s, etc.) as easily as in our adopted approach.
A strength of Gaussian process regression is its ability to predict using a comprehensive set of MRI features whose utility can otherwise be difficult to leverage. On the other hand, such features can be challenging to interpret neuroanatomically. Thus, a notable weakness of this study is that our estimation approach does not indicate which TBI-related changes in brain structure are associated with excessive brain aging after injury. Furthermore, a larger sample is needed to test, with adequate power, whether TBI effects upon brain differ significantly by sex. We could not infer confidently whether the interaction between sex and at injury affects brain aging significantly after TBI. This could be due either to the nature of our statistical design or/and to our limited sample size. Finally, our inferences are based exclusively on macroscale neuroimage analysis, and involves no analysis of microscale findings, like in histopathology studies. This precludes our identification of neurobiological mechanisms solely by means of our approach. Thus, no independent model validation or confirmation of our results could be obtained other than from cognitive assessments. Validation based on strategies that require invasive sampling to calculate brain (e.g., DNA methylation clocks of brain cells) should be explored by future studies, as should validation based on phenotypic age, physiological age, functional aging index, and frailty index.
Conclusion
This study identifies at injury—but not sex—as a significant risk factor for appreciable brain aging after mTBI. Our results highlight the importance of model selection to identify nonlinear models that best capture the relationship between brain and , which may not always be linear. Thus, the relationship between and should be modeled and interpreted carefully and rigorously by future studies. Importantly, it should be modeled across a follow-up interval longer than ours. Our results suggest mTBI-related changes in the brain’s biological aging trajectory that are not reversed within our 6-month follow-up period. However, our findings do not rule out recovery processes that become manifest beyond this early follow-up period, and future studies should quantify these. Researchers should also attempt to replicate our findings using methods that estimate from neuroimage features that are better understood and more interpretable (e.g., regional volumes, surface areas, connectivity properties, etc.). Importantly, open access to the learned model parameters used by various software for estimation would help researchers to understand and interpret their outputs and to ensure reproducibility across software implementations and imaging datasets.
Acknowledgements
The authors are thankful to Michelle Y. Ha, Dylan Overby, and Chur Tam for their comments, suggestions, assistance with literature search, and figure preparation. This study was supported by the National Institutes of Health grant R01 NS 100973 to A.I., by the US Department of Defense contract W81XWH-18-1-0413 to A.I., by a Hanson-Thorell Family Research Scholarship, and by the James J. and Sue Femino Foundation. The funding sources had no role in study design; in the collection, analysis, and interpretation of data; in the writing of the report; and in the decision to submit the article for publication.
Abbreviations
- AG
Age gap
- BA
Biological age
- CA
Chronological age
- HC
Healthy control
- MRI
Magnetic resonance imaging
- mTBI
Mild traumatic brain injury
- OA
Older adult
- YA
Younger adult
Declarations
Conflict of interest
The authors declare no competing interests.
Footnotes
Publisher's note
Springer Nature remains neutral with regard to jurisdictional claims in published maps and institutional affiliations.
Anar Amgalan and Alexander S. Maher contributed equally to this work.
References
- 1.Irimia A, et al. Statistical estimation of physiological brain age as a descriptor of senescence rate during adulthood. Brain Imaging Behav. 2015;9(4):678–689. doi: 10.1007/s11682-014-9321-0. [DOI] [PMC free article] [PubMed] [Google Scholar]
- 2.Cole JH, et al. Brain age and other bodily 'ages': implications for neuropsychiatry. Mol Psychiatry. 2019;24(2):266–281. doi: 10.1038/s41380-018-0098-1. [DOI] [PMC free article] [PubMed] [Google Scholar]
- 3.Franke K, Gaser C. Ten years of BrainAGE as a neuroimaging biomarker of brain aging: what insights have we gained? Front Neurol. 2019;10:789. doi: 10.3389/fneur.2019.00789. [DOI] [PMC free article] [PubMed] [Google Scholar]
- 4.Faden AI, Loane DJ. Chronic neurodegeneration after traumatic brain injury: Alzheimer disease, chronic traumatic encephalopathy, or persistent neuroinflammation? Neurotherapeutics. 2015;12(1):143–150. doi: 10.1007/s13311-014-0319-5. [DOI] [PMC free article] [PubMed] [Google Scholar]
- 5.Irimia A, et al. Structural and connectomic neuroimaging for the personalized study of longitudinal alterations in cortical shape, thickness and connectivity after traumatic brain injury. J Neurosurg Sci. 2014;58(3):129–144. [PMC free article] [PubMed] [Google Scholar]
- 6.de Freitas Cardoso MG, et al. Cognitive impairment following acute mild traumatic brain injury. Front Neurol. 2019;10:198. doi: 10.3389/fneur.2019.00198. [DOI] [PMC free article] [PubMed] [Google Scholar]
- 7.Cole JH, et al. Brain age predicts mortality. Mol Psychiatry. 2018;23(5):1385–1392. doi: 10.1038/mp.2017.62. [DOI] [PMC free article] [PubMed] [Google Scholar]
- 8.Gaser C, et al. BrainAGE in mild cognitive impaired patients: predicting the conversion to Alzheimer's disease. PLoS ONE. 2013;8(6):e67346. doi: 10.1371/journal.pone.0067346. [DOI] [PMC free article] [PubMed] [Google Scholar]
- 9.Crane PK, et al. Association of traumatic brain injury with late-life neurodegenerative conditions and neuropathologic findings. JAMA Neurol. 2016;73(9):1062–1069. doi: 10.1001/jamaneurol.2016.1948. [DOI] [PMC free article] [PubMed] [Google Scholar]
- 10.Cole JH, et al. Predicting brain age with deep learning from raw imaging data results in a reliable and heritable biomarker. Neuroimage. 2017;163:115–124. doi: 10.1016/j.neuroimage.2017.07.059. [DOI] [PubMed] [Google Scholar]
- 11.Cole JH, et al. Prediction of brain age suggests accelerated atrophy after traumatic brain injury. Ann Neurol. 2015;77(4):571–581. doi: 10.1002/ana.24367. [DOI] [PMC free article] [PubMed] [Google Scholar]
- 12.Kliegel M, Martin M, Jager T. Development and validation of the Cognitive Telephone Screening Instrument (COGTEL) for the assessment of cognitive function across adulthood. J Psychol. 2007;141(2):147–170. doi: 10.3200/JRLP.141.2.147-172. [DOI] [PubMed] [Google Scholar]
- 13.Tun PA, Lachman ME. Telephone assessment of cognitive function in adulthood: the Brief Test of Adult Cognition by Telephone. Age Ageing. 2006;35(6):629–632. doi: 10.1093/ageing/afl095. [DOI] [PubMed] [Google Scholar]
- 14.Team RC. R: A language and environment for statistical computing. 2013.
- 15.Karatzoglou A, et al. kernlab-an S4 package for kernel methods in R. J Stat Softw. 2004;11(1):1–20. [Google Scholar]
- 16.Williams CK. Learning in graphical models. Springer; 1998. Prediction with Gaussian processes: from linear regression to linear prediction and beyond; pp. 599–621. [Google Scholar]
- 17.Beheshti I, et al. Bias-adjustment in neuroimaging-based brain age frameworks: a robust scheme. Neuroimage Clin. 2019;24:102063. doi: 10.1016/j.nicl.2019.102063. [DOI] [PMC free article] [PubMed] [Google Scholar]
- 18.de Lange AG, Cole JH. Commentary: Correction procedures in brain-age prediction. Neuroimage Clin. 2020;26:102229. doi: 10.1016/j.nicl.2020.102229. [DOI] [PMC free article] [PubMed] [Google Scholar]
- 19.Cook RD, Weisberg S. Characterizations of an empirical influence function for detecting influential cases in regression. Technometrics. 1980;22(4):495–508. doi: 10.1080/00401706.1980.10486199. [DOI] [Google Scholar]
- 20.Rencher AC. Methods of multivariate analysis. 2nd ed. Wiley series in probability and mathematical statistics. New York: J. Wiley; 2002. xxii, 708 p.
- 21.Stram DO, Lee JW. Variance components testing in the longitudinal mixed effects model. Biometrics. 1994;50(4):1171–1177. doi: 10.2307/2533455. [DOI] [PubMed] [Google Scholar]
- 22.Hox JJ, Moerbeek M, Van de Schoot R. Multilevel analysis: techniques and applications. Routledge; 2017.
- 23.Cnossen MC, et al. Adherence to guidelines in adult patients with traumatic brain injury: a living systematic review. J Neurotrauma. 2021;38(8):1072–1085. doi: 10.1089/neu.2015.4121. [DOI] [PMC free article] [PubMed] [Google Scholar]
- 24.Levin HS, Diaz-Arrastia RR. Diagnosis, prognosis, and clinical management of mild traumatic brain injury. Lancet Neurol. 2015;14(5):506–517. doi: 10.1016/S1474-4422(15)00002-2. [DOI] [PubMed] [Google Scholar]
- 25.Vanitallie TB. Parkinson disease: primacy of age as a risk factor for mitochondrial dysfunction. Metabolism. 2008;57(Suppl 2):S50–S55. doi: 10.1016/j.metabol.2008.07.015. [DOI] [PubMed] [Google Scholar]
- 26.Butterfield DA, Howard BJ, LaFontaine MA. Brain oxidative stress in animal models of accelerated aging and the age-related neurodegenerative disorders, Alzheimer's disease and Huntington's disease. Curr Med Chem. 2001;8(7):815–828. doi: 10.2174/0929867013373048. [DOI] [PubMed] [Google Scholar]
- 27.Ho YS, et al. Cigarette smoking accelerated brain aging and induced pre-Alzheimer-like neuropathology in rats. PLoS ONE. 2012;7(5):e36752. doi: 10.1371/journal.pone.0036752. [DOI] [PMC free article] [PubMed] [Google Scholar]
- 28.Akyol MA, et al. Determining middle-aged and older adults' health beliefs to change lifestyle and health behavior for dementia risk reduction. Am J Alzheimers Dis Other Demen. 2020;35:1533317519898996. doi: 10.1177/1533317519898996. [DOI] [PMC free article] [PubMed] [Google Scholar]
- 29.Lim YY, et al. Three-month stability of the CogState brief battery in healthy older adults, mild cognitive impairment, and Alzheimer's disease: results from the Australian Imaging, Biomarkers, and Lifestyle-rate of change substudy (AIBL-ROCS) Arch Clin Neuropsychol. 2013;28(4):320–330. doi: 10.1093/arclin/act021. [DOI] [PubMed] [Google Scholar]
- 30.Stephen R, et al. Change in CAIDE dementia risk score and neuroimaging biomarkers during a 2-year multidomain lifestyle randomized controlled trial: results of a post-hoc subgroup analysis. J Gerontol A Biol Sci Med Sci. 2021;76(8):1407–1414. doi: 10.1093/gerona/glab130. [DOI] [PMC free article] [PubMed] [Google Scholar]
- 31.Ishikawa Y, et al. Search for novel gene markers of traumatic brain injury by time differential microarray analysis. Acta Neurochir Suppl. 2006;96:163–167. doi: 10.1007/3-211-30714-1_36. [DOI] [PubMed] [Google Scholar]
- 32.Liu R, et al. BpV(pic) confers neuroprotection by inhibiting M1 microglial polarization and MCP-1 expression in rat traumatic brain injury. Mol Immunol. 2019;112:30–39. doi: 10.1016/j.molimm.2019.04.010. [DOI] [PubMed] [Google Scholar]
- 33.Pan MX, et al. Sex-dependent effects of GPER activation on neuroinflammation in a rat model of traumatic brain injury. Brain Behav Immun. 2020;88:421–431. doi: 10.1016/j.bbi.2020.04.005. [DOI] [PubMed] [Google Scholar]
- 34.Wood RL. Accelerated cognitive aging following severe traumatic brain injury: a review. Brain Inj. 2017;31(10):1270–1278. doi: 10.1080/02699052.2017.1332387. [DOI] [PubMed] [Google Scholar]
- 35.Hicks AJ, et al. Does cognitive decline occur decades after moderate to severe traumatic brain injury? A prospective controlled study. Neuropsychol Rehabil. 2021;1–20. [DOI] [PubMed]
- 36.Jackson CE, et al. Associations among increases in posttraumatic stress symptoms, neurocognitive performance, and long-term functional outcomes in U.S. Iraq War veterans. J Trauma Stress. 2021;34(3):628–640. doi: 10.1002/jts.22663. [DOI] [PubMed] [Google Scholar]
- 37.Mohamed AZ, et al. Traumatic brain injury fast-forwards Alzheimer's pathology: evidence from amyloid positron emission tomorgraphy imaging. J Neurol. 2021. [DOI] [PubMed]
- 38.Toth L, et al. Traumatic brain injury-induced cerebral microbleeds in the elderly. Geroscience. 2021;43(1):125–136. doi: 10.1007/s11357-020-00280-3. [DOI] [PMC free article] [PubMed] [Google Scholar]
- 39.Hoare J, et al. Accelerated epigenetic aging in adolescents living with HIV is associated with altered development of brain structures. J Neurovirol. 2021. [DOI] [PMC free article] [PubMed]
- 40.McCartney DL, et al. Genome-wide association studies identify 137 genetic loci for DNA methylation biomarkers of aging. Genome Biol. 2021;22(1):194. doi: 10.1186/s13059-021-02398-9. [DOI] [PMC free article] [PubMed] [Google Scholar]
- 41.McCrory C, et al. GrimAge outperforms other epigenetic clocks in the prediction of age-related clinical phenotypes and all-cause mortality. J Gerontol A Biol Sci Med Sci. 2021;76(5):741–749. doi: 10.1093/gerona/glaa286. [DOI] [PMC free article] [PubMed] [Google Scholar]
- 42.Voisin S, et al. An epigenetic clock for human skeletal muscle. J Cachexia Sarcopenia Muscle. 2020;11(4):887–898. doi: 10.1002/jcsm.12556. [DOI] [PMC free article] [PubMed] [Google Scholar]
- 43.Horvath S. DNA methylation age of human tissues and cell types. Genome Biol. 2013;14(10):R115. doi: 10.1186/gb-2013-14-10-r115. [DOI] [PMC free article] [PubMed] [Google Scholar]
- 44.Angelova DM, Brown DR. Microglia and the aging brain: are senescent microglia the key to neurodegeneration? J Neurochem. 2019;151(6):676–688. doi: 10.1111/jnc.14860. [DOI] [PubMed] [Google Scholar]
- 45.Janowitz D, et al. Inflammatory markers and imaging patterns of advanced brain aging in the general population. Brain Imaging Behav. 2020;14(4):1108–1117. doi: 10.1007/s11682-019-00058-y. [DOI] [PMC free article] [PubMed] [Google Scholar]
- 46.Vanni S, et al. Brain aging: a Ianus-faced player between health and neurodegeneration. J Neurosci Res. 2020;98(2):299–311. doi: 10.1002/jnr.24379. [DOI] [PubMed] [Google Scholar]
- 47.Gardner RC, Yaffe K. Epidemiology of mild traumatic brain injury and neurodegenerative disease. Mol Cell Neurosci. 2015;66(Pt B):75–80. doi: 10.1016/j.mcn.2015.03.001. [DOI] [PMC free article] [PubMed] [Google Scholar]
- 48.Cho YE, et al. Older age results in differential gene expression after mild traumatic brain injury and is linked to imaging differences at acute follow-up. Front Aging Neurosci. 2016;8:168. doi: 10.3389/fnagi.2016.00168. [DOI] [PMC free article] [PubMed] [Google Scholar]
- 49.Gan S, et al. Accelerated brain aging in mild traumatic brain injury: longitudinal pattern recognition with white matter integrity. J Neurotrauma. 2021;38(18):2549–2559. doi: 10.1089/neu.2020.7551. [DOI] [PubMed] [Google Scholar]
- 50.Hawley C, et al. Traumatic brain injuries in older adults—6 years of data for one UK trauma centre: retrospective analysis of prospectively collected data. Emerg Med J. 2017;34(8):509–516. doi: 10.1136/emermed-2016-206506. [DOI] [PubMed] [Google Scholar]
- 51.Mosenthal AC, et al. The effect of age on functional outcome in mild traumatic brain injury: 6-month report of a prospective multicenter trial. J Trauma. 2004;56(5):1042–1048. doi: 10.1097/01.TA.0000127767.83267.33. [DOI] [PubMed] [Google Scholar]
- 52.Centers for Disease, C. and Prevention. Trends in aging—United States and worldwide. MMWR Morb Mortal Wkly Rep. 2003;52(6):101–4, 106. [PubMed]
- 53.Thompson HJ, Dikmen S, Temkin N. Prevalence of comorbidity and its association with traumatic brain injury and outcomes in older adults. Res Gerontol Nurs. 2012;5(1):17–24. doi: 10.3928/19404921-20111206-02. [DOI] [PMC free article] [PubMed] [Google Scholar]
- 54.Lehallier B, et al. Undulating changes in human plasma proteome profiles across the lifespan. Nat Med. 2019;25(12):1843–1850. doi: 10.1038/s41591-019-0673-2. [DOI] [PMC free article] [PubMed] [Google Scholar]