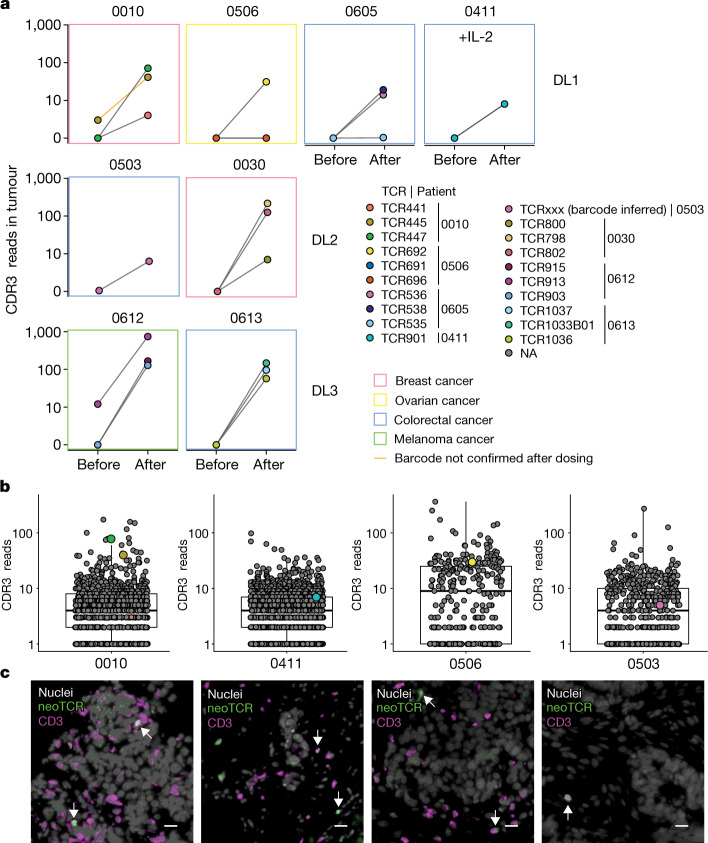
Fig. 4. Trafficking of neoTCR transgenic T cells as detected in tumour biopsies.
a, Analysis of all available biopsy samples at baseline (Before) and after infusion (After) for the presence of infused neoTCRs from detected CDR3α and barcoded reads for DL1, DL2 and DL3 with or without IL-2. Colours of the boxes indicate cancer type. One TCR for which the sequencing reads supporting the codon-optimized constant region was not detected is marked with an orange line (patient 0010). NA, not applicable. b, Quantitation of TCR CDR3α reads in biopsy samples from patients after infusion. Dots are labelled both by size (larger if the neoTCR barcode was confirmed) and colour. Coloured dots are CDR3 sequences matching neoTCRs, and grey dots are neoTCR-unrelated CDR3α reads and their relative quantification. Boxes indicate the interquartile range (IQR), the centre line the median, and the whiskers the lowest and highest values within 1.5× the IQR from the first and third quartiles, respectively. c, Spatial profiling of four patients to image neoTCR transgenic T cells in tumours after treatment. Grey, nuclei; green, neoTCR; magenta, CD3. White arrows denote neoTCR T cells. Scale bar, 20 µm.

