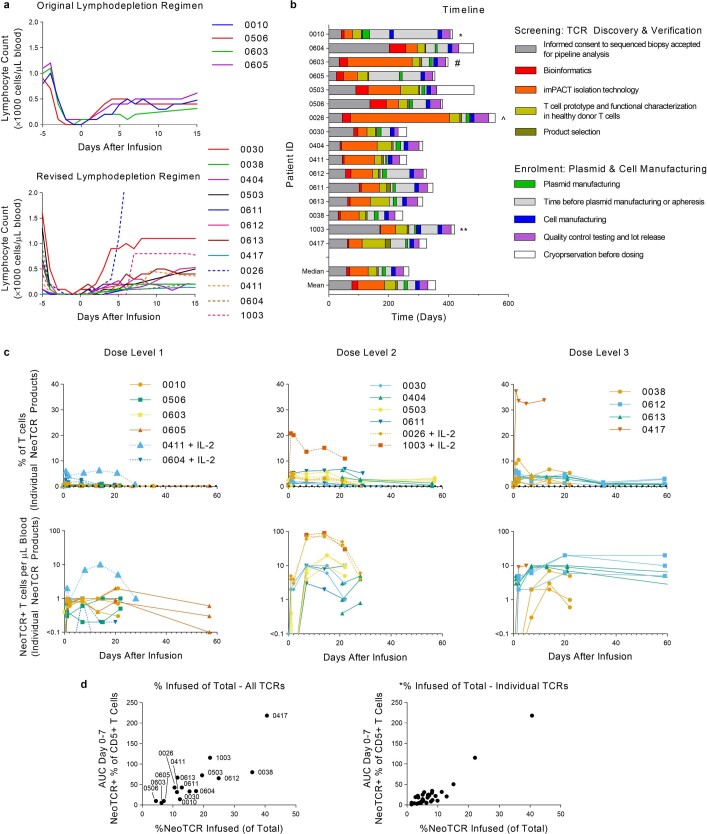
Extended Data Fig. 4. Engineered neoTCR T cell delivery to patients.
a) Absolute lymphocyte counts according to the original conditioning chemotherapy regimen (top), or the revised conditioning chemotherapy regimen (bottom). Patients treated with IL-2 combination therapy are indicated by dotted lines. b) Time to generate neoTCR T cell product for 16 dosed patients, ordered by consent date. * 0010: Due to COVID-19 shutdown in 2020 and updates to the manufacturing process, the patient underwent two apheresis and two manufactures of cell therapy products. # 0603: NeoTCR isolation was done three times for repeated attempts to find neoTCRs available for product selection. ^ 0026: Went through five separate PBMC samples before suitable neoTCRs were identified for product selection. ** 1003: Went through two manufactures of the cell therapy product. c) NeoTCR percentage (top) and counts (bottom) by dose level, separated by individual neoTCR (up to 3 per patient). Peripheral blood analysis of neoTCR cells in patients treated with dose level 1 (left), dose level 2 (centre), and dose level 3 (right). Total number of neoTCR cells was calculated per μL of blood per patient. Count information was not available for all timepoints. Patients treated with IL-2 are shown with dotted lines. d) Gene editing efficiency of final cell product correlates with neoTCR+ cells detected post-infusion. Percent of neoTCR+ cells infused in each patient (left; correlation Pearson r = 0.8463, ****P < 0.0001). Percent of neoTCR+ cells infused per TCR (right; correlation Spearman r = 0.7475, ****P < 0.0001). Area under the curve (AUC) was calculated from day 0 (pre-infusion) up to day 7. Data not shown for patient 0404; no day 0–7 post-infusion samples available.

