

Introduction
Immune checkpoint therapy (ICT) is being tested in the neoadjuvant setting for patients with localized urothelial carcinoma (UC) 1,2, with one study reporting data in cisplatin-ineligible patients who received anti-PD-L1 monotherapy 2. The study reported that patients with bulky tumors, a known high-risk feature defined as greater than clinical T2 disease, had fewer responses, with pathologic complete response (pCR) rate of 17% 2. Here, we report on the first pilot combination neoadjuvant trial (NCT02812420) with anti-PD-L1 (durvalumab) plus anti-CTLA-4 (tremelimumab) in cisplatin-ineligible patients, with all tumors identified as having high-risk features (N=28). High-risk features were defined by bulky tumors, variant histology, lymphovascular invasion, hydronephrosis, and/or high-grade upper tract disease 3–5. Primary endpoint was safety and we observed 6 of 28 patients (21%) with grade ≥3 immune-related adverse events, consisting of asymptomatic laboratory abnormalities (N=4), hepatitis and colitis (N=2). We also observed pCR of 37.5% and downstaging to pT1 or less in 58% of patients who completed surgery (N=24). In summary, we provide initial safety, efficacy and biomarker data with neoadjuvant combination anti-PD-L1 plus anti-CTLA-4, which warrants further development for patients with localized UC, especially cisplatin-ineligible patients with high-risk features who do not currently have an established standard-of-care neoadjuvant treatment.
Cisplatin-based NAC has been shown to provide long-term survival benefit in patients with muscle invasive urothelial carcinoma (MIUC) who can receive cisplatin 6–11. However, up to 50% of patients with MIUC cannot receive cisplatin-containing chemotherapy due to decreased renal function, neuropathy, hearing loss, poor performance status or symptomatic heart failure 12 and therefore, do not have a standard-of-care NAC 13–15. Following its success in the metastatic setting 16–22, monotherapy ICT was tested in the neoadjuvant setting of MIUC and showed promising pathological complete response (pCR) rates in cisplatin-ineligible patients 2. However, pCR rates were observed in a population of patients with a relatively low proportion of T3/T4 disease 2. In patients who are both cisplatin-ineligible and with high-risk MIUC, as defined by features of bulky T3/T4 tumors, variant histology, lymphovascular invasion, hydronephrosis, and/or high-grade upper tract disease (in the ureter or renal pelvis), ICT has not been evaluated in the neoadjuvant setting. Since these high-risk features have been known to be associated with up-staging of disease at upfront cystectomy (without NAC) 23 and poor survival 3–5, we postulated that combined ICT with anti-PD-L1 plus anti-CTLA-4, which has been known to be superior to monotherapy ICT in terms of response rates and overall survivals in other types of cancer 24,25, may be particularly advantageous for cisplatin-ineligible patients with high-risk MIUC. To test this hypothesis, we investigated combination ICT with durvalumab plus tremelimumab as neoadjuvant therapy in a pilot clinical trial to establish safety, efficacy, and potential biomarkers of response in cisplatin-ineligible patients with high-risk MIUC.
Between April 2017 and December 2018, we enrolled 28 patients with high-risk, cisplatin-ineligible, localized MIUC on the first cohort of NCT02812420 (Extended Data Fig. 1). Each patient had baseline transurethral resection of bladder tumor (TURBT) and was then treated with a combination of durvalumab (1500 mg/kg) and tremelimumab (75 mg/kg) every 4 weeks for a total of two combination doses before cystectomy. Pre- and post-treatment blood and tumor tissues were obtained for correlative studies. Demographics and disease characteristics are summarized in Table 1 and Supplementary Table 1. The median age was 71 (range: 24–83) and the majority of patients were male (71%). At baseline, T3 and T4 disease occurred in 43% and 11% of patients, respectively. All patients harbored one or more of the previously published high-risk features of MIUC 3–5. In particular, 25% of patients had UC with variant histology. All patients met cisplatin-ineligibility criteria 12, with 25 (90%) patients being unfit for cisplatin and 3 (10%) declining chemotherapy.
Table 1.
Patient Baseline Characteristics
| Characteristics | (N=28) |
|---|---|
|
| |
| Age | |
| Median | 71 |
| Range | 24–83 |
| Sex (%) | |
| Male | 20 (71%) |
| Female | 8 (29%) |
| Histology (%) | |
| UC with squamous cell carcinoma component | 2 (7%) |
| UC with micropapillary features | 2 (7%) |
| UC with plasmacytoid features | 1 (3.5%) |
| UC with small cell component | 1 (3.5%) |
| UC with sarcomatoid features | 1 (3.5%) |
| Pure UC | 21 (75%) |
| Clinical Stage at Baseline (%) | |
| T1a | 1 (4%) |
| T2 | 12 (43%) |
| T3 | 12 (43%) |
| T4 | 3 (11%) |
| High risk features (%)b | |
| Exam under anesthesia showing 3-D mass | 12 (43%) |
| Hydronephrosis | 6 (21%) |
| Lymphovascular invasion | 4 (14%) |
| Variant histology | 7 (25%) |
| T4a | 3 (11%) |
| High grade upper tract UC | 2 (7%) |
| Reasons for cisplatin ineligibility (%) c | |
| CrCl per Cockcroft Gault <60 mL/min | 18 (64%) |
| Cardiac dysfunction | 4 (14%) |
| Neuropathy | 2 (7%) |
| Hearing impairment | 5 (17%) |
| Patients declining chemotherapy | 3 (10%) |
cT1 with high grade histology, diffuse involvement of disease throughout the bladder and high-risk feature of micropapillary disease
five patients fulfill multiple high-risk features
six patients fulfilled multiple cisplatin-ineligibility reasons
ECOG PS: Eastern Cooperative Oncology Group performance status, UC: urothelial carcinoma, 3-D: 3-dimensional, CrCl: creatinine clearance.
No deaths related to therapy occurred. The majority of patients experienced an immune-related adverse event (irAE) of any grade. The most common irAE was grade 1 or 2 rash and asymptomatic increase in amylase, each occurred in 29% of patients. The study did not exceed its safety or futility rules (described in materials and methods) with six patients (21%) experiencing grade 3 or higher irAEs (Fig. 1a; Supplementary Tables 2 and 3). Of these six patients, three had asymptomatic lipase and amylase elevation, one had asymptomatic hyponatremia and two patients (7%) experienced immune-related hepatitis and/or colitis. The two patients who had grade 3 immune-related hepatitis and/or colitis had a delay in cystectomy; however, despite this delay, one patient still demonstrated response to therapy. Twenty-four of twenty-eight (86%) patients completed cystectomy per protocol. One patient had a delay in cystectomy due to patient’s scheduling preference, while two patients had delays related to toxicities (grade 3 hepatitis and/or colitis). Among patients with delay in time to surgery, the median delay was 35 days (min=8, max=37) from expected surgery date. Otherwise, 21 of 24 patients underwent cystectomy within 4–6 weeks of last dose of combination treatment per clinical trial protocol (Extended Data Fig. 1). The outcome of the four patients that did not proceed with cystectomy as per clinical trial protocol is outlined in Supplementary Table 4. We did not observe any additional irAEs as post-cystectomy complications but we did observe routine post-surgical complications as noted in Supplementary Table 5, which were similar to those reported in other published studies 6,26. The irAEs were successfully managed with immunosuppressive therapy and only four patients required systemic immunosuppressive therapy in the form of steroids alone (n=2), or steroids combined with other agents such as mycophenolate and/or infliximab (n=2). Three of those four patients were noted to be responders. We did not observe any correlation between the severity of irAEs and response to treatment (Extended Data Fig. 2a). Of note, neoadjvuant clinical trials with monotherapy anti-PD-1/PD-L1 therapy indicated grade ≥ 3 irAEs in 11% of cisplatin-ineligible patients (10 of 95 total) 2 and 6% (3 of 50 total) of cisplatin-eligible patients 1.
Figure 1. Safety and efficacy outcomes of patients with high-risk, cisplatin-ineligible urothelial carcinoma to neoadjuvant therapy with durvalumab plus tremelimumab.
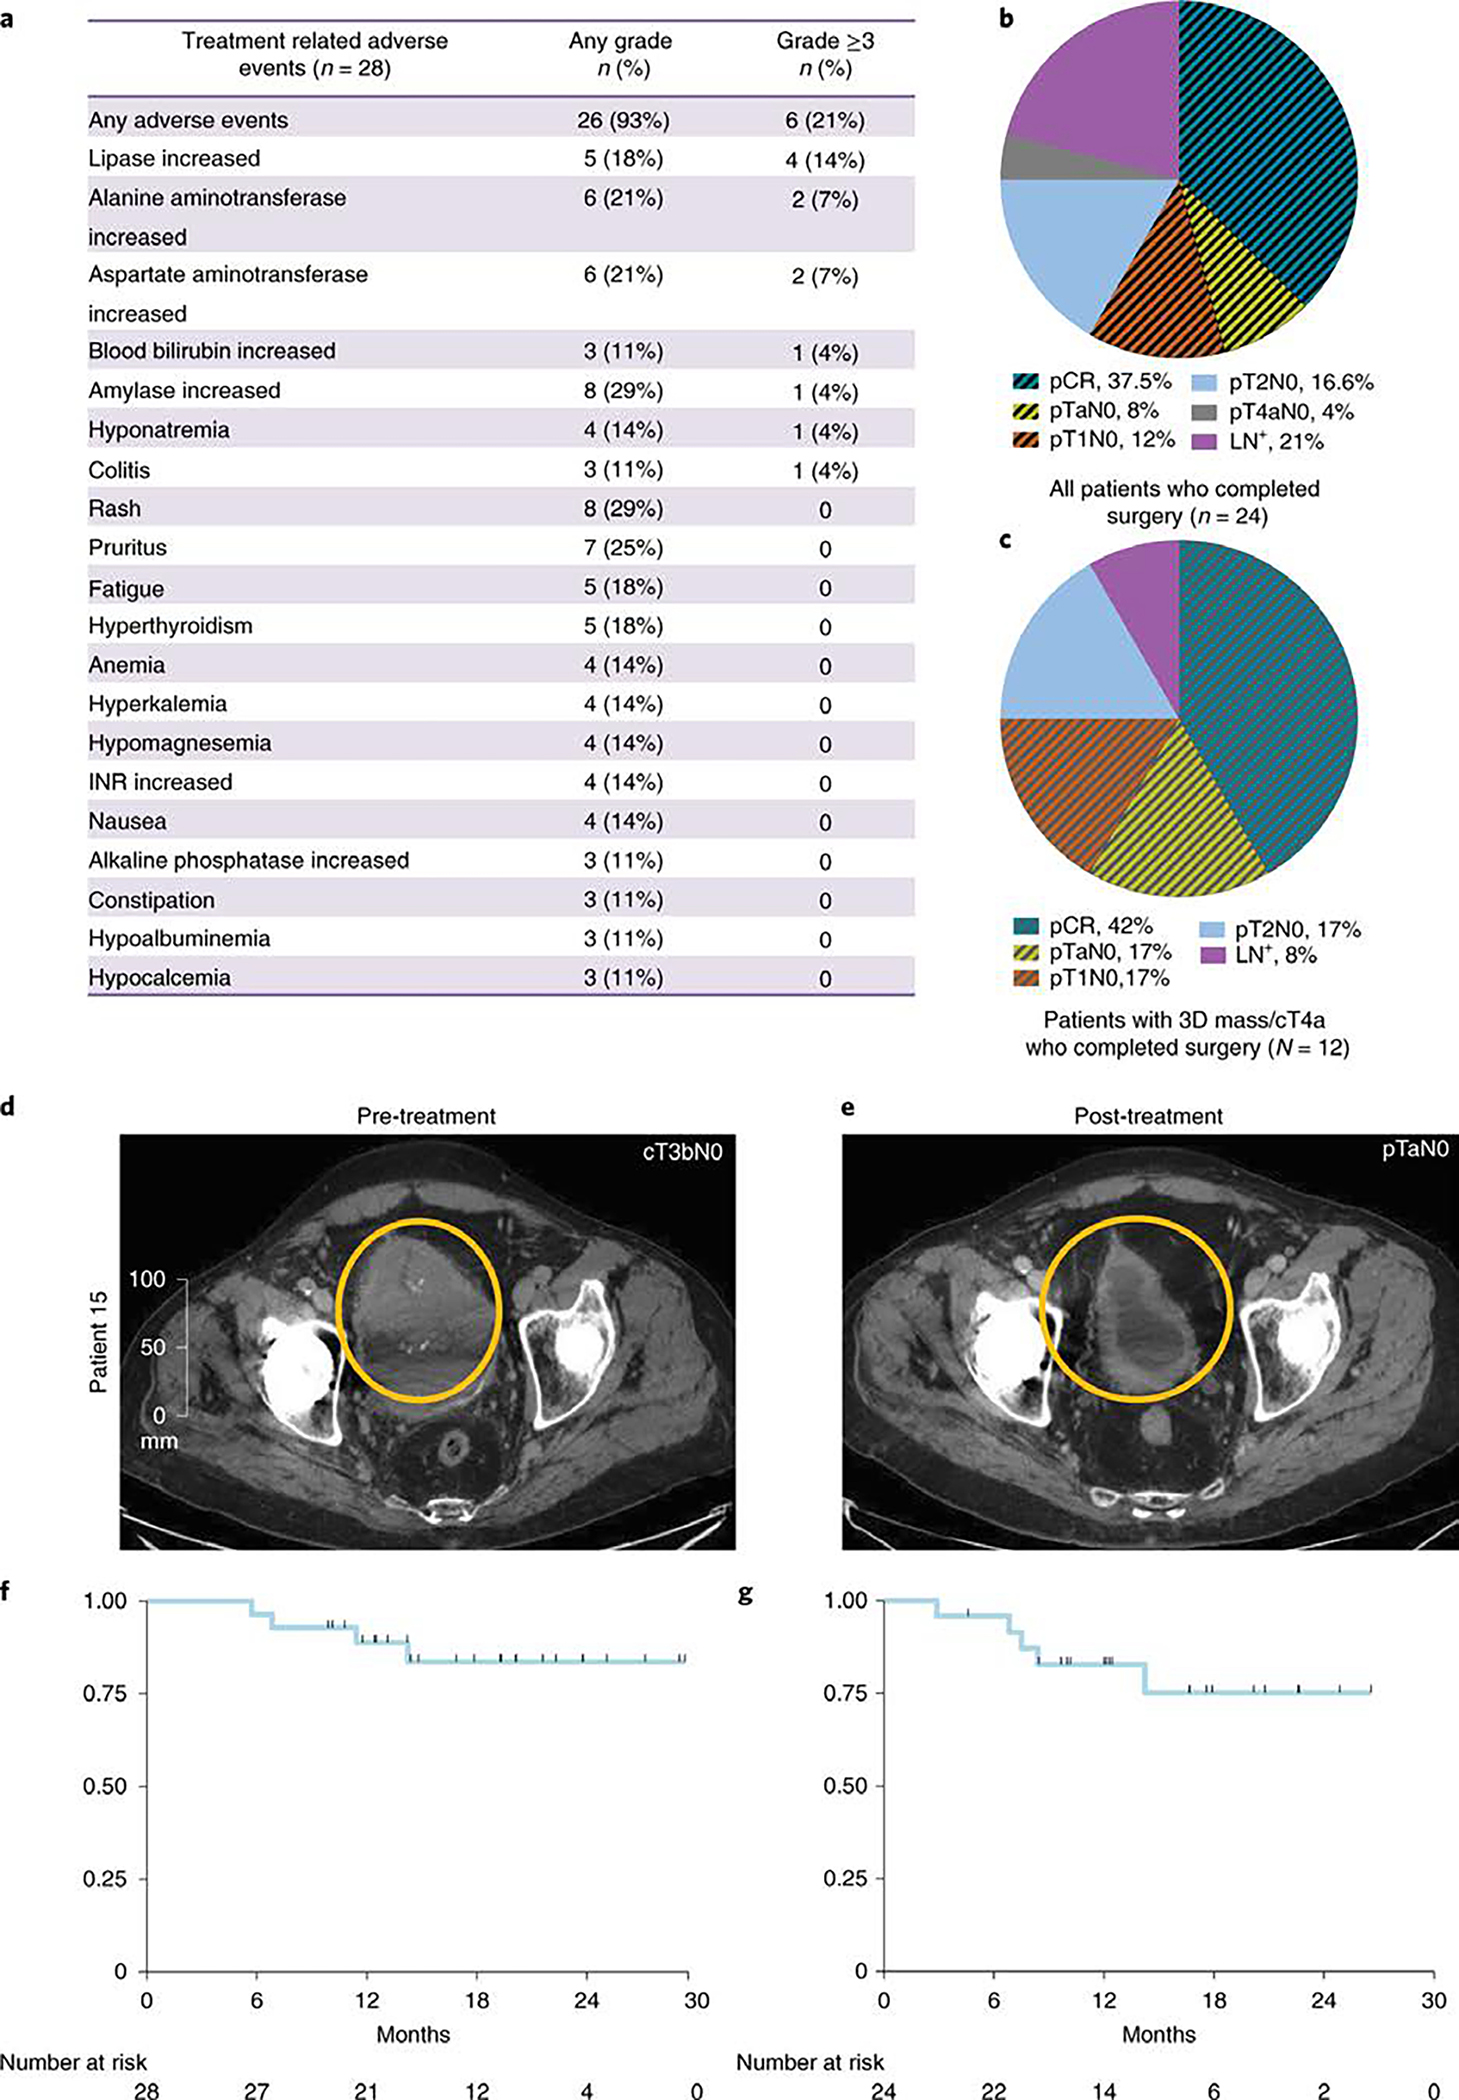
a, pertinent treatment related adverse events, b, Pie chart of post-durvalumab + tremelimumab treatment pathologic stages in all 24 patients who completed cystectomy. c, Pie chart of post-durvalumab plus tremelimumab treatment pathologic stages in the 12 patients with 3-D mass/cT4a disease who completed cystectomy. d, CT scans showing a large bladder tumor at pre-treatment and e, Near complete resolution of the bladder tumor after durvalumab plus tremelimumab treatment. f, Overall survival (OS). All patients (N=28) were included in the OS analysis using Kaplan–Meier (KM) methods. One-year OS was 88.8% (SE=6.1%). g, Relapse-free survival (RFS). Patients who underwent cystectomy were included in the analysis (N=24). One-year RFS was 82.8% (SE=7.9%). pCR: Pathologic complete response; pT: Pathologic T stage; LN+: Lymph node positive disease.
Post cystectomy, the overall pCR (pT0 or pTis) rate was 37.5% (9 of 24) and the overall downstaging (p ≤ T1N0) rate was 58.3% (14 of 24) (Table 2, Fig. 1b). In an intention-to-treat (ITT) analysis of all 28 enrolled patients, the pCR rate was 31.7% (9/28) and downstaging rate to pT1 or less was 50% (14/28). The pathologic response rates were particularly encouraging in the twelve patients with large T3/T4 tumors with a pCR rate of 42% and downstaging (pT ≤ 1N0) rate of 75% (Table 2, Fig. 1c). As an example, patient #15 had a palpable mass on exam under anesthesia (EUA) and baseline imaging revealed a large visible tumor that could not be completely resected by TURBT (Fig. 1d). However, after two cycles of therapy, no residual disease was seen on repeat CT scans (Fig. 1e) and only pTaN0 disease was found after cystectomy (Table 2). Of note, 7 patients had UC with variant histology (squamous, plasmacytoid, sarcomatoid, micropapillary or small cell), 4 (57%) of which achieved a pCR (Extended Data Fig. 2b). Patients who did not achieve a response include those with plasmacytoid (n=1), micropapillary (n=1) or small cell (n=1) variants, which is different from a previously published study 27 that demonstrated a high response rate (72%) to immune checkpoint monotherapy for patients (N=11) with neuronal subtype of bladder cancer.
Table 2.
Clinical to pathologic staging changes
| Patient # | Clinical Stage at Baseline | Histology | Pathologic Stage |
|---|---|---|---|
|
| |||
| 2 | cT2 | UC | pT0N0 |
| 3 | cT2¥ | UC | pT0N0 |
| 4 | cT2¥ | UC | pT4aN0 |
| 5 | cT4a | UC | pT0N0 |
| 8 | cT3b, 3-D mass on EUA | UC with squamous differentiation | pT0N0 |
| 9 | cT2¥ | UC with plasmacytoid features | pT4N2 |
| 10 | cT2 | UC | pT1N0 |
| 11 | cT4a¥ | UC | pT1N0 |
| 12 | cT2¥ | UC with sarcomatoid features | pT0N0 |
| 13 | cT3b, 3-D mass on EUA | UC | pT2aN0 |
| 15 | cT3b, 3-D mass on EUA | UC | pTaN0 |
| 16 | cT3b, 3-D mass on EUA | UC | pT2N0 |
| 18 | cT2 | UC | pT3bN1 |
| 22 | cT2 | UC | pT2N0 |
| 23 | cT3b, 3-D mass on EUA | UC with squamous differentiation | pT0N0 |
| 24 | cT3b, 3-D mass on EUA | UC | pTisN0 |
| 25 | cT3b, 3-D mass on EUA | UC | pTis & TaN0 |
| 31 | cT2 | UC with focal micropapillary features | pT4aN2 |
| 32 | cT3b, 3-D mass on EUA | Small cell carcinoma | pT2N1 |
| 34 | cT2 | UC | pT2N0 |
| 35 | cT2¥ | UC | pT2N1 |
| 36 | cT3b, 3-D mass on EUA | UC | pT0N0 |
| 37 | cT1* | UC with focal micropapillary features | pT0N0 |
| 38 | cT3b | UC | pT1N0 |
cT1 with high grade histology, diffuse involvement of disease throughout the bladder and high-risk feature of micropapillary disease
These patients had a second TURBT to further evaluate disease status prior to cystectomy
UC: urothelial carcinoma
Patients had a median follow-up time of 19.2 months at the time of data collection. With four deaths among all patients (N=28), overall survival (OS) was 88.8% (SE=6.1%) at 1 year (Fig. 1f). The relapse free survival (RFS) for 24 patients who underwent cystectomy was 82.8% (SE=7.9%) at 1 year (Fig. 1g), with disease relapse in 3 patients and death in 2 patients due to unrelated medical comorbidities.
Previously published data from an anti-PD-L1 monotherapy neoadjuvant trial in cisplatin-ineligible patients with MIUC indicated that an 8-gene signature from baseline tumor tissues correlated with response to treatment 2; however, our data with anti-CTLA-4 plus anti-PD-L1 combination therapy did not demonstrate a statistically significant difference in expression of the 8-gene signature in pre-treatment tumor tissues for responder vs non-responder patients (Fig. 2a). Such discordance between predictive signatures for monotherapy vs combination therapy is likely explained by the fundamental differences in cellular mechanisms between anti-CTLA-4 and anti-PD-1/PD-L1 therapy 28–30. Additionally, we did not observe any correlation between responses and PD-L1 expression on tumor or immune cells (Extended data Fig. 3a, b) in pre-treatment tumor tissues, which is similar to data published by another group 2. We performed whole-exome sequencing (WES) and observed that neither tumor mutation burden (TMB), predicted neoantigens, nor DNA-damage response (DDR) genes correlated with response to therapy (Fig. 2b, c, and Extended Data Fig. 4 and 5a). Our study joins another study 2 in demonstrating the insufficiency of TMB as a predictor of response in the neoadjuvant setting of MIUC. Furthermore, a previous study31 reported mutations in genes such as KRAS, PIK3CA, and EGFR as having association with responses to ICT. Therefore, we analyzed KRAS, PIK3CA, PBRM1, EGFR, NRAS, APC2 and FGFR mutations in our cohort of bladder patients. We did not find any association between these specific mutations and response to combination immune checkpoint therapy in our small cohort of patients (Extended Data Fig. 5b). In addition, we performed CyTOF analysis on blood samples but did not observe any treatment-related changes in the frequency of CD4 T cells expressing suppressive markers (PD-1, TIM-3, and LAG-3) (Extended Data Fig. 6a–c). However, as previously published 32, we observed an increased frequency of ICOS+ CD4 T cells in blood samples from both responder and non-responder patients, which represents a pharmacodynamic biomarker of anti-CTLA-4 based therapy (Extended Data Fig. 6d, e). Furthermore, an increase in frequency of ICOS+ CD4 T cells in tumor tissues after anti-CTLA-4 therapy was previously reported 33,34 and our data demonstrated a significant increase in the frequency of ICOS+ CD4 T cells in post-treatment tumor tissues of responder patients as compared to non-responder patients (Extended Data Fig. 6f, g). Moreover, we observed a higher density of tertiary lymphoid structures (TLS) in pre-treatment tumor tissues of responder patients as compared to non-responder patients (Fig. 2d–g). Higher density of TLS in pre-treatment tumor tissues correlated with a longer overall survival (OS) and a longer relapse-free survival (RFS) (Fig. 2h, i). To further characterize specific immune cell subsets that may comprise TLS and correlate with response to therapy, we evaluated 19 available pre-treatment tumor samples for CD20+ B cells, CD4 T cells and CD8 T cells. Responder patients (N=10) had a significantly higher density of B cells, CD4 T cells, and CD8 T cells in pre-treatment tumor samples as compared to non-responder patients (N=9) (Extended Data Fig. 7a–c). In addition, a previous study35 identified POU2AF1, which plays a role in germinal center initiation, as a gene that defines TLS. Therefore, we selected 16 available pre-treatment tumor samples with TLS structures and evaluated POU2AF1 expression. We observed a significantly higher expression of POU2AF1 in responders (N=9) as compared to non-responders (N=7) (Extended Data Fig. 8a). Also, based on previous studies35,36, we derived a 4-gene TLS signature comprised of POU2AF1, LAMP3, CD79A and MS4A1 and found a significantly higher expression of this 4-gene TLS signature in responders (N=9) as compared to non-responders (N=7) (Extended Data Fig. 8b). These data highlight TLS as a potential predictive biomarker to select patients with MIUC who will respond to ICT, which is similar to data recently reported for melanoma, sarcoma and renal cell carcinoma 35–37.
Figure 2. Exploratory biomarker analysis: gene expression, DNA alterations and tertiary lymphoid structures (TLS) in pre-treatment tumor tissue samples.
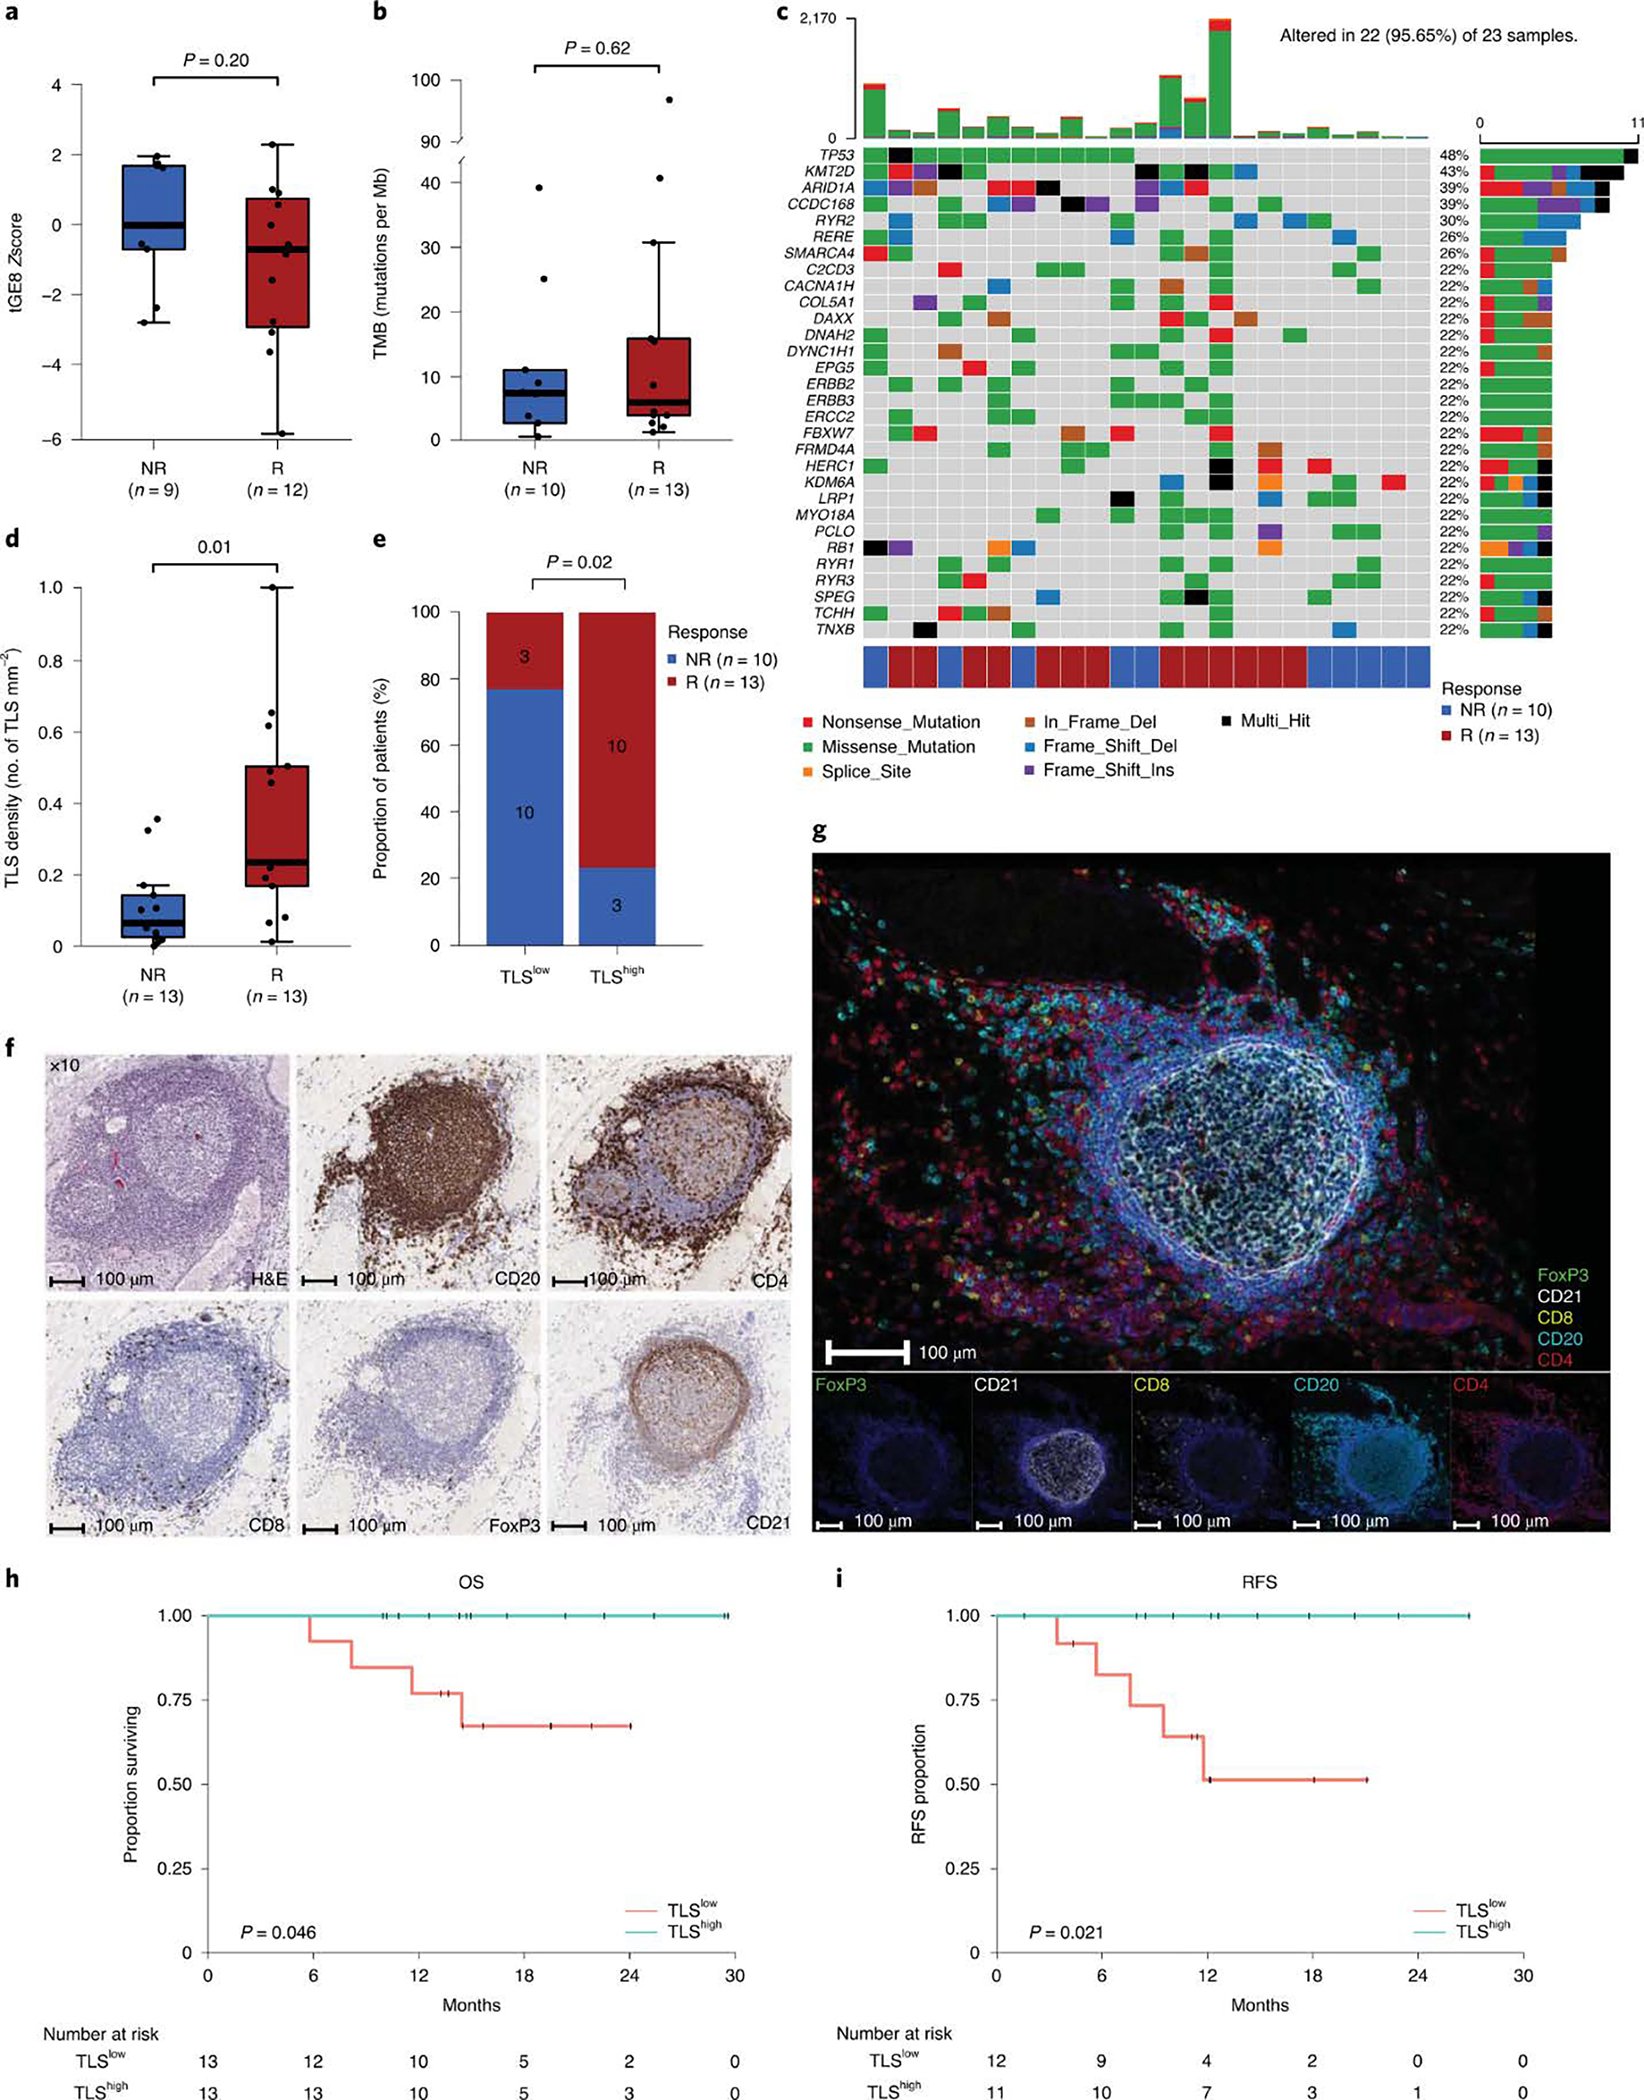
Pre-treatment tumor tissue samples from patients enrolled in the study were analyzed by nanostring, whole exome sequencing, immunohistochemistry, and multiplex immunofluorescence. a-e, The tumor and immune microenvironment molecular profiles and TLS density were compared between responders (R, red) and non-responders (NR, blue) a, Box plot showing a comparison of tGE8 transcriptional signature derived from gene expression profiling of pre-treatment tumor tissue samples from R (n=9) and NR (n=12) patients. The number of patients (n) in each cohort are indicated below the x-axis. P values were calculated using the two-sided unpaired student’s t–test. b, Box plot showing tumor mutation burden (TMB, number of somatic mutations per megabase) did not differ significantly between the R (n=13) and NR (n=10) groups. The number (n) of patient samples analyzed in each group are also listed below the x-axis. P values were calculated using two-sided Wilcoxon rank-sum test. c, Oncoplot showing the somatic mutation landscape of the most frequently mutated genes. Each row represents a gene, which are ordered based on decreasing mutation frequencies from top to bottom. The gens are listed on the left and their respective frequencies are listed on the right of the heatmap. Each column represents a patient and the color bar at the bottom shows clinical response for each patient, which is color coded for R (red) and NR (blue). The number of patients in each response category: NR, n=10 and R, n=13 are also listed below the color bar. The colors of rectangles in the body of the heatmap indicates different types of somatic mutations and the key identifying each mutation type is shown at the bottom below the color bar for response. The bar plot on the top shows the counts of mutations for each patient sample and the colors in the bar plots correspond to the colors showing mutation types in the body of the heatmap. The bar plot on the right side shows the counts of mutations for each gene and the colors in the bar plots correspond to the colors showing mutation types in the body of the heatmap. d, Box plot showing association of tertiary lymphoid structures (TLS) in pre-treatment tumor tissue samples with response, higher TLS density in responders (R, n=13) compared to non-responders (NR, n=13). The number (n) of patient samples analyzed in each group are also listed below the x-axis. P values were calculated using two-sided Wilcoxon rank-sum test. For the box plots in a, b, and d: The horizontal bold line represents the median. The lower and upper hinges of the box correspond to the first and third quartiles (the 25th and 75th percentiles); the upper whisker extends from the hinge to the largest value no further than 1.5 × IQR from the hinge (where IQR is the distance between the first and third quartiles); and the lower whisker extends from the hinge to the smallest value at most 1.5 × IQR from the hinge. e, Stacked bar plot showing distribution of responder and non-responder patients stratified by pre-treatment TLS density (low versus high). A significant difference was observed between the two groups with the TLShigh group showing higher proportion of responders. Actual number of patients in each group are indicated within the bar plots. P values shown on the graph were calculated using two-sided Fisher’s exact test. f, Representative single stain IHC images showing a TLS from baseline tumor tissue of a responder patient; however, 26 patients (R=13 and NR=13) had similar analyses completed with corresponding images that were used to generate the data in d and e. Images of a TLS at 10X magnification are shown for haematoxylin and eosin (H&E) staining and single stain IHC of CD20, CD4, CD8, FoxP3, and CD21. g, Representative images from multiplex immunofluorescence staining of pre-treatment tumor tissue of a responder patient showing a tertiary lymphoid structure (TLS) using the following markers: CD20, CD4, CD21, CD8, FOXP3 and DAPI. Original magnification, 20X. Images were reproduced in samples from 4 other patients in order to confirm that the TLS structures were comprised of CD4 T cells, CD8 T cells and CD20 B cells. h, Kaplan-Meier estimates of overall survival (OS, n=26 patients) by pre-treatment TLS density shown by high (TLShigh, turquoise) and low (TLSlow, salmon) groups. The median pre-treatment TLS density (0.155 TLS/mm2) was used as the cutoff to segregate the groups. Patients with a TLS density above the median were grouped to the TLShigh group and the remaining patients were grouped to the TLSlow group. Patient numbers are included in the table below the graph and P values were calculated by two-sided log-rank test. Overall survival was defined as the time interval between first dose of treatment and death or last contact. i, Kaplan-Meier estimates of relapse free survival (RFS, n=23 patients) by pre-treatment TLS density as described in h, above. Patient numbers are included in the table below the graph and P values were calculated by log-rank test. Relapse free survival was defined as the time between cystectomy and death, relapse, or last follow up.
ICTs with anti-CTLA-4 and anti-PD-1/PD-L1 have revolutionized the treatment of patients with stage 4 cancers. As a result, ICT is now being moved into earlier disease settings, including the neoadjuvant setting 1,2,38,39. For patients with MIUC, two neoadjuvant trials, one in cisplatin-eligible patients and one in cisplatin-ineligible patients, have been reported for anti-PD-1/PD-L1 monotherapy 1,2. Here, we report the first neoadjuvant combination clinical trial with two cycles of anti-CTLA-4 plus anti-PD-L1 in cisplatin-ineligible patients who have MIUC with high-risk features. Furthermore, pCR rates of 42% in patients with T3/T4 disease suggest an added clinical benefit with combination ICT to single agent ICT where pCR rates in this subgroup of patients were reported at 17% 2. A second trial (NCT03387761), evaluating combination ICT therapy with anti-CTLA-4 plus anti-PD-1 in cisplatin-ineligible patients with stage 3 MIUC, was also recently reported 40 and further highlights the encouraging activity of combination therapy. In summary, our data indicate that two cycles of neoadjuvant combination therapy had a tolerable safety profile and encouraging efficacy results, which warrant future clinical trials to further develop combination treatment with anti-CTLA-4 plus anti-PD-L1 for cisplatin-ineligible patients with MIUC and determine the optimal duration of therapy.
METHODS
1. Study population and trial design
This is a pilot, single-arm clinical trial to evaluate neoadjuvant therapy with durvalumab plus tremelimumab in patients with high-risk, cisplatin-ineligible urothelial carcinoma. This trial is sponsored by AstraZeneca/Medimmune and has been approved by the MD Anderson Cancer Center (MDACC) Institutional Review Boards (IRB) (MDACC 2016-0033; NCT02812420). All patients provided informed consent to participate on the IRB-approved clinical trial after discussion of the clinical trial with each patient by the treating physician. The primary objective of this trial is to evaluate the safety and tolerability of anti-PD-L1 plus anti-CTLA-4 in the neoadjuvant setting. Safety and tolerability were assessed at each patient’s clinical visit and documented as per the National Cancer Institute Common Terminology Criteria for Adverse Events, version 4.03. The secondary objectives include: 1) to assess immunologic and molecular responses to anti-PD-L1 plus anti-CTLA-4; 2) to evaluate pathologic responses after neoadjuvant treatment.
2. Treatment
The total accrual for this trial is 45 patients treated in two cohorts. The first cohort of 28 patients received two cycles of durvalumab (1500 mg) plus tremelimumab (75 mg) on weeks 1 and 5. The second cohort of 17 patients will receive durvalumab (1500 mg) plus tremelimumab (300 mg) on week 1 and only durvalumab (1500 mg) on week 5 as a pilot study to test alternative dosing combination for durvaluamb plus tremelimumab. Patients then undergo surgery with cystectomy and bilateral pelvic lymph node dissection between weeks 9 and 11. Pre- and post-treatment blood and tumor samples were collected for correlative biological analyses per an IRB-approved laboratory protocol MDACC PA13-0291. We’re reporting data on the first cohort of 28 patients who were treated with the combination of durvalumab (1500 mg) plus tremelimumab (75 mg) on this trial.
3. Patients
Subjects must be considered cisplatin-ineligible as per the following definition 12: GFR < 60, CHF NYHA class III or higher, peripheral neuropathy grade 2 or higher, ECOG score ≥ 2 or impaired hearing. Patient’s refusal of traditional chemotherapy was also included. GFR is either measured using a 24-hour urine collection, calculated using Cockroft-Gault, or estimated using the MDRD method from the National Kidney Disease Education Program (NKDEP) (the method reported by MDACC laboratories). Patients with the following high-risk features were included in this trial: lymphovascular invasion; hydronephrosis; 3-D mass on EUA; pathologic variants including micropapillary, sarcomatoid and plasmacytoid; small cell bladder cancer but refusing chemotherapy; high-grade (grade 3) tumors of the ureter or renal pelvis with radiographic abnormality large enough to be recognized as an abnormal mass by CT or MRI; or direct invasion of the prostatic stroma or the vaginal wall (i.e. cT4a disease). During screening, patients were evaluated by a surgeon to determine if they were good candidates for cystectomy with pelvic lymph node dissection (or other applicable surgery to resect tumors). All patients were also required to provide a pre-treatment TURBT biopsy sample. A cystoscopy (or applicable imaging) with optional TURBT was performed at week 4 (post-treatment dose 1) to rule out patients with rapid disease progression. All subjects were followed every 3 months after cystectomy for a total of 1 year from the start on the study.
4. Objectives and statistical plan
The trial was initially designed as a 15-patient pilot trial to evaluate safety of combination ICT durvalumab (anti-PD-L1) plus tremelimumab (anti-CTLA-4) prior to surgery. Due to the fact that the treatment was found to be well-tolerated in the first 15 patients and we observed an unexpectedly high pCR rate, the trial was expanded to 2 cohorts. Cohort 1 has a total of 28 patients, and treatment consisted of 2 doses of tremelimumab (75 mg) + durvalumab (1500 mg). Cohort 2 has a total of 17 patients, and treatment will consist of one dose of tremelimumab (300 mg) + durvalumab (1500 mg) followed by durvalumab (1500 mg) alone to test alternative dosing combination. A total of 45 patients was chosen based on an estimation of our group to complete enrollment of 45 patients within 3 years. Cohort 1 had target accrual of 28 patients, which was completed. Cohort 2 has target accrual of 17 patients and is ongoing. Safety (stop if toxic events significantly higher than 30%) and futility (stop if pT0 rate significantly less than 20%) stopping rules were implemented for the primary endpoint of the study. These analyses were based on the joint monitoring strategy developed by Thall et al 41. The delay in time to surgery was calculated after the expected surgery date of 4 weeks from last dose of combination therapy with tremelimumab plus durvalumab. RFS was defined as the time from surgery until relapse or death from any cause (event) among patients who were rendered free of disease by surgery. OS is defined as the time from treatment start until death from any cause. Analyses were performed in SAS 9.4 [The SAS Institute Inc, Cary, NC]. Kaplan-Meier curves were created in Stata 14.1 [StatCorp, College Station, TX].
5. CyTOF analysis
Peripheral blood mononuclear cells (PBMCs) were separated by Ficoll isolation from blood samples collected at different time points, pre-treatment, post treatment-dose 1 and post treatment-dose 2 (Extended Data Fig. 1) on the day of collection and were fixed and frozen for future analysis. Thawed cells were stained with 37 antibodies (Supplementary Table 6), including PD1, PD-L1, ICOS, TIM3, LAG-3, and CD4. Metal conjugated antibodies were purchased from Fluidigm or purified unlabeled antibodies were metal-labeled in house. Stained cells were barcoded using Cell-ID™ 20-Plex Pd Barcoding Kit (Fluidigm). Normalization of CyTOF data was performed using normalizer in R package premessa. Normalized files for individual samples were then used for downstream analyses. For the cluster identification, manually gated live CD45+ cells were exported and utilized for clustering analysis using approaches previously described as “CyTOF workflow” 42. Data from samples with poor viability and insufficient events was excluded to avoid inaccurate clustering and frequency calculations 28. Data were analyzed with Prism 8 (GraphPad Software). Statistical significance was determined by Wilcoxon rank-sum test (for Extended Data Figure 5 a–d) and Wilcoxon signed-rank test (for Extended Data Figure 5 e–f). P < 0.05 was considered statistically significant.
6. NanoString
Formalin fixed paraffin embedded (FFPE) tumor tissue sections were evaluated for tumor content and tissue quality by pathology. Tissue blocks which were approved by pathology were processed for RNA isolation by de-waxing using deparaffinization solution (Qiagen, Valencia, CA). Total RNA was extracted using the RecoverALL™ Total Nucleic Acid Isolation kit (Ambion, Austin, TX) according to the manufacturer’s instructions. RNA purity was assessed on the ND-Nanodrop1000 spectrometer (Thermo Scientific, Wilmington, MA, USA). For NanoString assay, 100 ng of RNA was used to detect immune gene expression using nCounter PanCancer Immune Profiling panel along with custom CodeSet. Counts of the reporter probes were tabulated for each sample by the nCounter Digital Analyzer and raw data output was imported into nSolver (http://www.nanostring.com/products/nSolver, v4.0). nSolver data analysis package was used for normalization. Z scores were computed for the following; tGE8 interferon-gamma signature 2 and 4-gene TLS signature. For our analysis, tGE8 signature is comprised of 8 genes (IFNG, CXCL9, CD8A, GZMA, GZMB, CXCL10, PRF1 and TBX21). For the 4-gene TLS signature, we used CD79A, MS4A1, LAMP3, and POU2AF135,36. Z-scores were computed based on published methods 43. For statistical analysis, unpaired student’s t-test was used where two groups were compared.
7. Immunohistochemistry analysis
Tertiary lymphoid structures were evaluated on formalin-fixed paraffin-embedded (FFPE) tissue sections obtained at pre-treatment time point from urothelial carcinoma patients (Extended Data Fig. 1). Out of 28 patients enrolled in the study a total of 27 patient tumor tissue samples were analyzed, one patient (Pt# 33) declined surgery and was excluded from analysis. After H&E evaluation of pre-treatment tissues, one case (Pt# 5) was excluded due to low cellularity. The remaining 26 patient tumor tissue samples were grouped into responders (n=13) and non-responders (n=13) for correlative studies. Structures were identified as aggregates of lymphocytes expressing CD20 (Dako, Cat#M075529) and CD3 (Dako, Cat#A0452) and having morphological similarity to lymphoid tissue within the germinal centers. TLS density were quantified as previously described 36. Remaining pre-treatment tumor samples (n=19) were evaluated by single-staining IHC studies for CD20, CD4 (Leica Microsystems cat# NCL-L-CD4-368) and CD8 (Thermo Scientific, MS-457-S). Tumor tissues were fixed in 10% formalin, embedded in paraffin, and transversely sliced into 4 μm sections. PD-L1 (Cell Signaling, Cat#13684S) single-staining IHC studies were also performed on pre-treatment tumor samples. Sections were processed with peroxidase-conjugated avidin/biotin and 3’-3-diaminobenzidine substrate (Leica Microsystem), and the IHC slides were scanned and digitalized using the Scanscope XT system (Aperio/Leica Technologies). Single stain IHC quantification analysis was performed by the pathologist using the HALO 2.3 software (Indica Labs). The number of marker positive cells for each analysis area were calculated and expressed as density (number of positive cells/mm2). PD-L1 immune quantification on different cell subsets has been well established as previously published 44. Statistical analysis was calculated using Wilcoxon rank-sum test and densities were plotted in R-3.6.1. P <0.05 was considered statistically significant.
8. Whole-exome sequencing data analysis
DNA from FFPE tissues and peripheral blood was obtained using the QiaAmp DNA FFPE Tissue Kit and QiaAmp DNA Mini kit, respectively (Qiagen). Whole-exome sequencing (WES) was performed on tumor tissues from 23 patients (13 responders and 10 non-responders) using standard protocol. Paired peripheral blood was used as a matched normal sample. Library construction was performed using manufacturer’s instructions. Briefly, ~250 ng genomic DNA was sheared using the Covaris S2 sonicator. KAPA Hyper Prep Kit with Agilent SureSelect XT Target Enrichment System was used for end repair, A-base addition, adaptor ligation, and library enrichment PCR. Sample concentrations were measured following library construction using the Agilent Tapestation. Hybridization reaction was then performed for exon capture using the manufacturer’s guidelines (Agilent SureSelect-XT Human All Exon v4). The libraries were normalized to equal concentrations using a QuantStudio 6 Flex instrument and pooled to equimolar amounts. Libraries were quantified using the Agilent Tapestation and sequenced using the Illumina HiSeq 2500 platform at a coverage of ~200X for tumor samples and ~100X for normal samples. The BWA aligner 45 was used for sequence alignment to the human reference genome, GRCh37 (UCSC genome browser: genome.ucsc.edu). The average exome-wide coverage ranges in 91.7–287.5-fold (median 151.4) in tumor samples and 73.3–187.3-fold (median 96.9) in the matched normal samples. SNV and indel calls were made with Mutect 46 and Pindel 47, respectively. The mutations were annotated by ANNOVAR 48. Germline variants were filtered using germline DNA from paired blood samples. The resulting germline-filtered variants were subjected to additional filtering using the following criteria to get the final variants: (a) we included dbSNPs that were “novel” or the ones already existing in COSMIC; (b) each variant had a coverage of at least 20x for tumor and 10x for normal samples; (c) we included the SNVs with a VAF >=0.05 and <0.01 for tumor and normal samples, respectively and at least 4 reads to support the call at SNV in tumor sample; (d) for exclusion of germline variants, only variants with AF<0.01 in EXAC, ESP600 and 1000 Genome (1KG) were included; (e) only variants with LOD score >=6.3 for tumor samples were included. Tumor mutation burden (TMB) was calculated based on counts of somatic mutations per Mb of captured region. For neoantigen prediction, HLA typing for tumor samples was performed using HLA-VBSeq 49. Somatic mutations were filtered to keep only those that were considered deleterious in SIFT. Potential HLA class I restricted neoantigens were predicted using pVAC-Seq 50,51. Predicted epitopes with a median IC50 binding score below 500nM for the mutant allele were retained and were log2 transformed for presentation. Statistical significance was calculated using Wilcoxon rank-sum test. P < 0.05 was considered statistically significant. Oncoplot and coOncoplot showing most frequently mutated genes, mutations in the DDR genes, and genes implicated in response to ICT31, respectively, were generated using the R package maftools 52. For DDR, genes we used a gene set comprised of 50 genes out of which 43 were from Nombela et al 53 and 7 additional genes were added to comprehensively cover all DDR genes currently being evaluated in urothelial carcinomas: homologous recombination (CTIP), DNA sensors (MDC1 and ATRX), and other genes implicated in DDR (RECQL4, POLQ, POLE, and WRN).
9. Multiplex immunofluorescence assay and analysis
For multiplex immunofluorescence (IF) staining, we followed the Opal protocol staining method 54 for the following markers: 1. For mIF analysis of ICOS+ CD4 T cells; CD4 (CM153BK, Biocare, 1:25) with subsequent visualization using fluorescein Cy3 (1:50); ICOS (Spring Bioscience, M3980, 1:50) with subsequent visualization using fluorescein Cy5; and nuclei were visualized with DAPI (1:2000). 2. For TLS mIF; CD4 (Abcam, AB133616), CD8 (Thermo, MS-457S), FOXP3 (Cell signaling, CST126535), CD20 (Dako, M075529-2), and CD21 (Leica, NCL-L-CD21-2G9) with subsequent visualization using Akoya Opal fluorophores (690, 570, 480, 620, and 520 respectively); and nuclei visualized were with DAPI (1:2000). All of the sections were cover-slipped using Vectashield Hardset895 mounting media. The slides were scanned using the Vectra/Polaris slide scanner (PerkinElmer). For multispectral analysis, each of the individually stained sections was used to establish the spectral library of the fluorophores using Inform (Akoya). Images were acquired at 20X magnification and unmixed using the acquired spectral libraries using the Inform software (Akoya). A pathologist analyzed five random areas on each sample blindly at 20X magnification. For quantification of ICOS+ CD4 T cells paired pre- and post-treatment tumor tissue samples from 4 non-responder and 7 responder patients were quantified using the HALO software (Indica Lab). The colocalization algorithm was used to determine the percentage of ICOS+ CD4 T cells. The data was plotted using Prism 8.0 (GraphPad Software Inc.). Statistical significance was calculated using Wilcoxon rank-sum test. P <0.05 was considered statistically significant.
10. TLS survival analysis
For survival analysis, all enrolled patients on this trial (n=28) were included for the OS analysis. However, two patients did not have enough baseline tissue to perform TLS analysis, hence the number at risk is 26 in the OS/TLS correlation. For relapse-free survival (RFS), all patients who underwent cystectomy (n=24) were included in the analysis. However, 1 patient did not have enough baseline tissue to perform TLS analysis, hence the number at risk is 23 in the OS/RFS correlation. TLS density at baseline was dichotomized into two groups: TLShigh group with TLS density higher than the median (0.155 TLS/mm2) and TLSlow group with all the remaining samples that had TLS density lower than the median. Kaplan–Meier method was used for plotting the survival curves and log-rank test was used for statistical comparison of the survival curves. R package survival (https://cran.r-project.org/web/packages/survival/index.html) was used for the analysis.
11. Data availability
The data generated or analyzed during this study are included in this published article (and its supplementary information files). All whole exome sequencing and gene expression, NanoString data that support the findings of this study (pertaining to Figures 2a–c, Extended Data Figure 4, Extended Data Figure 5 and Extended Data Figure 8) are deposited into European Genome-phenome Archive (EGA) and are accessible through the accession number EGAS00001004074. The links to databases used for analysis of the data presented in this study: COSMIC, EXAC, ESP600, 1000 Genome, UCSC genome browser are listed in the key resource table (Supplementary Table 6). All other relevant data related to the current study are available from the corresponding author (Padmanee Sharma) on reasonable request that does not include confidential patient information.
12. Code availability
No custom codes were used in analysis reported in this study. All relevant references are provided in the methods section
Extended Data
Extended Data Fig 1: Trial schema (NCT02812420).
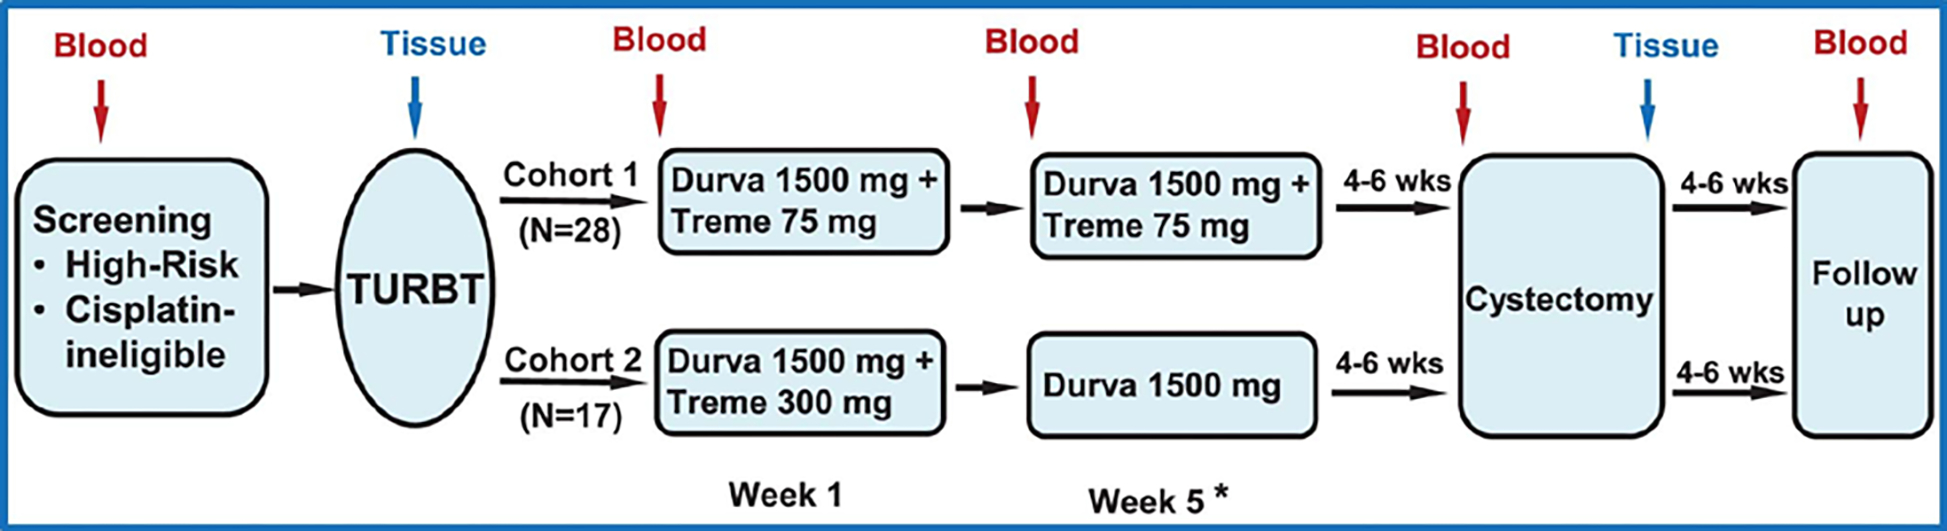
Patients each had baseline TURBT for tumor resection, pathologic diagnosis, staging, and risk stratification. The first cohort of 28 patients each received durvalumab at 1500 mg plus tremelimumab 75 mg every 4 weeks for a total of 2 doses. The second cohort of 17 patients was planned to receive durvalumab at 1500 mg plus tremelimumab 300 mg × 1 dose and then only durvalumab at 1500 mg 4 weeks later (not reported in this manuscript). Surgery (radical cystectomy or applicable surgery to resect tumors) was performed 4–6 weeks after the last dose of treatment. A cystoscopy (or applicable imaging) with optional TURBT was performed at week 4 (post-treatment dose 1) to rule out patients with rapid disease progression. In the case of rapid disease progression, these patients were taken off the trial per clinical judgement from the treating physicians and the principal investigators. Pre- and post-treatment blood and tumor tissues were collected for correlative studies. TURBT-transurethral resection of bladder tumor. * A cystoscopy and optional TURBT prior to second dose.
Extended Data Fig. 2: Response rate in association with adverse events or variant histology.
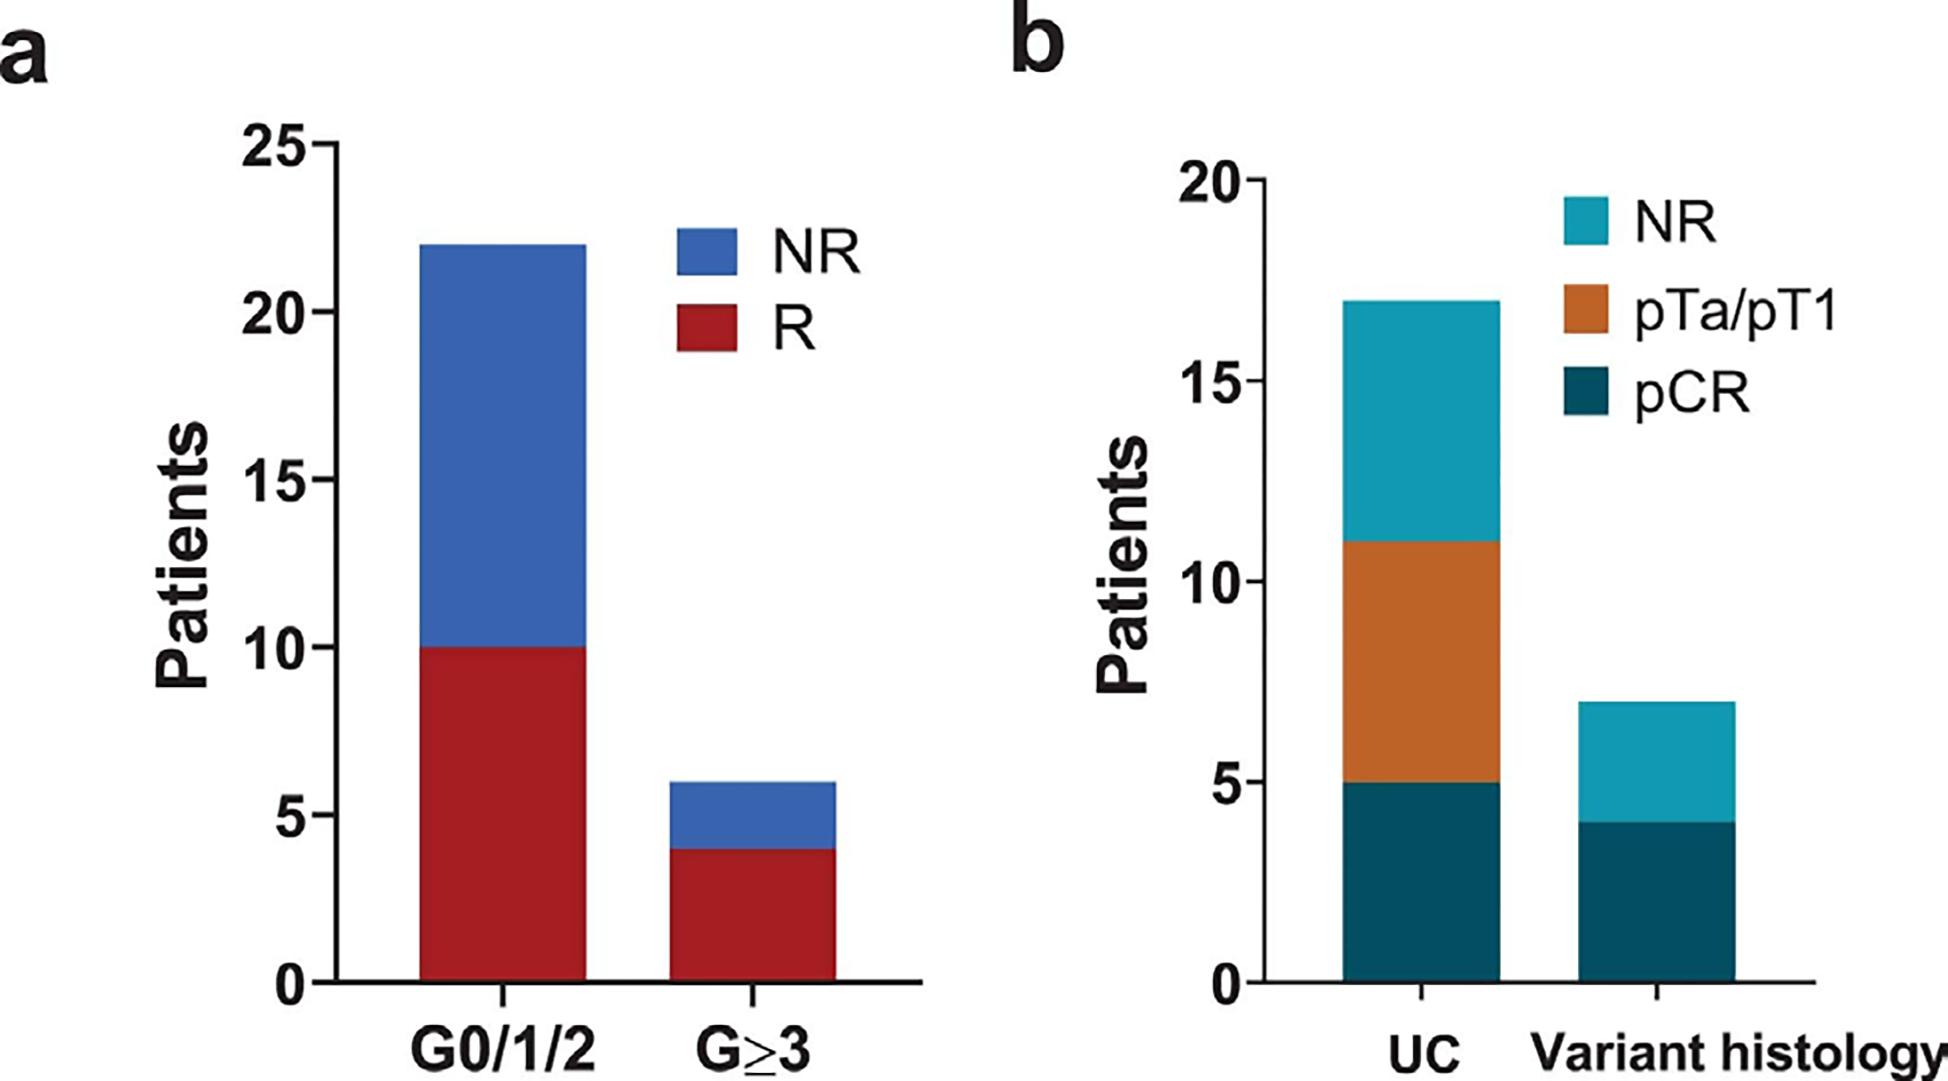
a. Pathologic response based on grade of immune-related adverse events.
b. Pathologic response in pure urothelial carcinoma vs. urothelial carcinoma with variant histology.
Extended Data Fig. 3: Distribution of PD-L1 expression in the immune and tumor cell compartments in pre-treatment tumor tissues of responders compared to non-responders.
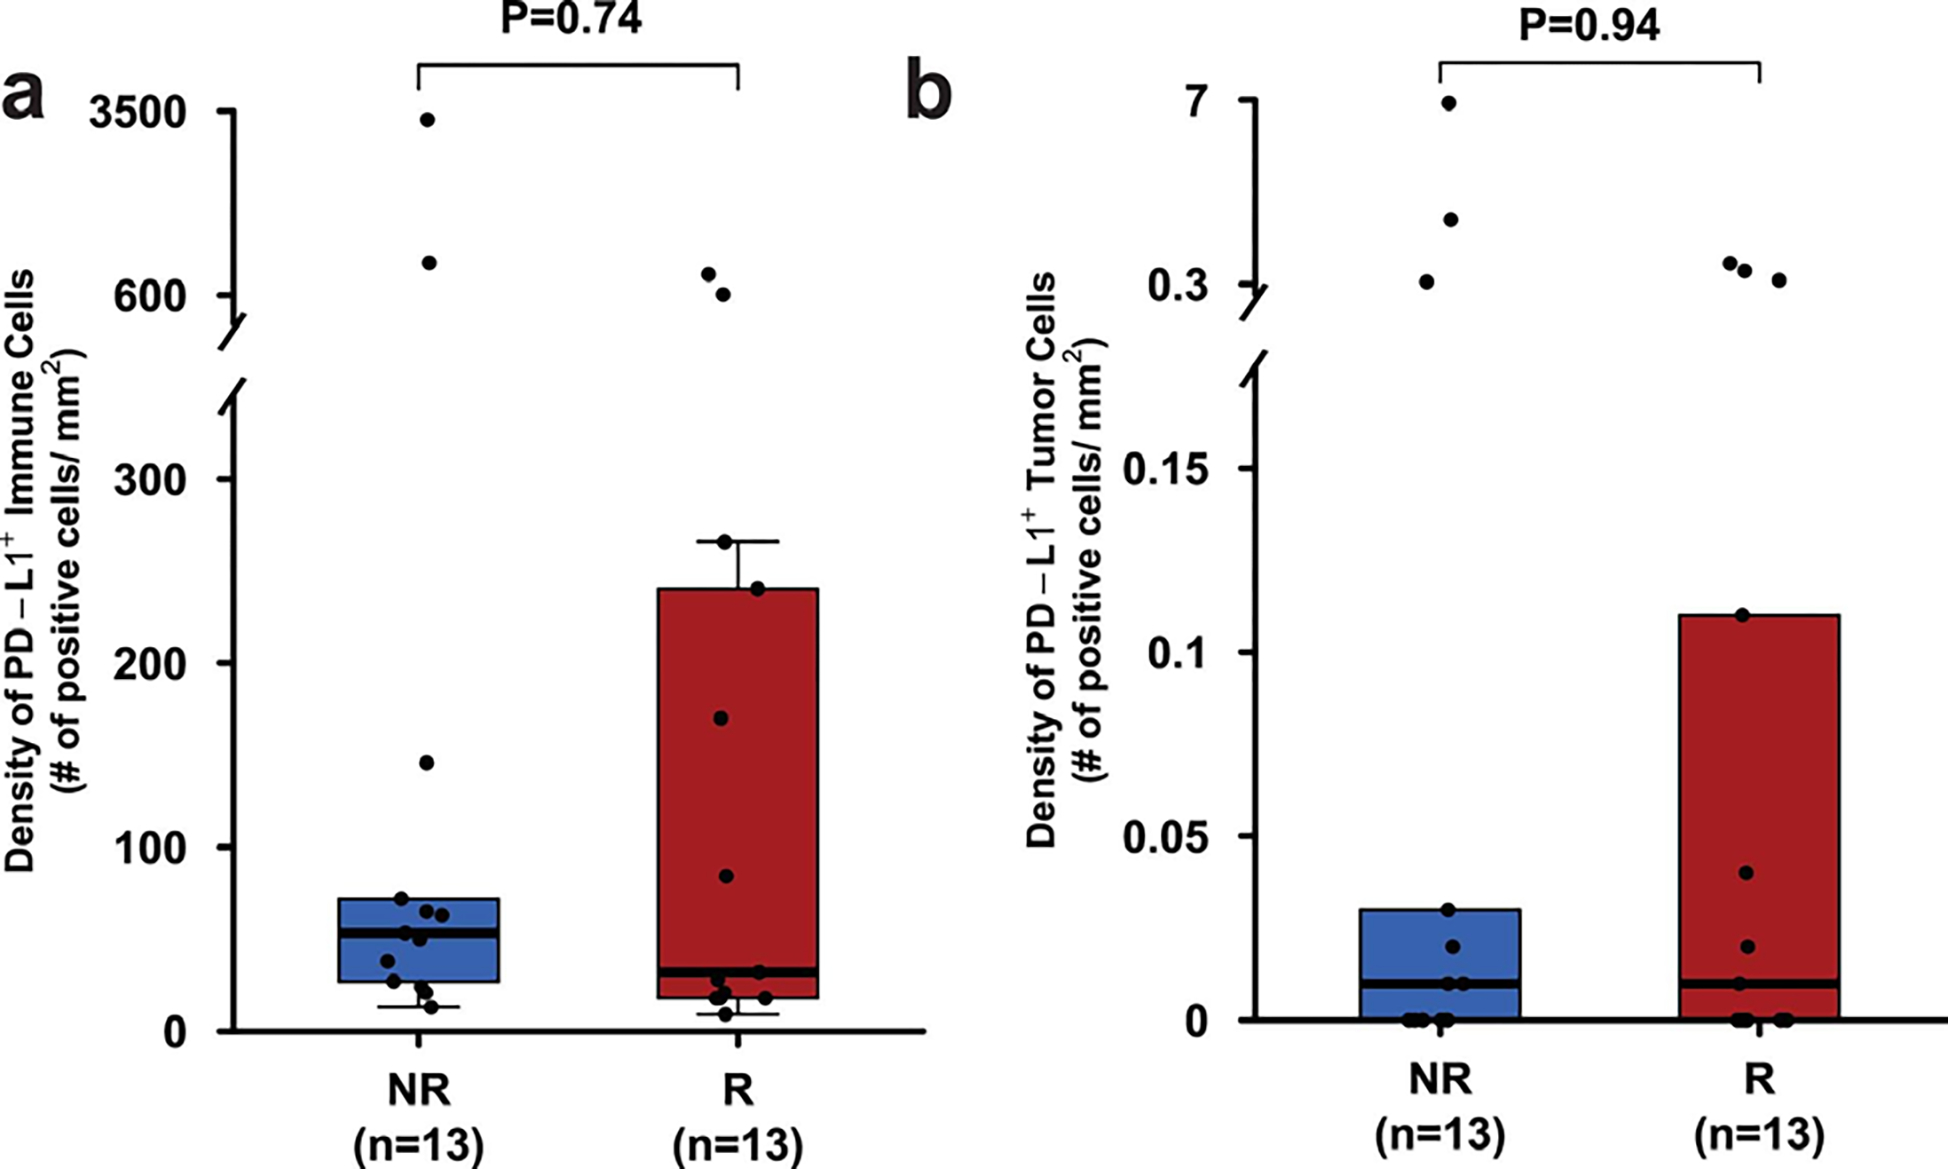
a. Box plot showing density of immune cells expressing PD-L1 in pre-treatment tumor tissue samples from responders (R, n = 13, red) and non-responders (NR, n = 13, blue).
b. Box plot showing density of tumor cells expressing PD-L1 in pre-treatment tumor tissue samples from responders (R, n = 13, red) and non-responders (NR, n = 13, blue). In the box plots of a and b, the horizontal bold line represents the median. The lower and upper hinges of the box correspond to the first and third quartiles (the 25th and 75th percentiles); the upper whisker extends from the hinge to the largest value no further than 1.5 × IQR from the hinge (where IQR is the distance between the first and third quartiles); and the lower whisker extends from the hinge to the smallest value at most 1.5 × IQR from the hinge. Statistical analysis was performed using two-sided Wilcoxon rank-sum test. P < 0.05 is considered statistically significant.
Extended Data Fig. 4: Predicted neoantigen load in pre-treatment tumor tissue samples.
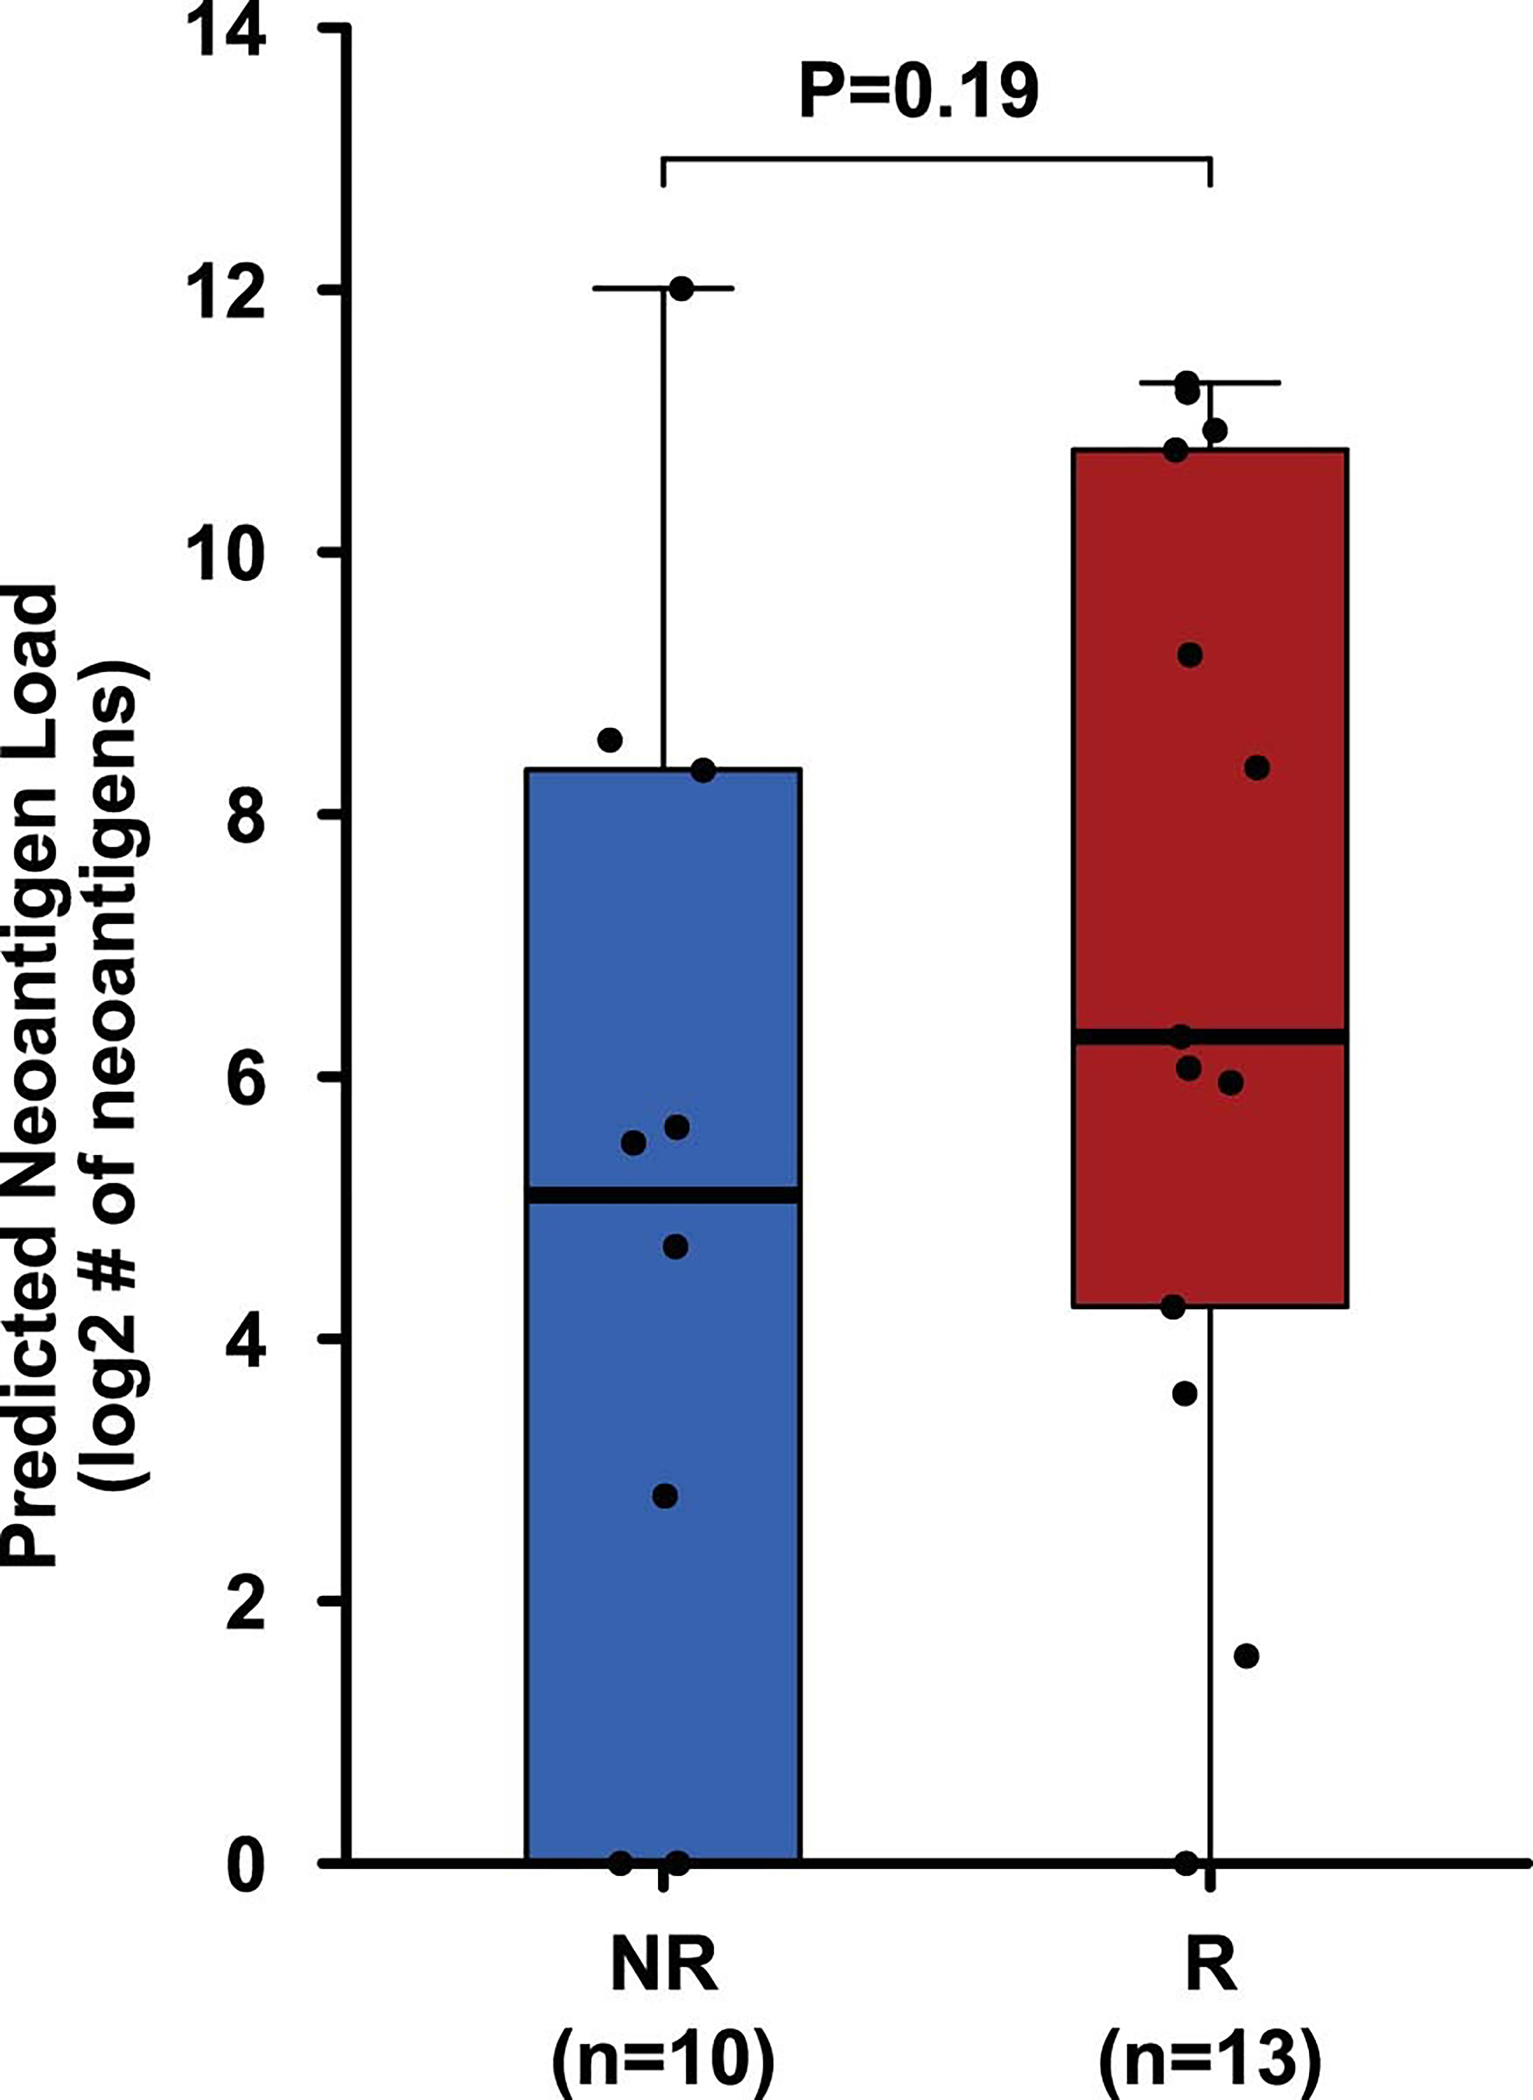
Box plot showing neoantigen load did not differ significantly between the R (n = 13, red) and NR (n = 10, blue) patients. The horizontal bold line represents the median. The lower and upper hinges of the box correspond to the first and third quartiles (the 25th and 75th percentiles); the upper whisker extends from the hinge to the largest value no further than 1.5 × IQR from the hinge (where IQR is the distance between the first and third quartiles); and the lower whisker extends from the hinge to the smallest value at most 1.5 × IQR from the hinge. The P value was calculated using two-sided Wilcoxon rank sum test. P < 0.05 is considered statistically significant.
Extended Data Fig. 5: Mutational analysis of specific genes in pre-treatment tumor tissue samples in correlation with response.
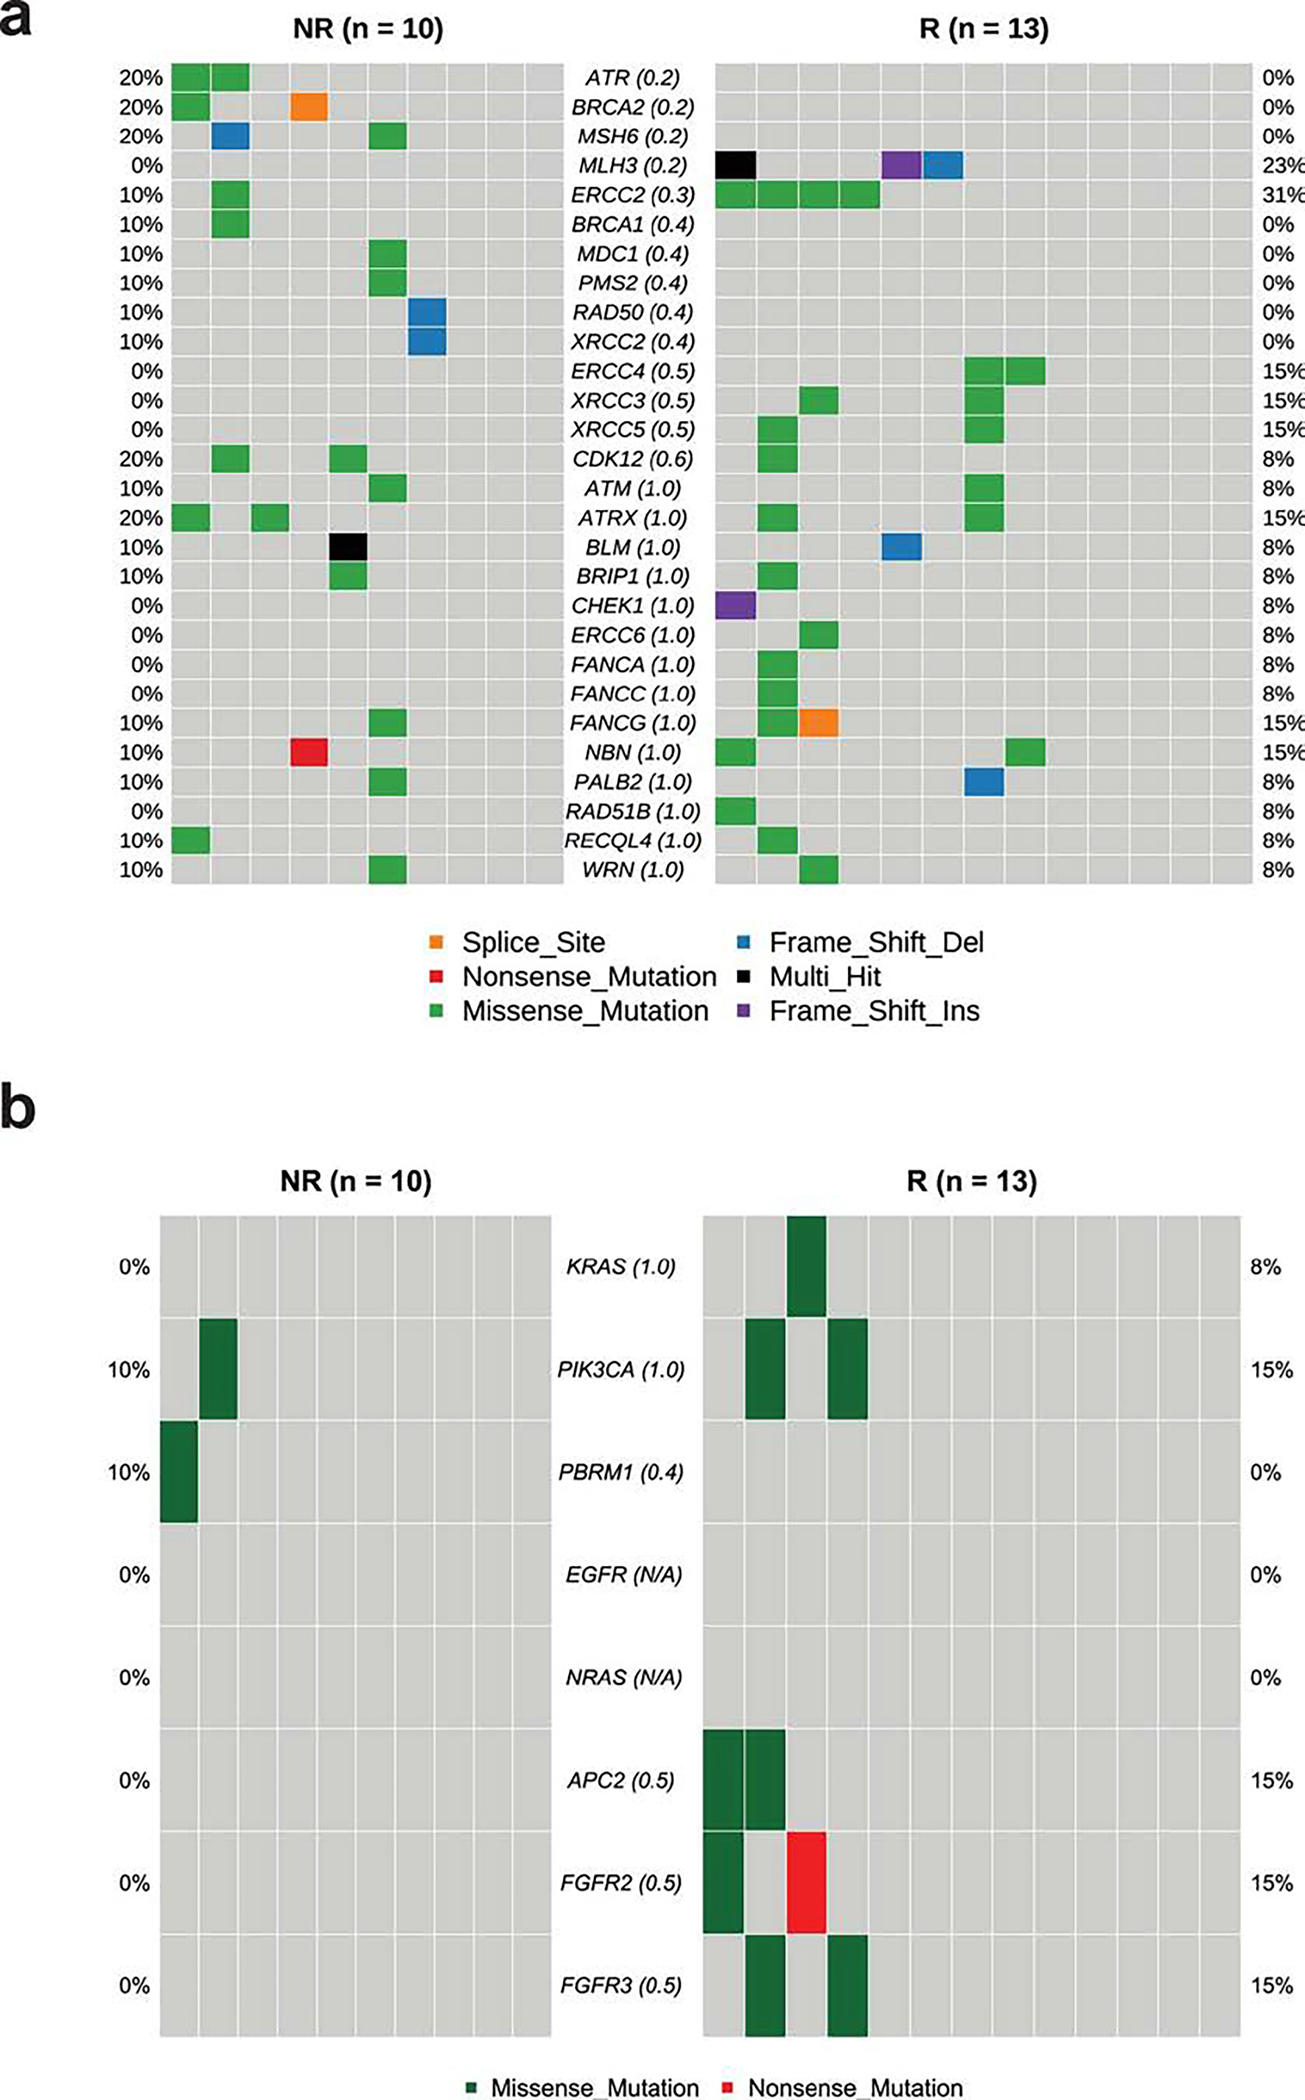
a. CoOncoplot showing mutations in DNA-damage response (DDR) genes in responders (R, n = 13, right) and non-responders (NR, n = 10, left).
b. CoOncoplot showing mutations in KRAS, PIK3CA, PBRM1, EGFR, NRAS, APC2 and FGFR genes in responders (R, n = 13, right) and non-responders (NR, n = 10, left). Each row represents a gene and the gene name is listed in the middle of the two heatmaps and their respective frequencies are listed on the left of the first heatmap (NR) and on the right of the second heatmap (R). Each column represents a patient. Each row represents a gene and the gene name is listed in the middle of the two heatmaps and their respective frequencies are listed on the left of the first heatmap (NR) and on the right of the second heatmap (R). The p-values comparing the distribution of mutations between R and NR are shown within parentheses next to each gene name. N/A denotes not applicable. The colors of rectangles in the body of the heatmap indicates different types of somatic mutations and the key identifying each mutation type is shown at the bottom. P values calculated using two-sided Fisher’s exact test.
Extended Data Fig. 6: Biological responses in peripheral blood and tumor tissue samples after treatment with durvalumab plus tremelimumab.
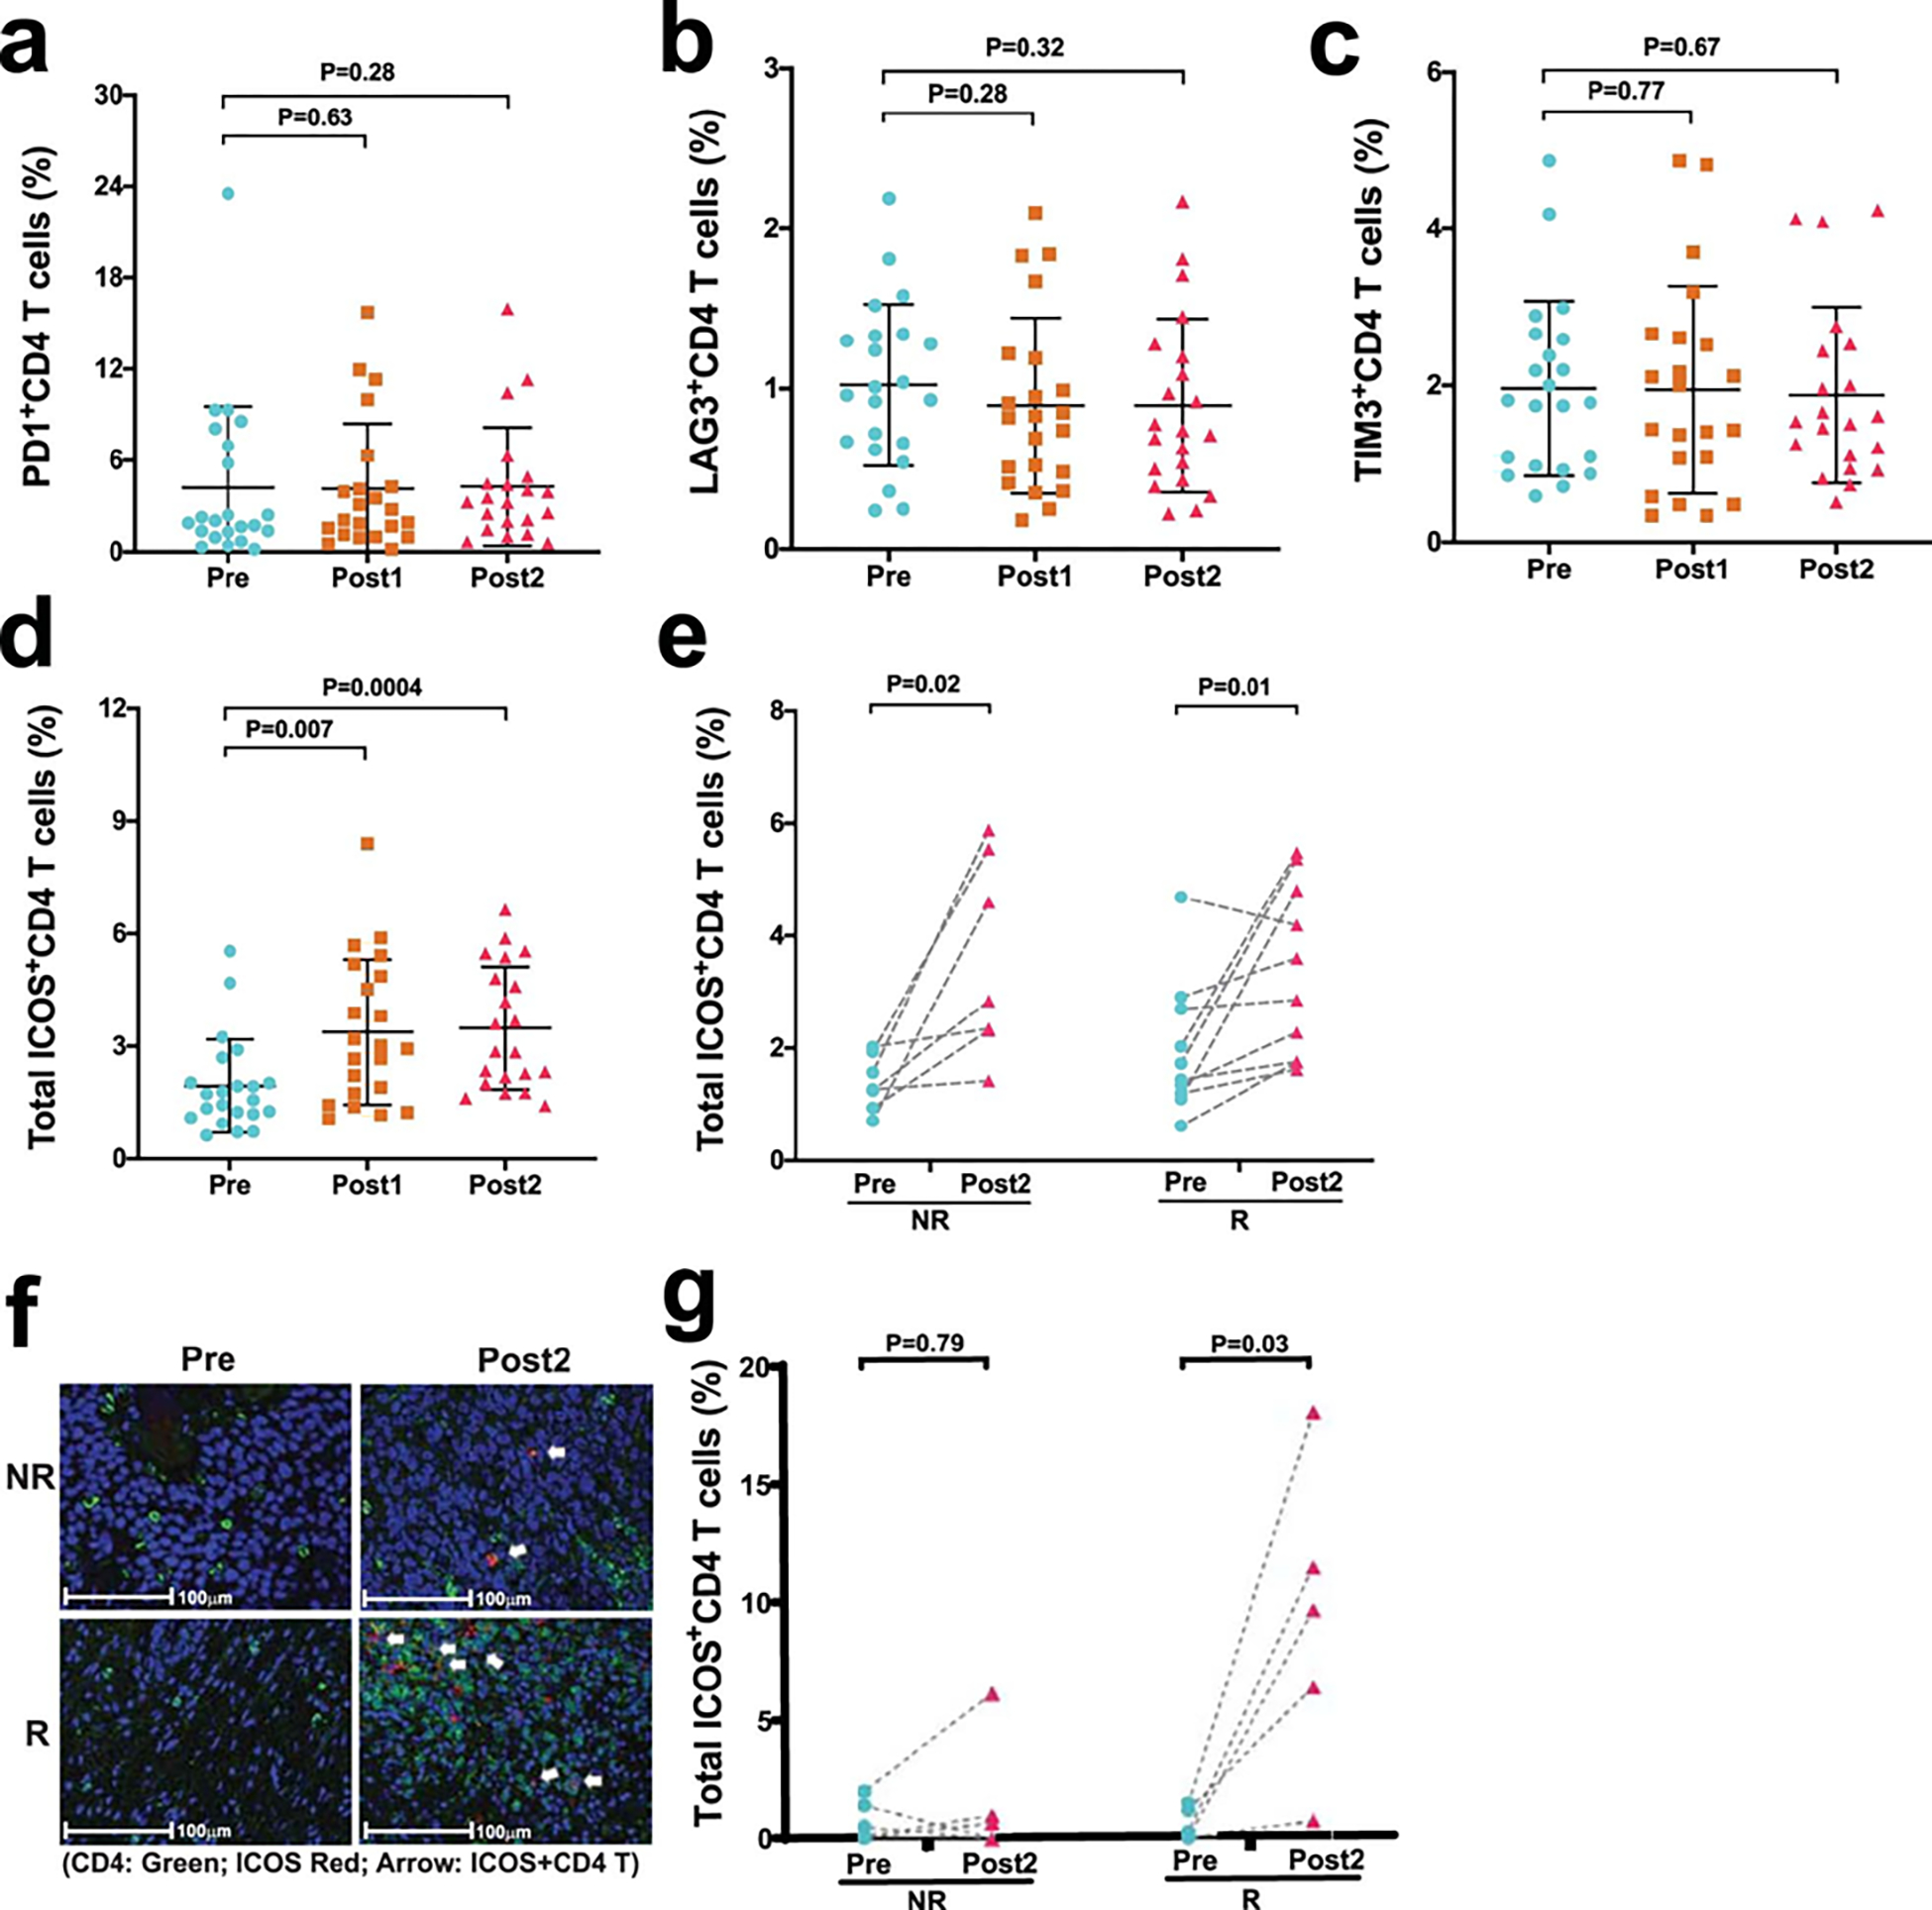
a–e. Immune profiling by CyTOF analysis was performed on peripheral blood samples collected pre- and post-treatment. a-c, Categorical scatter plots showing frequency of subsets of CD4 T cells expressing PD-1, LAG3, and TIM3 pre- and post-treatment. Pre- indicates pre-treatment (blue circles; n = 22); Post1 indicates post-treatment, dose 1 (brown squares; n = 22); Post2 indicates post-treatment, dose 2 (pink triangles; n = 21). d, Categorical scatter plot showing frequency of ICOS + CD4 T cells pre- and post-treatment. Sample numbers and color schema same as in a-c. For a-d, error bars are shown as mean±standard deviation. e, Paired dot plots showing frequency of ICOS+ CD4 T cells in matched pre- and post-treatment (Post2) blood samples. NR indicates non-responders (n = 7); R indicates responders (n = 10). P values were calculated using the two-sided Wilcoxon rank-sum test in a-d and Wilcoxon signed-rank test in e. f, Representative multiplex immunofluorescence images (magnification; 20X) from one non-responder, NR (top) and one responder, R (bottom) patient at pre-treatment, Pre (left) and post-treatment, Post2 (right) time points. The samples were stained for the following markers: ICOS (red) and CD4 (green). Nuclei were stained with DAPI (blue). White arrows point to CD4 T cells expressing ICOS. Matched pre- and post-treatment samples from 10 patients (R = 5 and NR = 5) had similar analyses completed with corresponding images that were used to generate the data in g. g, Paired dot plots showing percentage of ICOS+CD4 T cells in matched pre- (blue circles) and post- (pink triangles) treatment tumor tissue samples from non-responders, NR (n = 5) and responders, R (n = 5). P values were calculated using the two-sided Wilcoxon rank-sum test. P < 0.05 is considered statistically significant.
Extended Data Fig. 7: Distribution of B cells, CD4 T cells, and CD8 T cells in pre-treatment tumor tissues of responders compared to non-responders.
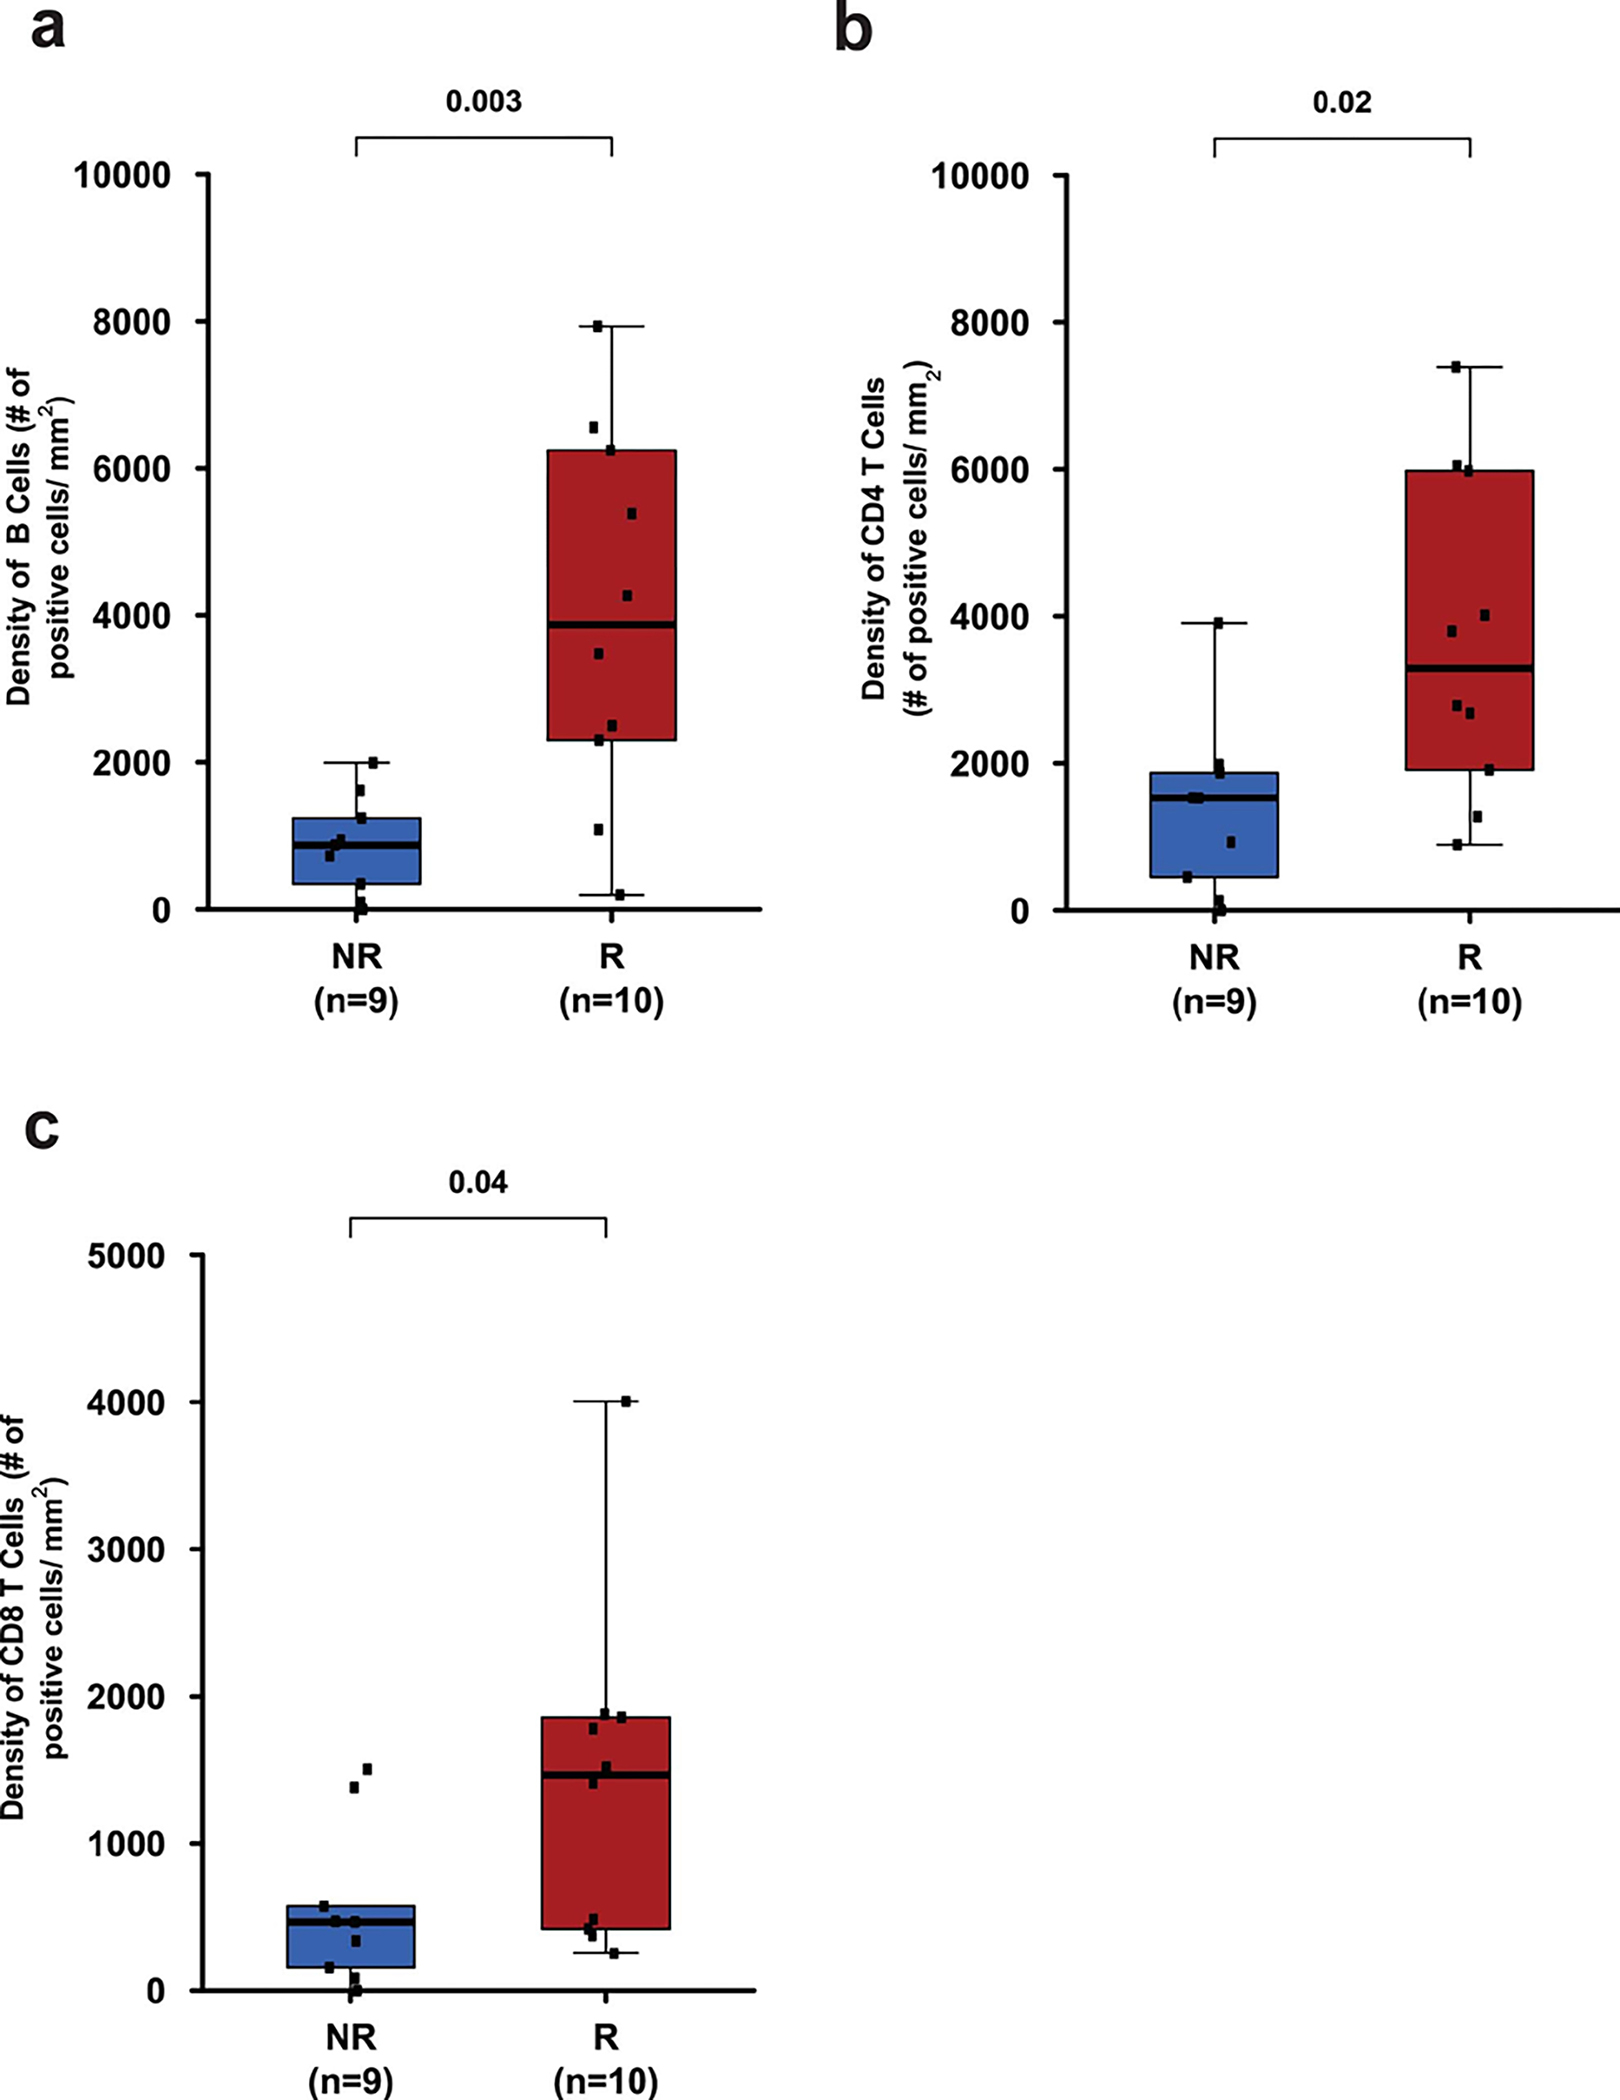
a. Box plot showing density of B cells (CD20+) in pre-treatment tumor tissue samples from responders (R, n = 10) and non-responders (NR, n = 9).
b. Box plot showing density of CD4 T cells in pre-treatment tumor tissue samples from responders (R, n = 10) and non-responders (NR, n = 9).
c. Box plot showing density of CD8 T cells in pre-treatment tumor tissue samples from responders (R, n = 10) and non-responders (NR, n = 9). In the box plots, the horizontal bold line represents the median. The lower and upper hinges of the box correspond to the first and third quartiles (the 25th and 75th percentiles); the upper whisker extends from the hinge to the largest value no further than 1.5 × IQR from the hinge (where IQR is the distance between the first and third quartiles); and the lower whisker extends from the hinge to the smallest value at most 1.5 × IQR from the hinge. Statistical analysis was performed using two-sided Wilcoxon rank-sum test. P < 0.05 is considered statistically significant.
Extended Data Fig. 8: Association of POU2AF1 gene and TLS signature with response.
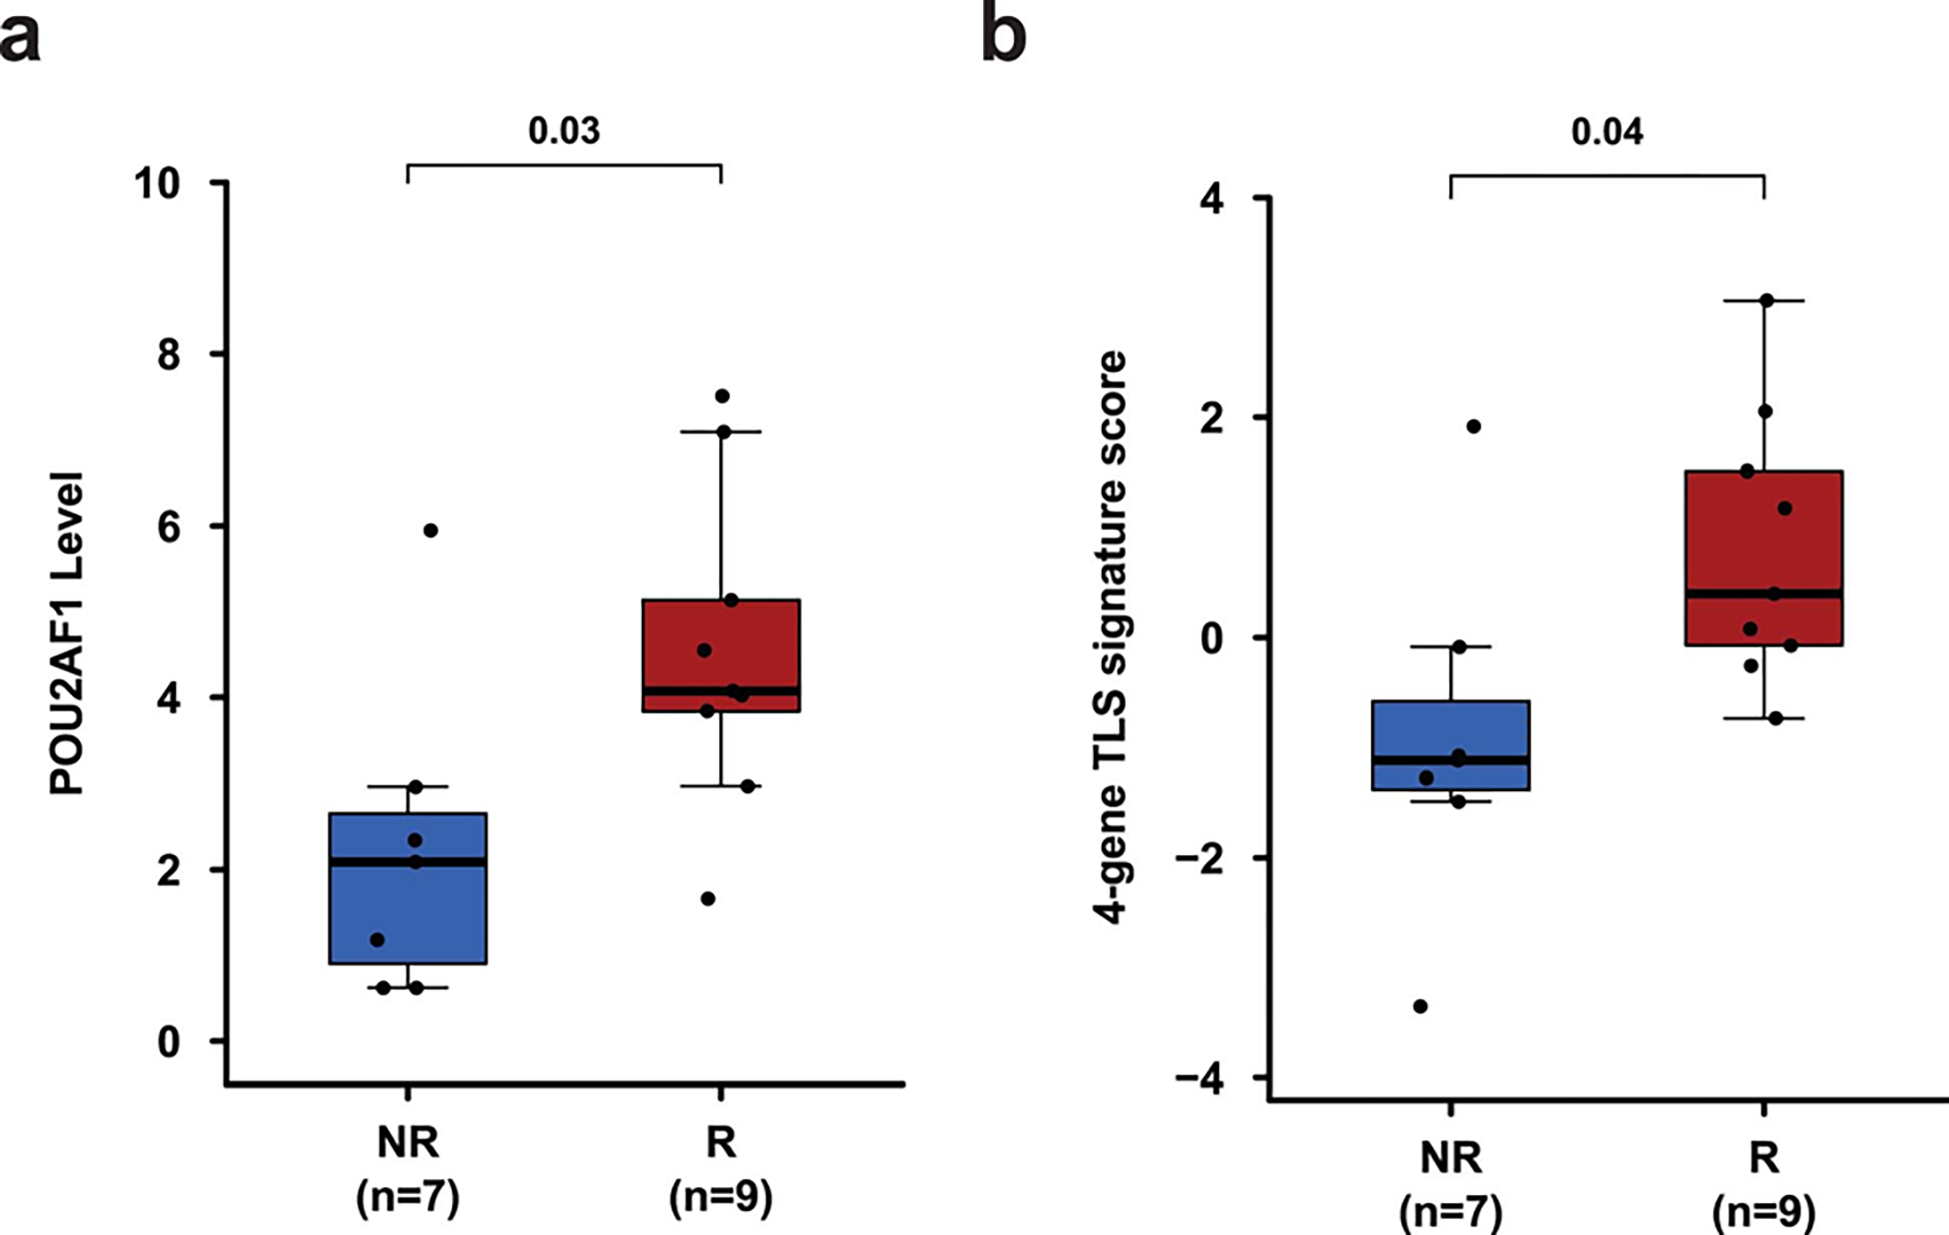
Pre-treatment tumor tissue samples from patients with TLS were analyzed by Nanostring. a, Box plot showing a comparison of POU2AF1 gene expression level between R (n = 9, red) and NR (n = 7, blue) patients. b, Box plot showing a comparison of 4-gene TLS signature derived from gene expression profiling of pre-treatment tumor tissue samples from R (n = 9, red) and NR (n = 7, blue) patients. In the box plots, the horizontal bold line represents the median. The lower and upper hinges of the box correspond to the first and third quartiles (the 25th and 75th percentiles); the upper whisker extends from the hinge to the largest value no further than 1.5 × IQR from the hinge (where IQR is the distance between the first and third quartiles); and the lower whisker extends from the hinge to the smallest value at most 1.5 × IQR from the hinge. P values were calculated using the two-sided unpaired student’s t–test, P < 0.05 is considered statistically significant.
Supplementary Material
ACKNOWLEDGEMENT
This research is supported in part through an alliance between AstraZeneca/MedImmune and the MD Anderson Cancer Center Immunotherapy Platform, the MD Anderson Physician Scientist Award (J.G.), Khalifa Physician Scientist Award (J.G.), Andrew Sabin Family Foundation Fellows Award (J.G.), and Wendy and Leslie Irvin Barnhart Fund (J.G.). We would like to thank the genomic medicine, CGL core team for WES. In addition, we would like to thank Ashura Khan (Program Director), and the Immunotherapy Platform team for technical support. Drs. Sharma and Allison are members of the Parker Institute for Cancer Immunotherapy, which supports their research work at MD Anderson Cancer Center Cancer.
Footnotes
CONFLICT OF INTEREST
Dr. Sharma and Dr. Allison do not have any competing interest with this manuscript. However, they provided a list of all disclosures for transparency. Padmanee Sharma has ownership in Jounce, BioNTx, Constellation, Oncolytics, BioAtla, Forty-Seven, Apricity, Polaris, Marker Therapeutics, Codiak, ImaginAb, Dragonfly, Lytix, Lava Therapeutics, Infinity Pharma, Adaptive Biotechnologies and Hummingbird. James P. Allison has ownership in Jounce, BioNTx, BioAtla, Forty-Seven, Apricity, Polaris, Marker Therapeutics, Adaptive Biotechnologies, and Codiak. Padmanee Sharma serves as a consultant for Constellation, Jounce, Kite Pharma, Neon, BioAtla, Oncolytics Biotech, Forty-Seven, Polaris, Apricity, Marker Therapeutics, Codiak, ImaginAb, Dragonfly, Lava Therapeutics, Infinity Pharma, Lytix and Hummingbird. James P. Allison serves as a consultant for Jounce, Neon, Forty-Seven, Apricity, Polaris, Marker Therapeutics, Codiak, ImaginAb, Lava Therapeutics, Dragonfly, Lytix, and Hummingbird.
Dr. Gao’s competing interest is listed below and here is a list of all his disclosures for transparency. Jianjun Gao serves as a consultant for ARMO Biosciences, CRISPR Therapeutics, Jounce, Nektar, Pfizer, Polaris, and Symphogen.
COMPETING INTEREST STATEMENTS
Jianjun Gao served as a consultant on a scientific advisory board for AstraZeneca and received compensation as an advisor. Ashish M. Kamat served on a scientific advisory board for AstraZeneca and received compensation as an advisor. Arlene Siefker-Radtke is on a scientific advisory board for AstraZeneca and receives compensation as an advisor. Jorge Blando became an AstraZeneca employee after the work on this manuscript was completed.
References:
- 1.Necchi A, et al. Pembrolizumab as Neoadjuvant Therapy Before Radical Cystectomy in Patients With Muscle-Invasive Urothelial Bladder Carcinoma (PURE-01): An Open-Label, Single-Arm, Phase II Study . Journal of Clinical Oncology 36, 3353–3360 (2018). [DOI] [PubMed] [Google Scholar]
- 2.Powles T, et al. Clinical efficacy and biomarker analysis of neoadjuvant atezolizumab in operable urothelial carcinoma in the ABACUS trial. Nature Medicine 25, 1706–1714 (2019). [DOI] [PubMed] [Google Scholar]
- 3.Culp SH, et al. Refining patient selection for neoadjuvant chemotherapy before radical cystectomy. The Journal of urology 191, 40–47 (2014). [DOI] [PMC free article] [PubMed] [Google Scholar]
- 4.Siefker-Radtke AO, et al. A phase 2 clinical trial of sequential neoadjuvant chemotherapy with ifosfamide, doxorubicin, and gemcitabine followed by cisplatin, gemcitabine, and ifosfamide in locally advanced urothelial cancer: final results. Cancer 119, 540–547 (2013). [DOI] [PMC free article] [PubMed] [Google Scholar]
- 5.Moschini M, et al. Validation of Preoperative Risk Grouping of the Selection of Patients Most Likely to Benefit From Neoadjuvant Chemotherapy Before Radical Cystectomy. Clinical genitourinary cancer 15, e267–e273 (2017). [DOI] [PubMed] [Google Scholar]
- 6.Plimack ER, et al. Accelerated methotrexate, vinblastine, doxorubicin, and cisplatin is safe, effective, and efficient neoadjuvant treatment for muscle-invasive bladder cancer: results of a multicenter phase II study with molecular correlates of response and toxicity. Journal of clinical oncology : official journal of the American Society of Clinical Oncology 32, 1895–1901 (2014). [DOI] [PMC free article] [PubMed] [Google Scholar]
- 7.Griffiths G, Hall R, Sylvester R, Raghavan D & Parmar MK International phase III trial assessing neoadjuvant cisplatin, methotrexate, and vinblastine chemotherapy for muscle-invasive bladder cancer: long-term results of the BA06 30894 trial. Journal of clinical oncology : official journal of the American Society of Clinical Oncology 29, 2171–2177 (2011). [DOI] [PMC free article] [PubMed] [Google Scholar]
- 8.Iyer G, et al. Multicenter Prospective Phase II Trial of Neoadjuvant Dose-Dense Gemcitabine Plus Cisplatin in Patients With Muscle-Invasive Bladder Cancer. Journal of Clinical Oncology 36, 1949–1956 (2018). [DOI] [PMC free article] [PubMed] [Google Scholar]
- 9.Grossman HB, et al. Neoadjuvant chemotherapy plus cystectomy compared with cystectomy alone for locally advanced bladder cancer. N Engl J Med 349, 859–866 (2003). [DOI] [PubMed] [Google Scholar]
- 10.Sonpavde G, et al. Quality of pathologic response and surgery correlate with survival for patients with completely resected bladder cancer after neoadjuvant chemotherapy. Cancer 115, 4104–4109 (2009). [DOI] [PMC free article] [PubMed] [Google Scholar]
- 11.Rosenblatt R, et al. Pathologic downstaging is a surrogate marker for efficacy and increased survival following neoadjuvant chemotherapy and radical cystectomy for muscle-invasive urothelial bladder cancer. European urology 61, 1229–1238 (2012). [DOI] [PubMed] [Google Scholar]
- 12.Galsky MD, et al. Treatment of patients with metastatic urothelial cancer “unfit” for Cisplatin-based chemotherapy. Journal of clinical oncology : official journal of the American Society of Clinical Oncology 29, 2432–2438 (2011). [DOI] [PubMed] [Google Scholar]
- 13.Network NCC Clinical Practice Guidelines in Oncology: Bladder Cancer. Vol. 2019 NCCN Clinical Practice Guidelines in Oncology: Bladder Cancer, 2019 (2019). [Google Scholar]
- 14.Bellmunt J, et al. Bladder cancer: ESMO Practice Guidelines for diagnosis, treatment and follow-up†. Annals of Oncology 25, iii40–iii48 (2014). [DOI] [PubMed] [Google Scholar]
- 15.Witjes JA Chair, M.B., Cathomas R, Compérat E, Cowan NC, Gakis G, Hernández V, Lorch A, Ribal MJ Vice-chair, Thalmann GN, van der Heijden AG, Veskimäe E & Guidelines Associates: Linares Espinós E, M.R., Neuzillet Y EAU Guidelines. Edn. presented at the EAU Annual Congress Barcelona 2019. (EAU Guidelines Office, Arnhem, The Netherlands., 2019). [Google Scholar]
- 16.Sharma P, et al. Nivolumab monotherapy in recurrent metastatic urothelial carcinoma (CheckMate 032): a multicentre, open-label, two-stage, multi-arm, phase 1/2 trial. The Lancet. Oncology 17, 1590–1598 (2016). [DOI] [PMC free article] [PubMed] [Google Scholar]
- 17.Powles T, et al. Efficacy and Safety of Durvalumab in Locally Advanced or Metastatic Urothelial Carcinoma: Updated Results From a Phase 1/2 Open-label Study. JAMA oncology 3, e172411 (2017). [DOI] [PMC free article] [PubMed] [Google Scholar]
- 18.Powles T, et al. Atezolizumab versus chemotherapy in patients with platinum-treated locally advanced or metastatic urothelial carcinoma (IMvigor211): a multicentre, open-label, phase 3 randomised controlled trial. Lancet 391, 748–757 (2018). [DOI] [PubMed] [Google Scholar]
- 19.Bellmunt J, et al. Pembrolizumab as Second-Line Therapy for Advanced Urothelial Carcinoma. N Engl J Med 376, 1015–1026 (2017). [DOI] [PMC free article] [PubMed] [Google Scholar]
- 20.Patel MR, et al. Avelumab in metastatic urothelial carcinoma after platinum failure (JAVELIN Solid Tumor): pooled results from two expansion cohorts of an open-label, phase 1 trial. The Lancet. Oncology 19, 51–64 (2018). [DOI] [PMC free article] [PubMed] [Google Scholar]
- 21.Balar AV, et al. First-line pembrolizumab in cisplatin-ineligible patients with locally advanced and unresectable or metastatic urothelial cancer (KEYNOTE-052): a multicentre, single-arm, phase 2 study. The Lancet Oncology 18, 1483–1492 (2017). [DOI] [PubMed] [Google Scholar]
- 22.Balar AV, et al. Atezolizumab as first-line treatment in cisplatin-ineligible patients with locally advanced and metastatic urothelial carcinoma: a single-arm, multicentre, phase 2 trial. The Lancet 389, 67–76 (2017). [DOI] [PMC free article] [PubMed] [Google Scholar]
- 23.Millikan R, et al. Integrated therapy for locally advanced bladder cancer: final report of a randomized trial of cystectomy plus adjuvant M-VAC versus cystectomy with both preoperative and postoperative M-VAC. Journal of clinical oncology : official journal of the American Society of Clinical Oncology 19, 4005–4013 (2001). [DOI] [PubMed] [Google Scholar]
- 24.Wolchok JD, et al. Nivolumab plus ipilimumab in advanced melanoma. N Engl J Med 369, 122–133 (2013). [DOI] [PMC free article] [PubMed] [Google Scholar]
- 25.Motzer RJ, et al. Nivolumab plus Ipilimumab versus Sunitinib in Advanced Renal-Cell Carcinoma. N Engl J Med 378, 1277–1290 (2018). [DOI] [PMC free article] [PubMed] [Google Scholar]
- 26.Bamias A, et al. Impact of contemporary patterns of chemotherapy utilization on survival in patients with advanced cancer of the urinary tract: a Retrospective International Study of Invasive/Advanced Cancer of the Urothelium (RISC). Annals of oncology : official journal of the European Society for Medical Oncology 29, 361–369 (2018). [DOI] [PMC free article] [PubMed] [Google Scholar]
- 27.Kim J, et al. The Cancer Genome Atlas Expression Subtypes Stratify Response to Checkpoint Inhibition in Advanced Urothelial Cancer and Identify a Subset of Patients with High Survival Probability. European urology 75, 961–964 (2019). [DOI] [PubMed] [Google Scholar]
- 28.Wei SC, et al. Distinct Cellular Mechanisms Underlie Anti-CTLA-4 and Anti-PD-1 Checkpoint Blockade. Cell 170, 1120–1133 e1117 (2017). [DOI] [PMC free article] [PubMed] [Google Scholar]
- 29.Wei SC, et al. Combination anti–CTLA-4 plus anti–PD-1 checkpoint blockade utilizes cellular mechanisms partially distinct from monotherapies. Proceedings of the National Academy of Sciences 116, 22699–22709 (2019). [DOI] [PMC free article] [PubMed] [Google Scholar]
- 30.Wei SC, et al. Negative Co-stimulation Constrains T Cell Differentiation by Imposing Boundaries on Possible Cell States. Immunity 50, 1084–1098.e1010 (2019). [DOI] [PMC free article] [PubMed] [Google Scholar]
- 31.Miao D, et al. Genomic correlates of response to immune checkpoint blockade in microsatellite-stable solid tumors. Nature genetics 50, 1271–1281 (2018). [DOI] [PMC free article] [PubMed] [Google Scholar]
- 32.Ng Tang D, et al. Increased frequency of ICOS+ CD4 T cells as a pharmacodynamic biomarker for anti-CTLA-4 therapy. Cancer immunology research 1, 229–234 (2013). [DOI] [PMC free article] [PubMed] [Google Scholar]
- 33.Liakou CI, et al. CTLA-4 blockade increases IFNγ-producing CD4+ICOShi cells to shift the ratio of effector to regulatory T cells in cancer patients. Proceedings of the National Academy of Sciences 105, 14987–14992 (2008). [DOI] [PMC free article] [PubMed] [Google Scholar]
- 34.Carthon BC, et al. Preoperative CTLA-4 blockade: tolerability and immune monitoring in the setting of a presurgical clinical trial. Clinical cancer research : an official journal of the American Association for Cancer Research 16, 2861–2871 (2010). [DOI] [PMC free article] [PubMed] [Google Scholar]
- 35.Cabrita R, et al. Tertiary lymphoid structures improve immunotherapy and survival in melanoma. Nature 577, 561–565 (2020). [DOI] [PubMed] [Google Scholar]
- 36.Helmink BA, et al. B cells and tertiary lymphoid structures promote immunotherapy response. Nature 577, 549–555 (2020). [DOI] [PMC free article] [PubMed] [Google Scholar]
- 37.Petitprez F, et al. B cells are associated with survival and immunotherapy response in sarcoma. Nature 577, 556–560 (2020). [DOI] [PubMed] [Google Scholar]
- 38.Amaria RN, et al. Neoadjuvant immune checkpoint blockade in high-risk resectable melanoma. Nature Medicine 24, 1649–1654 (2018). [DOI] [PMC free article] [PubMed] [Google Scholar]
- 39.Forde PM, et al. Neoadjuvant PD-1 Blockade in Resectable Lung Cancer. N Engl J Med 378, 1976–1986 (2018). [DOI] [PMC free article] [PubMed] [Google Scholar]
- 40.Van der Heijden MS, et al. Pre-operative ipilimumab and nivolumab in locoregionally advanced, stage III, urothelial cancer (NABUCCO). Annals of Oncology 30, v358 (2019). [Google Scholar]
Methods-only references:
- 41.Thall PF, Simon RM & Estey EH Bayesian sequential monitoring designs for single-arm clinical trials with multiple outcomes. Statistics in medicine 14, 357–379 (1995). [DOI] [PubMed] [Google Scholar]
- 42.Nowicka M, et al. CyTOF workflow: differential discovery in high-throughput high-dimensional cytometry datasets. F1000Res 6, 748 (2017). [DOI] [PMC free article] [PubMed] [Google Scholar]
- 43.Lee E, Chuang H-Y, Kim J-W, Ideker T & Lee D Inferring Pathway Activity toward Precise Disease Classification. PLOS Computational Biology 4, e1000217 (2008). [DOI] [PMC free article] [PubMed] [Google Scholar]
- 44.Herbst RS, et al. Predictive correlates of response to the anti-PD-L1 antibody MPDL3280A in cancer patients. Nature 515, 563 (2014). [DOI] [PMC free article] [PubMed] [Google Scholar]
- 45.Li H & Durbin R Fast and accurate short read alignment with Burrows-Wheeler transform. Bioinformatics (Oxford, England) 25, 1754–1760 (2009). [DOI] [PMC free article] [PubMed] [Google Scholar]
- 46.Cibulskis K, et al. Sensitive detection of somatic point mutations in impure and heterogeneous cancer samples. Nat Biotechnol 31, 213–219 (2013). [DOI] [PMC free article] [PubMed] [Google Scholar]
- 47.Ye K, Schulz MH, Long Q, Apweiler R & Ning Z Pindel: a pattern growth approach to detect break points of large deletions and medium sized insertions from paired-end short reads. Bioinformatics (Oxford, England) 25, 2865–2871 (2009). [DOI] [PMC free article] [PubMed] [Google Scholar]
- 48.Wang K, Li M & Hakonarson H ANNOVAR: functional annotation of genetic variants from high-throughput sequencing data. Nucleic acids research 38, e164 (2010). [DOI] [PMC free article] [PubMed] [Google Scholar]
- 49.Wang Y-Y, et al. HLA-VBSeq v2: improved HLA calling accuracy with full-length Japanese class-I panel. Human Genome Variation 6, 29 (2019). [DOI] [PMC free article] [PubMed] [Google Scholar]
- 50.Hundal J, et al. pVAC-Seq: A genome-guided in silico approach to identifying tumor neoantigens. Genome medicine 8, 11 (2016). [DOI] [PMC free article] [PubMed] [Google Scholar]
- 51.Hundal J, et al. Accounting for proximal variants improves neoantigen prediction. Nature genetics 51, 175–179 (2019). [DOI] [PMC free article] [PubMed] [Google Scholar]
- 52.Mayakonda A, Lin DC, Assenov Y, Plass C & Koeffler HP Maftools: efficient and comprehensive analysis of somatic variants in cancer. Genome research 28, 1747–1756 (2018). [DOI] [PMC free article] [PubMed] [Google Scholar]
- 53.Nombela P, et al. BRCA2 and Other DDR Genes in Prostate Cancer. Cancers 11(2019). [DOI] [PMC free article] [PubMed] [Google Scholar]
- 54.Stack EC, Wang C, Roman KA & Hoyt CC Multiplexed immunohistochemistry, imaging, and quantitation: a review, with an assessment of Tyramide signal amplification, multispectral imaging and multiplex analysis. Methods (San Diego, Calif.) 70, 46–58 (2014). [DOI] [PubMed] [Google Scholar]
Associated Data
This section collects any data citations, data availability statements, or supplementary materials included in this article.
Supplementary Materials
Data Availability Statement
The data generated or analyzed during this study are included in this published article (and its supplementary information files). All whole exome sequencing and gene expression, NanoString data that support the findings of this study (pertaining to Figures 2a–c, Extended Data Figure 4, Extended Data Figure 5 and Extended Data Figure 8) are deposited into European Genome-phenome Archive (EGA) and are accessible through the accession number EGAS00001004074. The links to databases used for analysis of the data presented in this study: COSMIC, EXAC, ESP600, 1000 Genome, UCSC genome browser are listed in the key resource table (Supplementary Table 6). All other relevant data related to the current study are available from the corresponding author (Padmanee Sharma) on reasonable request that does not include confidential patient information.