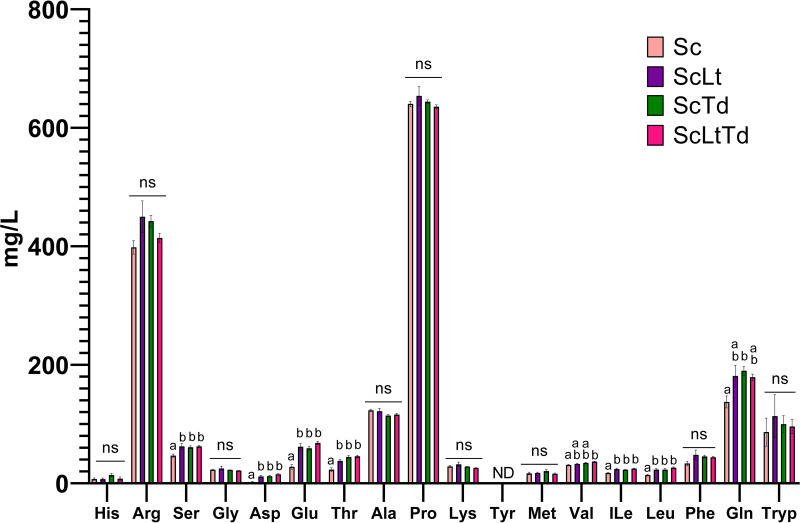
FIG 3.
Measured absolute amino acid concentrations in the supernatants of S. cerevisiae monoculture and mixed-species cultures. Values are represented as the mean from four biological repeats. Statistically significant differences in amino acid concentrations between different cultures are labeled with differing letters and were calculated by ANOVA followed by Tukey’s multiple-comparison test. Sc, Saccharomyces cerevisiae; Lt, Lachancea thermotolerans; Td, Torulaspora delbrueckii; ns, not significant.

