

Abstract
The supply of psychiatrists in the United States is inadequate to serve the unmet demand for mental health care. Psychiatric mental health nurse practitioners (PMHNPs) may fill the widening gap between supply and demand for mental health specialists with prescribing privileges. Using Medicare claims for a 100 percent sample of fee-for-service beneficiaries (average age, sixty-one years) who had an office visit for either a psychiatrist or PMHNP from 2011 to 2019, we examined how supply and use of psychiatrists and PMHNPs changed over time and compared their practice patterns. Psychiatrists and PMHNPs treated roughly comparable patient populations with similar services and prescriptions. From 2011 to 2019 the number of PMHNPs treating Medicare beneficiaries grew 162 percent compared with a 6 percent relative decrease in the number of psychiatrists. During the same period, total annual mental health office visits per 100 beneficiaries decreased 11.5 percent from 27.4 to 24.2, the net result of a 29.0 percent drop in psychiatrist visits being offset by a 111.3 percent increase in PMHNP visits. The proportion of all mental health prescriber visits provided by PMHNPs increased from 12.5 percent to 29.8 percent in 2011–19, exceeding 50 percent in rural, full-scope-of-practice regions. PMHNPs are a rapidly growing workforce that may be instrumental for improving mental health care access.
In 2019 nearly one-quarter of adults with mental illness reported an unmet need for mental health treatment.1 One established driver behind this unmet need is a shortage of specialty mental health providers with prescribing privileges, such as psychiatrists. In 2018 more than one in three Americans lived in a mental health professional shortage area.2 This provider shortage has been particularly acute with psychiatrists, who play a crucial role in the diagnosis and pharmacologic treatment of mental illness. Between 2003 and 2013 the number of psychiatrists per 100,000 US population declined 10.2 percent.3 The shortage is projected to widen over time, with a projected national shortage of 14,000–31,000 psychiatrists in 2024.4 The deficit of mental health specialists is particularly dire in rural regions, where 80 percent of counties have no practicing psychiatrists.5
Advanced practice providers such as nurse practitioners (NPs) have the potential to address the growing need for prescribers who specialize in mental health.6 More specifically, psychiatric mental health NPs (PMHNPs)—NPs with additional education and certification to provide a range of mental health services, including prescribing—could offset this shortage.2,7,8 Physician assistants (PAs) are the other major discipline of advanced practice providers in the health care workforce, but as surveys suggest that few currently work in psychiatry practices,9 this analysis focuses on NPs. Prior research of the mental health nursing workforce has shown that registered nurses play a prominent role in the mental health care system, although there is limited evidence examining mental health–focused NPs with prescribing privileges.7,8,10,11 Several basic questions about the PMHNP workforce are largely unanswered, including how it has changed over time, the volume and characteristics of patients exclusively treated by PMHNPs, and how the workforce varies by state NP scope-of-practice regulations or by rurality and urbanicity. Scope-of-practice regulations are relevant because they can limit the ability of NPs to independently prescribe medication and can influence workforce development.12
This issue has renewed importance because the COVID-19 pandemic has led to substantially increased demand for mental health services,13 further exacerbating the national shortage of mental health specialists. PMHNPs could play an important role in addressing increased demand for virtual mental health services as telemedicine changes the landscape of how patients receive mental health care.14 Before the pandemic, NPs were among the highest adopters of telemedicine for mental health services among Medicare beneficiaries.14
In this analysis we used fee-for-service Medicare claims from 2011 to 2019 to examine the characteristics of populations treated by PMHNPs and psychiatrists, how the workforce and patient population evolved over time, and its association with state scope-of-practice regulations and rurality. Although many mental health professionals, such as psychologists, social workers, and physician assistants, provide critical services to Medicare beneficiaries, we focused on PMHNPs and psychiatrists, given their role as key mental health specialists who are also prescribers.
Study Data And Methods
Data Sources And Study Sample
We used Medicare claims for a 100 percent sample of fee-for-service Medicare beneficiaries who had an office visit for either a psychiatrist or PMHNP from January 1, 2011, through December 31, 2019. Outpatient services were defined as any evaluation and management visit or outpatient psychotherapy visits in the Medicare Part B or Outpatient files. See codes in online appendix exhibit 1.15
This study was approved by the Institutional Review Board at Harvard Medical School, which waived the requirement for informed consent, as the data were deidentified and only aggregate results would be reported.
Identifying Visits By Psychiatrists And PMHNPs
We identified psychiatrists as clinicians with a specialty of psychiatry, neuropsychiatry, or geriatric psychiatry. In Medicare data, specialty certification for NPs is not consistently used, and prior work has highlighted the fact that 25–33 percent of nurse practitioners who focus on mental health care are not documented as PMHNPs. Therefore, consistent with prior work,16 we identified PMHNPs as nurse practitioners (specialty indicator of clinical nurse specialist or nurse practitioner) whose prescription use closely matched that of psychiatrists.16 To do this, we first captured the fifty most commonly prescribed medications by psychiatrists in 2019, which together made up 91 percent of all prescriptions by psychiatrists that year. We then defined a PMHNP to be any NP with at least 80 percent of their prescriptions matching the top fifty drugs prescribed by psychiatrists in 2019. Any NPs without any Part D prescriptions would not be classified as PMHNPs through this approach. One advantage of this approach is that we can account for NPs who may use “incident to” billing that makes their practice impossible to observe in medical claims.17 A plot showing the distribution of each individual NP’s percentage of total drugs for the top fifty psychiatric medications is shown in appendix exhibit 2.15
Scope-Of-Practice Regulations
State NP scope-of-practice regulations regulate the ability of NPs to deliver care by requiring a collaborative agreement with a physician that entails supervision of the NP’s practices and prescribing activities. We used a recent detailed set of scope-of-practice classifications by Benjamin McMichael and Sara Markowitz18 that examined these regulations over the course of a twenty-three-year period based on actual statutory and regulatory language. This classification categorizes states as “full” scope of practice (that is, fully independent prescribing) and “restrictive” scope of practice (that is, any restrictions placed on prescribing independence) based on their regulations during the full period from 2011 to 2019.18 During this time, twelve states (Connecticut, Delaware, Illinois, Minnesota, Nebraska, Nevada, New York, Rhode Island, South Dakota, Utah, Virginia, and West Virginia) switched from “restrictive” to “full” scope of practice (appendix exhibit 3).15 For analyses that involved scope of practice as a covariate, we excluded the beneficiaries in these states, who made up between 2.0 and 4.6 percent of total beneficiaries within each group. Similarly, for analyses involving trends by geography, we excluded providers with missing ZIP codes. These providers accounted for 1.5–3.7 percent of total office visits within each provider group by year.
Outcomes
Our primary outcomes of interest were the number of PMHNPs and psychiatrists billing for Part B outpatient and psychotherapy services, the volume of outpatient and psychiatric services by clinician group, and how these numbers varied by rurality and scope-of-practice regulations. We measured clinician supply by capturing the unique number of National Provider Identifiers for psychiatrists or PMHNPs billing for an office-based service in the Medicare Part B file annually by county. For the 6 percent of beneficiaries seeing both PMHNPs and psychiatrists during the study period, we classified them as seeing psychiatrists. In this way we focused on the differences between patients exclusively seeing PMHNPs versus psychiatrists.
We also captured the volume of office-based services and prescriptions and the number of unique beneficiaries served by both groups of clinicians. Finally, we examined the top ten billing codes and prescriptions from psychiatrists and PMHNPs.
Covariates
We captured beneficiary demographic information, such as age, sex, dual eligibility for Medicaid and Medicare coverage, and original reason for Medicare entitlement, from Medicare enrollment files for each year. Data on race came from an imputed and validated variable created by the Research Triangle Institute for Medicare that is included in the research identifiable claims data.19 Information on the patient’s mental health comorbidities was obtained from the Medicare Chronic Conditions Data Warehouse.
We used the Area Health Resources File to capture county-level characteristics, including socioeconomic indicators (median income, percentage of residents with a high school degree), proportion of county residents living in urban areas, and county racial and ethnic distributions.20 We used the Centers for Disease Control and Prevention’s 2013 urban-rural classification to categorize counties into three groups: rural (defined as micropolitan or noncore counties with populations of <50,000 people), medium (defined as counties in Metropolitan Statistical Areas with populations between ≥50,000 and <1,000,000 people), and large (counties with populations of 1,000,000 people).21
Statistical Analysis
We first examined the characteristics and comorbidities of beneficiaries who exclusively had visits with PMHNPs versus those who had visits with psychiatrists in 2019. We used unadjusted bivariate statistical tests as appropriate to compare characteristics across groups. We also tabulated the number of unique Common Procedural Terminology (CPT) codes billed by PMHNPs or psychiatrists in 2019 and listed the ten most common codes for each group. We examined the prescribing of mental health medications in 2019 by psychiatrists and PMHNPs grouped into nineteen drug classes by a psychiatrist and internal medicine specialist (Alisa B. Busch, Michael Lawrence Barnett).
We estimated a multivariable linear regression model at the beneficiary level to test whether patients exclusively seeing PMHNPs differed from those seeing psychiatrists in 2019. The model controlled for beneficiary characteristics, noted in exhibit 1. To estimate the association between changes in outcomes by rurality and urbanicity and scope of practice (full versus restricted scope), we also included terms for rurality and urbanicity and state scope-of-practice regulations, controlling for county characteristics.
Exhibit 1:
Characteristics of Medicare beneficiaries seeing psychiatrists or psychiatric mental health nurse practitioners (PMHNPs) in the US, 2019
| Psychiatrist | PMHNP | aOR | P value | |
|---|---|---|---|---|
| Total beneficiaries (N) | 1,290,026 | 608,787 | —a | —a |
| Total clinicians (N) | 23,251 | 11,929 | —a | —a |
| Beneficiaries per clinician (mean) | 55.5 | 51.0 | —a | —a |
| Age in years (mean) | 61.4 | 62.0 | 1.01 | <0.001 |
| Age distribution, years (%) | ||||
| <25 | 0.9 | 0.9 | —a | —a |
| 25–34 | 5.3 | 5.3 | —a | —a |
| 35–44 | 9.4 | 9.5 | —a | —a |
| 45–54 | 13.7 | 13.4 | —a | —a |
| 55–64 | 19.8 | 18.7 | —a | —a |
| 65–74 | 33.2 | 31.6 | —a | —a |
| 75–84 | 13.8 | 15.7 | —a | —a |
| 85+ | 3.8 | 5.0 | —a | —a |
| Gender (%) | ||||
| Female | 60.2 | 58.5 | Ref. | —a |
| Male | 39.8 | 41.5 | 0.98 | <0.001 |
| Race (%) | ||||
| Non-Whiteb | 5.3 | 18.5 | Ref. | —a |
| White | 76.2 | 79.8 | 1.15 | <0.001 |
| Original reason for Medicare enrollment (%) | ||||
| Age ≥65 | 37.4 | 40.4 | Ref. | —a |
| Disability | 62.0 | 59.0 | 0.92 | <0.001 |
| ESRD | 0.3 | 0.3 | 0.96 | 0.16 |
| ESRD and disability | 0.3 | 0.3 | 1.03 | 0.44 |
| Eligible for Medicaid (%) | ||||
| No | 52.3 | 51.7 | Ref. | —a |
| Yes | 47.7 | 48.3 | 1.21 | <0.001 |
| Beneficiary residence (%) | ||||
| Urban | 55.2 | 39.5 | Ref. | —a |
| Medium | 32.9 | 41.9 | 1.78 | <0.001 |
| Rural | 9.9 | 16.6 | 2.37 | <0.001 |
| Chronic conditions | ||||
| Mental health condition count (mean) | 2.0 | 1.8 | —a | —a |
| Anxiety (%) | 60.7 | 51.6 | 0.80 | <0.001 |
| Autism (%) | 2.6 | 2.1 | 0.71 | <0.001 |
| Bipolar (%) | 30.9 | 24.3 | 0.70 | <0.001 |
| Depression (%) | 62.3 | 49.6 | 0.60 | <0.001 |
| Schizophrenia and psychosis (%) | 25.7 | 20.5 | 0.68 | <0.001 |
| Alcohol use disorder (%) | 6.9 | 6.4 | 1.13 | <0.001 |
| SUD (nonalcohol) (%) | 8.0 | 7.7 | 1.10 | <0.001 |
SOURCE Authors’ analysis of data from Medicare claims from January 1, 2011, through December 31, 2019. NOTES The adjusted odds ratios (aORs) were estimated using multivariable logistic regression, controlling for the patient characteristics in the table. We also included terms for rurality and urbanicity and state scope-of-practice regulations, controlling for county characteristics. The aOR for age represents the change associated with an increase of ten years in age from the mean. Odds ratios for individual chronic conditions are compared with the reference group of patients without the condition. Nurse practitioner specialties are defined using their prescribing in Medicare claims. As such, we first obtained the 50 most commonly prescribed medications by psychiatrists in 2019, which comprised 91 percent of all prescriptions by psychiatrists that year. We define a PMHNP to be any NP with at least 50 percent of their prescriptions matching the top 50 drugs prescribed by psychiatrists in 2019. ESRD is end-stage renal disease. SUD is substance use disorder.
Not applicable.
The research analyzed data that compared health outcomes in patients who identified as White with patients who did not identify as White (identified here as non-White).
Analyses were performed in Stata, version 15. The 95% confidence interval around reported estimates reflects 0.025 in each tail or p ≤ 0.05.
Limitations
This analysis has several limitations. First, because our analysis examines a Medicare population, these findings might not generalize to other populations with differing health insurance. Second, this analysis is facilitated by a novel approach to define PMHNPs as a distinct specialty among NPs on the basis of their empirical patterns of prescribing. The similarities between NPs and psychiatrists of the most common billing codes, prescriptions, and patient populations supports the validity of this approach, although there may be misclassification bias, as there would be with any choice of algorithm. Third, this is an observational analysis that does not account for unobserved differences between states with and without full scope-of-practice regulations. Therefore, our results on the differences in workforce trends by geography and scope of practice should be treated as descriptive, rather than having any direct casual implications for the role of scope-of-practice regulations in workforce policy. Fourth, there is no “gold standard” consensus definition on what constitutes full and restricted scope-of-practice regulations for NPs. Studies vary in their definitions; therefore, our results could have differed if we had used different criteria to define scope of practice.18 Fifth, we are not able to capture visits with PMHNPs that used “incident to” billing.17 Therefore, we may be undercounting the supply of office visits provided by PMHNPs. Finally, our analysis does not take account of the potential role of typically nonprescribing mental health professionals such as social workers or psychologists. They are a critical part of the mental health workforce but are less likely to be involved in managing psychiatric medications. Our study similarly does not take into account physician assistants, who are also involved in providing mental health care, although in small numbers; less than 2 percent of physician assistants were classified as mental health specialists in 2020.21
Study Results
Patients Treated And Services Provided By PMHNPs And Psychiatrists
We identified 1,898,813 beneficiaries who had an office visit either exclusively with PMHNPs or psychiatrists (with or without PMHNPs) in 2019 (exhibit 1). On average, beneficiaries exclusively seeing PMHNPs were more likely to be eligible for Medicaid (48.3 percent versus 47.7 percent, respectively) and more likely to reside in a rural county (16.6 percent versus 9.9 percent). Patients exclusively seeing PMHNPs also had, on average, 1.8 mental health conditions versus 2.0 for those seeing psychiatrists (exhibit 1). Patients exclusively seeing PMHNPs had comparable prevalence of substance use disorders (7.7 percent versus 8.0 percent) compared with those seeing psychiatrists, but were less likely to have psychotic disorders (20.5 percent versus 25.7 percent), and they were also less likely to have depression and anxiety (49.6 percent versus 62.3 percent and 51.6 percent versus 60.7 percent, respectively). In 2019 psychiatrists treated an average of 55.5 beneficiaries annually compared with 51.0 for PMHNPs.
In 2019 the most common outpatient services provided by psychiatrists were evaluation and management office visits for established Medicare patients (83.8 percent of all psychiatrist services) and individual psychotherapy (8.7 percent). PMHNPs had a roughly comparable breakdown of services: 87.8 percent of their services in 2019 were evaluation and management for established patients and 4.4 percent were for psychotherapy, which was less than for psychiatrists (appendix exhibit 4).15 Within evaluation and management visits, PMHNPs also had a higher proportion of longer visits as opposed to psychiatrists; 47.0 percent of PMHNPs billed for either codes 99214 or 99215, the two CPT codes for the longest visits, as opposed to 37.4 percent for psychiatrists.
The drug classes prescribed by psychiatrists and PMHNPs in 2019 were also similar (appendix exhibit 5).15 Individual psychiatrists prescribed drugs in an average of 12.3 (out of thirteen maximum) drug classes, whereas PMHNPs prescribed across 12.5 classes. The proportion of prescriptions within thirteen separate mental health drug classes was closely matched between the two groups of providers. One exception was benzodiazepines, which made up 17.5 percent of psychiatrist prescriptions versus 12.1 percent for PMHNPs.
Provider Supply And Office Visits Trends
From 2011 to 2019 the number of PMHNPs treating Medicare beneficiaries grew from 4,546 to 11,929 (an increase of 162 percent) compared with a decrease from 24,659 to 23,251 (a decrease of 6 percent) for psychiatrists (appendix exhibit 8).15 Adjusting for population, the number of PMHNPs per 100,000 beneficiaries increased from 13.4 to 35.0 between 2011 and 2019 (an increase of 161.6 percent) and the number of psychiatrists per 100,000 beneficiaries decreased from 72.6 to 68.3 (decrease of 6.0 percent) (exhibit 2). The proportion of mental health office visits provided by PMHNPs (using the denominator of all visits by psychiatrists and PMHNPs) increased from 12.5 percent to 29.8 percent from 2011 to 2019 (appendix exhibit 6).15
Exhibit 2:

Psychiatrist and psychiatric mental health nurse practitioner provider (PMHNP) supply and Medicare beneficiary visits over time in the US, January 1, 2011–December 31, 2019
Source/Notes: SOURCE Authors’ analysis of data from Medicare claims from January 1, 2011, through December 31, 2019.
Between 2011 and 2019 total mental health office visits decreased from 9,293,819 to 8,254,255, for a relative decrease of 11.2 percent, corresponding to a decrease in visits per 100 beneficiaries from 27.4 to 24.2, or an 11.7 percent decrease (exhibit 2, appendix exhibit 6).15 The number of visits to psychiatrists per 100 beneficiaries decreased from 24.0 to 17.0, for a relative decrease of 29.0 percent, offset by growth in visits to PMHNPs per 100 beneficiaries from 3.4 to 7.2, for a relative increase of 111.3 percent.
Trends By Rurality And Urbanicity And Scope Of Practice
Changes in the supply of psychiatrists and PMHNPs varied by rurality and urbanicity and scope-of-practice regulation (exhibit 3). In urban counties with full NP scope-of-practice regulations, between 2011 and 2019 the number of psychiatrists per 100,000 Medicare beneficiaries decreased from 70.9 to 57.5 (a 19 percent relative decrease), whereas the number of PMHNPs per 100,000 Medicare beneficiaries increased from 15.4 to 36.3 (a 136 percent relative increase). In contrast, rural counties with full scope-of-practice regulations and laws had a drop in psychiatry supply from 36.1 to 22.4 per 100,000 beneficiaries (a 38 percent relative decrease) and an increase in PMHNP supply from 17.7 to 28.7 per 100,000 beneficiaries (a 62 percent relative increase), such that PMHNPs outnumbered psychiatrists in these areas. In 2019 PMHNPs provided 33.7 percent and 50.8 percent of mental health office visits for those in urban and rural areas with full scope-of-practice regulations (appendix exhibit 7).15
Exhibit 3:

Psychiatrist and psychiatric mental health nurse practitioner provider supply by urban or rural location over time in US states with full scope of practice, January 1, 2011–December 31, 2019
Source/Notes: SOURCE Authors’ analysis of data from Medicare claims from January 1, 2011, through December 31, 2019. NOTES Providers with missing ZIP codes were excluded. These providers accounted for anywhere from 1.5 percent to 3.7 percent of total office visits within each provider group by year. States with changes in scope-of-practice regulations from 2011 to 2019 also were excluded from this analysis (see Methods).
There was a similar pattern of change in mental health prescriber supply in urban and rural counties with limited scope-of-practice regulations, although with lower overall PMHNP supply (exhibit 4). In urban and rural counties, respectively, with restricted scope of practice, the proportion of office visits to PMHNPs was 23.0 percent and 41.7 percent in 2019 (appendix exhibit 7).15
Exhibit 4:
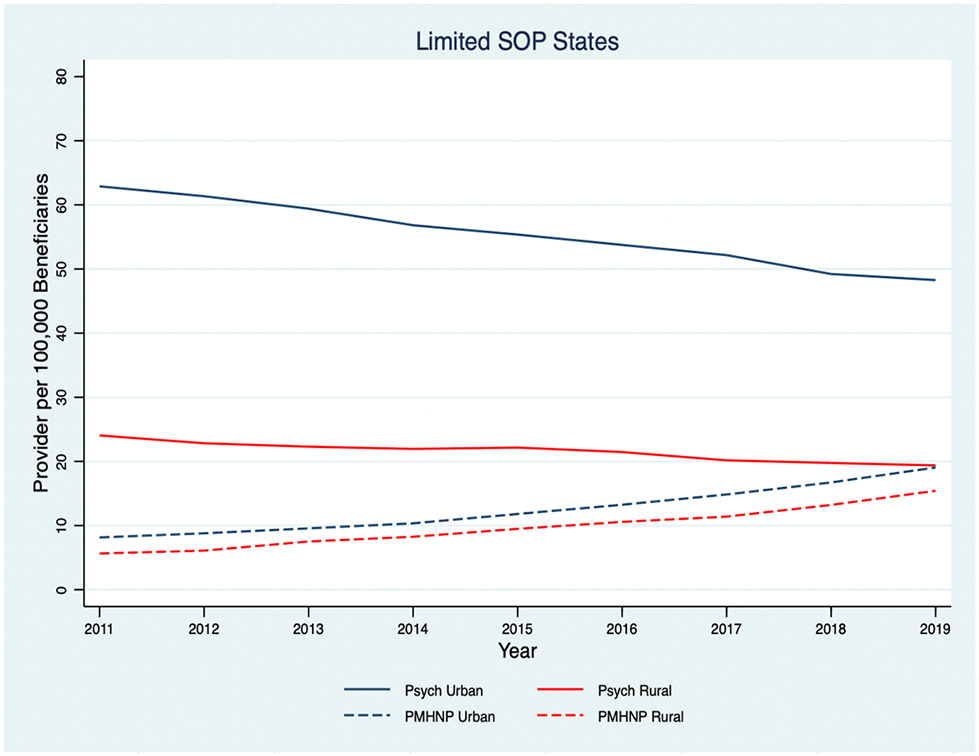
Psychiatrist and psychiatric mental health nurse practitioner provider supply by urban or rural location over time in US states with limited scope of practice, January 1, 2011–December 31, 2019
Source/Notes: SOURCE Authors’ analysis of data from Medicare claims from January 1, 2011, through December 31, 2019. NOTES Providers with missing ZIP codes were excluded. These providers accounted for anywhere from 1.5 percent to 3.7 percent of total office visits within each provider group by year. States with changes in scope-of-practice regulations from 2011 to 2019 also were excluded from this analysis (see Methods).
Discussion
In this analysis of national Medicare claims, we found that the supply of PMHNPs treating Medicare beneficiaries grew rapidly between 2011 and 2019. By 2019 nearly one in three visits by Medicare beneficiaries with a mental health prescriber was with a PMHNP. The size of the PMHNP workforce serving Medicare beneficiaries has more than doubled from 2011 to 2019, whereas the psychiatrist workforce diminished. During this period the total number of office visits with mental health prescribers and visits per capita decreased, despite stable or rising demand for mental health services during this time. Although a mental health professionals’ practice is multidimensional and difficult to describe in one or two metrics, the most common types of visits and medications prescribed by psychiatrists and PMHNPs were similar.
To our knowledge this is the first comprehensive national study of PMHNP practice using Medicare claims data. Our findings are consistent with prior evidence showing a decline in the number of psychiatrists over time and a rapid rise in the overall NP workforce.3,22 The critical role of PMHNPs in rural communities is also consistent with existing literature showing that overall, more primary care NPs practice in rural areas and in full-scope-of-practice states.
In 2019 PMHNPs cared for a wide breadth of mental health conditions and prescribed similar medications. However, PMHNPs cared for Medicare patients with fewer co-occurring mental health conditions than psychiatrists, also notably caring for fewer patients with bipolar or psychotic disorders. This suggests that the most psychiatrically complex patients may continue to be managed by psychiatrists while the PMHNP supply grows.
The patterns we observe imply that PMHNPs are filling in the gap in outpatient demand left behind by a diminishing psychiatrist supply. This could be in part driven by the fact that a majority of psychiatrists do not accept Medicare insurance.23,24 Furthermore, despite the growing shortage of psychiatrists and very rapid growth of PMHNPs, total visits per capita decreased during the same period. There is little question that demand for mental health services has increased since the onset of the COVID-19 pandemic in 2020, and the PMHNP workforce is poised meet some of that demand.
A frequent question raised in any study of physician and NP practice is the quality of care and clinical scope that each professional can provide for a given population. To our knowledge there is no evidence directly comparing the quality of care of PMHNPs versus psychiatrists. A large evidence base, including multiple randomized clinical trials, suggests that in primary care settings, NPs and physicians have similar quality for managing chronic illness and routine primary care.25-27 However, this is still a polarizing topic where NPs and physicians have diverging viewpoints, particularly when it comes to scope-of-practice policies.28,29 Further research is needed to examine any differences in quality of care or health outcomes for the treatment provided by PMHNPs versus other clinicians.
Policy Implications
With an overwhelmed mental health care system in the post-COVID-19 era, there is an urgent need for solutions to expand access to more Americans. The rapid growth of the PMHNP workforce suggests that policy facilitating recruitment and training of PMHNPs, such as targeted investment in nursing programs or loan repayment, may have a greater short-term impact on increasing the mental health workforce than physician-targeted strategies, especially in rural areas.
An additional consideration is the fact that post-COVID-19, much mental health care is provided virtually.14 In prior work, we found that prepandemic, NPs were one of the largest provider groups engaging in mental health telemedicine.30 It is possible that PMHNPs may also play a key role in the rise of virtual mental health, which is a new paradigm of care likely to persist for many years.
Conclusion
We find that PMHNPs are a rapidly growing workforce that have already outgrown psychiatrist supply in some areas of the US. Additional evidence is needed to better clarify the nature of the care provided by PMHNPs and their potential role in expanding equitable access to mental health care in rural areas. However, PMHNPs will need to be considered in any future mental health policy aiming to improve access to care or influence the mental health workforce.
Supplementary Material
Acknowledgment
This research was presented at the AcademyHealth Annual Research Meeting, June 14–17, 2021, virtual. Michael Lawrence Barnett reports receiving financial support from the National Institute on Aging (K23 AG058806-01) and the National Institute of Mental Health (R01 MH112829-01). The content of this manuscript is solely the responsibility of the authors and does not necessarily represent the official views of the National Institute on Aging or the National Institutes of Health.
Biographies
Arno Cai, Harvard University, Boston, Massachusetts.
Ateev Mehrotra, Harvard University.
Hayley Germack, University of Pittsburgh, Pittsburgh, Pennsylvania.
Alisa B. Busch, Harvard University.
Haiden A. Huskamp, Harvard University.
Michael L Barnett (mbarnett@hsph.harvard.edu), Harvard University.
Contributor Information
Arno Y Cai, Department of Health Policy and Management, Harvard T. H. Chan School of Public Health, Boston, Massachusetts.
Ateev Mehrotra, Department of Health Care Policy, Harvard Medical School, Department of Medicine, Beth Israel Deaconess Medical Center, Boston, Massachusetts.
Hayley Germack, University of Pittsburgh, Pittsburgh, PA.
Alisa B. Busch, Department of Health Care Policy, Harvard Medical School, Boston, Massachusetts; McLean Hospital, Belmont, MA.
Haiden A. Huskamp, Department of Health Care Policy, Harvard Medical School, Boston, Massachusetts.
Michael L. Barnett, Department of Health Policy and Management, Harvard T. H. Chan School of Public Health, Division of General Internal Medicine and Primary Care, Department of Medicine, Brigham and Women’s Hospital, Boston, Massachusetts.
Notes
- 1.Mental Health America. The state of mental health in America [Internet]. Alexandria (VA): Mental Health America; [cited 2022 Jul 8]. Available from: https://www.mhanational.org/issues/state-mental-health-america [Google Scholar]
- 2.Henry J Kaiser Family Foundation. Mental health care health professional shortage areas (HPSAs) [Internet]. San Francisco (CA): KFF; 2021. Sep 30 [cited 2022 Jul 8]. Available from: https://www.kff.org/other/state-indicator/mental-health-care-health-professional-shortage-areas-hpsas/ [Google Scholar]
- 3.Bishop TF, Seirup JK, Pincus HA, Ross JS. Population of US practicing psychiatrists declined, 2003–13, which may help explain poor access to mental health care. Health Aff (Millwood). 2016;35(7):1271–7. [DOI] [PubMed] [Google Scholar]
- 4.Satiani A, Niedermier J, Satiani B, Svendsen DP. Projected workforce of psychiatrists in the United States: a population analysis. Psychiatr Serv. 2018;69(6):710–3. [DOI] [PubMed] [Google Scholar]
- 5.New American Economy. The silent shortage [Internet]. Washington (DC): New American Economy; 2017. Oct [cited 2022 Jul 8]. Available from: http://www.newamericaneconomy.org/wp-content/uploads/2017/10/NAE_PsychiatristShortage_V6-1.pdf [Google Scholar]
- 6.Morreale MK, Balon R, Coverdale J, Louie AK, Beresin E, Guerrero APS, et al. Supporting the education of nurse practitioners and physician assistants in meeting shortages in mental health care. Acad Psychiatry. 2020;44(4):377–9. [DOI] [PMC free article] [PubMed] [Google Scholar]
- 7.Hanrahan NP, Hartley D. Employment of advanced-practice psychiatric nurses to stem rural mental health workforce shortages. Psychiatr Serv. 2008;59(1):109–11. [DOI] [PMC free article] [PubMed] [Google Scholar]
- 8.Yang BK, Trinkoff AM, Zito JM, Burcu M, Safer DJ, Storr CL, et al. Nurse practitioner independent practice authority and mental health service delivery in U.S. community health centers. Psychiatr Serv. 2017;68(10):1032–8. [DOI] [PubMed] [Google Scholar]
- 9.National Commission on Certification of Physician Assistants. Statistical profile of recently certified physician assistants archives [Internet]. Johns Creek (GA): NCCPA; [cited 2022 Jul 8]. Available from: https://www.nccpa.net/report-type/statistical-profile-of-recently-certified-physician-assistants/ [Google Scholar]
- 10.Phoenix BJ. The current psychiatric mental health registered nurse workforce. J Am Psychiatr Nurses Assoc. 2019;25(1):38–48. [DOI] [PubMed] [Google Scholar]
- 11.Germack HD, Drake C, Donohue JM, Golberstein E, Busch SH. National trends in outpatient mental health service use among adults between 2008 and 2015. Psychiatr Serv. 2020;71(11):1127–35. [DOI] [PMC free article] [PubMed] [Google Scholar]
- 12.Delaney KR. Psychiatric mental health nursing advanced practice workforce: capacity to address shortages of mental health professionals. Psychiatr Serv. 2017;68(9):952–4. [DOI] [PubMed] [Google Scholar]
- 13.Marques L, Bartuska AD, Cohen JN, Youn SJ. Three steps to flatten the mental health need curve amid the COVID-19 pandemic. Depress Anxiety. 2020;37(5):405–6. [DOI] [PMC free article] [PubMed] [Google Scholar]
- 14.Patel SY, Mehrotra A, Huskamp HA, Uscher-Pines L, Ganguli I, Barnett ML. Variation In telemedicine use and outpatient care during the COVID-19 pandemic in the United States. Health Aff (Millwood). 2021;40(2):349–58. [DOI] [PMC free article] [PubMed] [Google Scholar]
- 15.To access the appendix, click on the Details tab of the article online.
- 16.Richard JV, Huskamp HA, Barnett ML, Busch AB, Mehrotra A. A methodology for identifying behavioral health advanced practice registered nurses in administrative claims. Health Serv Res. 2022;57(4):973–8. [DOI] [PMC free article] [PubMed] [Google Scholar]
- 17.Medicare Payment Advisory Commission staff. Improving Medicare’s payment policies for advanced practice registered nurses and physician assistants [Internet]. Washington (DC): MedPAC; 2019. Feb 19 [cited 2022 Jul 8]. Available from: https://www.medpac.gov/improving-medicares-payment-policies-for-advanced-practice-registered-nurses-and-physician-assistants/ [Google Scholar]
- 18.McMichael BJ, Markowitz S. Toward a uniform classification of nurse practitioner scope of practice laws [Internet]. Cambridge (MA): National Bureau of Economic Research; 2020. Dec [cited 2022 Jul 8]. (NBER Working Paper No. 28192). Available from: https://www.nber.org/papers/w28192 [Google Scholar]
- 19.Jarrín OF, Nyandege AN, Grafova IB, Dong X, Lin H. Validity of race and ethnicity codes in Medicare administrative data compared with gold-standard self-reported race collected during routine home health care visits. Med Care. 2020;58(1):e1–8. [DOI] [PMC free article] [PubMed] [Google Scholar]
- 20.Health Resources and Services Administration. Data downloads, Area Health Resources Files [Internet]. Rockville (MD): HRSA; [cited 2022 Jul 8]. Available from: https://data.hrsa.gov/data/download [Google Scholar]
- 21.National Center for Health Statistics. NCHS urban-rural classification scheme for counties [Internet]. Hyattsville (MD): NCHS; 2017. [cited 2022 Jul 8]. Available from: https://www.cdc.gov/nchs/data_access/urban_rural.htm [Google Scholar]
- 22.Delaney KR, Vanderhoef D. The psychiatric mental health advanced practice registered nurse workforce: charting the future. J Am Psychiatr Nurses Assoc. 2019;25(1):11–8. [DOI] [PubMed] [Google Scholar]
- 23.Benjenk I, Chen J. Trends in self-payment for outpatient psychiatrist visits. JAMA Psychiatry. 2020;77(12):1305–7. [DOI] [PMC free article] [PubMed] [Google Scholar]
- 24.Bishop TF, Press MJ, Keyhani S, Pincus HA. Acceptance of insurance by psychiatrists and the implications for access to mental health care. JAMA Psychiatry. 2014;71(2):176–81. [DOI] [PMC free article] [PubMed] [Google Scholar]
- 25.Jackson GL, Smith VA, Edelman D, Woolson SL, Hendrix CC, Everett CM, et al. Intermediate diabetes outcomes in patients managed by physicians, nurse practitioners, or physician assistants: a cohort study. Ann Intern Med. 2018;169(12):825–35. [DOI] [PubMed] [Google Scholar]
- 26.Martínez-González NA, Djalali S, Tandjung R, Huber-Geismann F, Markun S, Wensing M, et al. Substitution of physicians by nurses in primary care: a systematic review and meta-analysis. BMC Health Serv Res. 2014;14:214. [DOI] [PMC free article] [PubMed] [Google Scholar]
- 27.Donelan K, DesRoches CM, Dittus RS, Buerhaus P. Perspectives of physicians and nurse practitioners on primary care practice. N Engl J Med. 2013;368(20):1898–906. [DOI] [PubMed] [Google Scholar]
- 28.American Association of Nurse Practitioners. Joint statement on the scope of nurse practitioners [Internet]. Arlington (VA): AANP; 2020. Nov 12 [cited 2022 Jul 8]. Available from: https://www.aanp.org/advocacy/advocacy-resource/aanp-and-the-np-roundtable-joint-statements/joint-statement-on-the-scope-of-nurse-practitioners [Google Scholar]
- 29.Lampariello M Nurse practitioners, physician assistants clash with physicians in #StopScopeCreep movement. Clinical Advisor [serial on the Internet]. 2020. Dec 2 [cited 2022 Jul 8]. Available from: https://www.clinicaladvisor.com/home/topics/practice-management-information-center/np-pa-clash-physicians-stop-scope-creep/ [Google Scholar]
- 30.Barnett ML, Huskamp HA, Busch AB, Uscher-Pines L, Chaiyachati KH, Mehrotra A. Trends in outpatient telemedicine utilization among rural Medicare beneficiaries, 2010 to 2019. JAMA Health Forum. 2021;2(10):e213282. [DOI] [PMC free article] [PubMed] [Google Scholar]
Associated Data
This section collects any data citations, data availability statements, or supplementary materials included in this article.