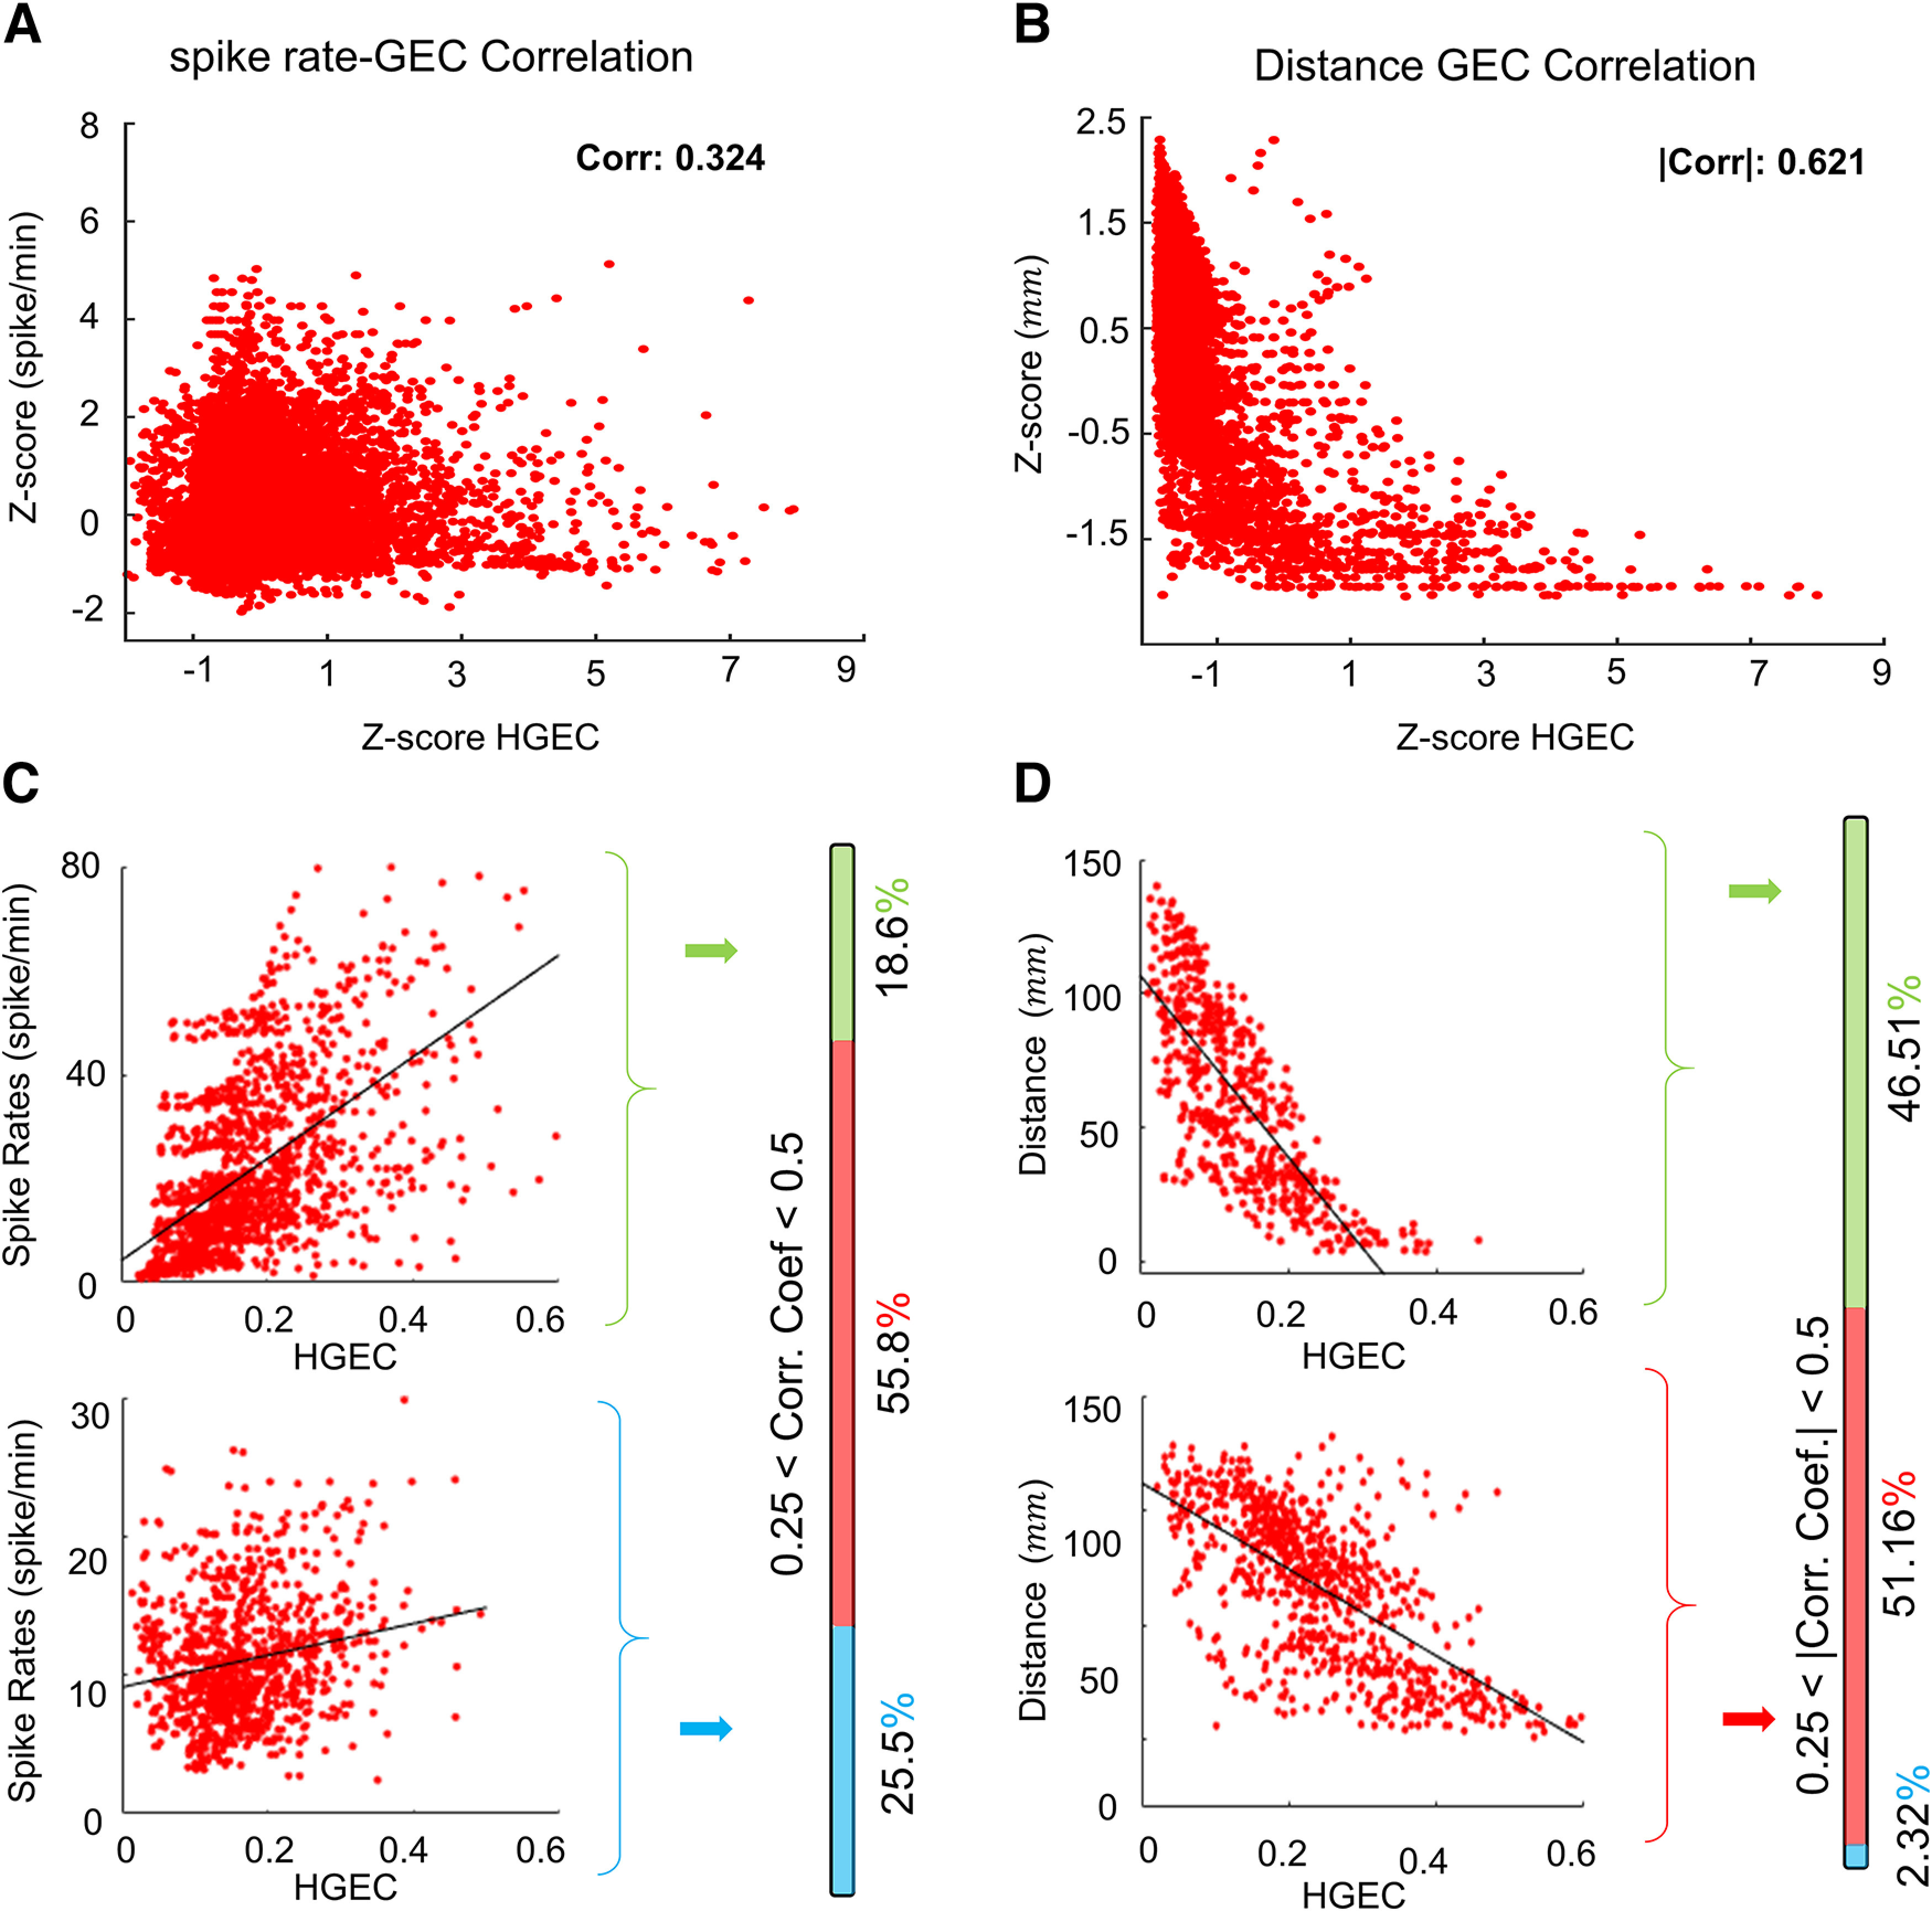
Figure 5.

Correlation between HGEC and interictal spike rate and electrode distance. A, B, Scatter plots illustrating HGEC in relation to spike rate (A) and electrode contact distance (B). Values are represented as normalize z scores. C, Specific examples of high (top) and low (bottom) correlation between spike rate and HGEC. The vertical bar to the right shows the percentage correlation coefficients for all patients. High r > 0.5 (shaded green), medium 0.25 < r < 0.5 (red), and low correlation r < 0.25 (blue). In most patients, the correlation between spike rate and HGEC was low. D, Same as panel C but correlation with electrode distance. In most patients, there was a high correlation between electrode distance and HGEC, i.e., as electrode distance decreases, HGEC increases. All correlations shown had a p < 0.0001.
