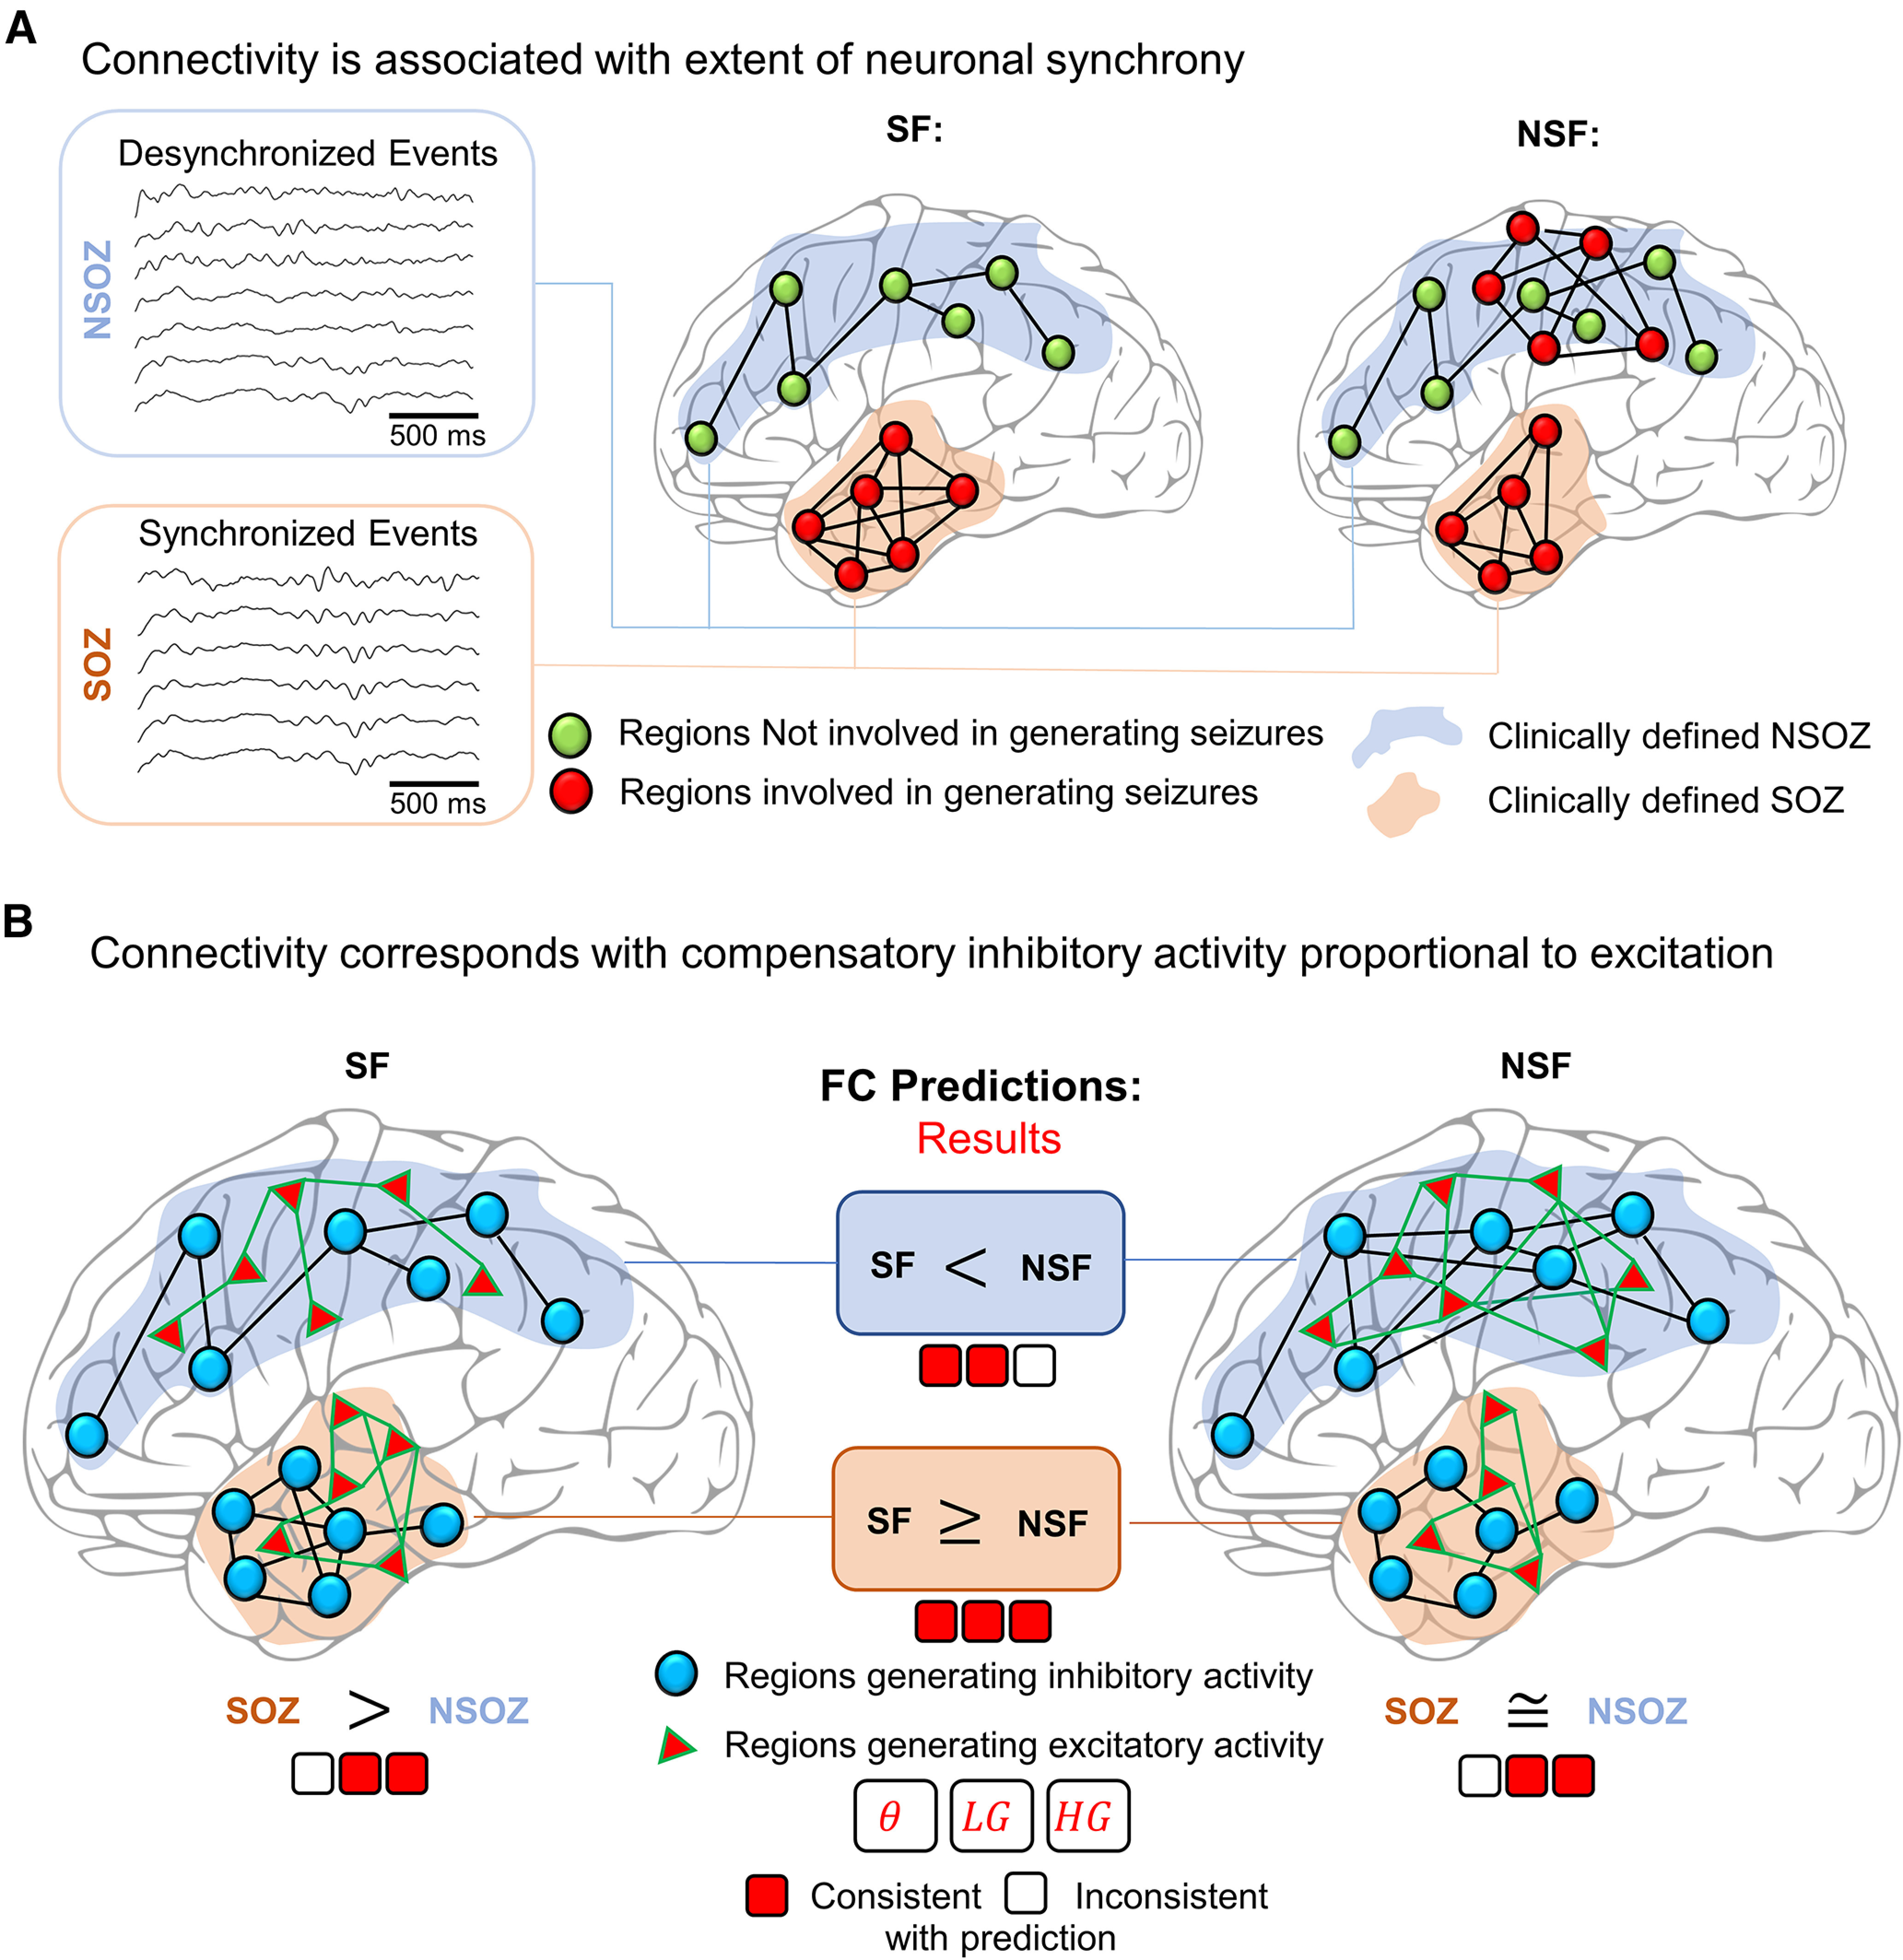
Figure 8.

Relating connectivity to neuronal circuits mechanisms. A, A schematic illustrating brain regions involved in generating seizures (red dots) or those not involved (green dots). Clinically-defined seizure onset zone (SOZ; shaded orange) and not seizure onset zone (NSOZ; shaded blue). In an ideal seizure outcome, i.e., seizure free, all regions involved in generating a seizure are in the SOZ. The synchrony between brain regions is illustrated as connections (black lines), and a greater number of lines indicates greater synchrony. In not seizure-free patients, the SOZ is incompletely identified and a portion of the NSOZ contains regions involved in generating seizures. B, Prediction of the differences in the event connectivity when the strength of connectivity corresponds with increased synchronous inhibitory activity (blue dots and black lines) that is proportional to increased synchronous excitatory activity (red triangles and green lines). An assumption is greater synchrony associated with brain regions involved in generating seizures, which leads to the following predictions: (1) in seizure-free (SF) patients, stronger connectivity in SOZ than NSOZ; (2) in not seizure-free (NSF) patients, little or no difference in connectivity between SOZ and NSOZ; and (3) stronger connectivity in the NSOZ of NSF than SF patients. Results from our analysis are presented as three squares for each frequency band (theta = θ, low gamma = LG, high gamma = HG), which are colored red and white for actual results that are consistent or inconsistent, respectively, with the aforementioned predictions.
