

Abstract
Phytophthora ramorum is an invasive, broad host-range pathogen that causes ramorum blight and sudden oak death in forest landscapes of western North America. In commercial nurseries, asymptomatic infections of nursery stock by P. ramorum and other Phytophthora species create unacceptable risk, and complicate inspection and certification programs designed to prevent introduction and spread of these pathogens. In this study, we continue development of a volatile organic compound (VOC)-based test for detecting asymptomatic infections of P. ramorum in Rhododendron sp. We confirm detection of P. ramorum from volatiles collected from asymptomatic root-inoculated Rhododendron plants in a nursery setting, finding that the VOC profile of infected plants is detectably different from that of healthy plants, both when measured from ambient VOC emissions and from VOCs extracted from leaf material. Predicting infection status was successful from ambient volatiles, which had a mean area under the curve (AUC) value of 0.71 ± 0.17, derived from corresponding receiver operating characteristic curves from an extreme gradient boosting discriminant analysis (XGB-DA). This compares with extracted leaf volatiles, which resulted in a lower AUC value of 0.51 ± 0.21. In a growth chamber, we contrasted volatile profiles of asymptomatic Rhododendron plants with roots infected with one of three pathogens: P. ramorum, Phytophthora cactorum and Rhizoctonia solani. Each pathogen induced unique and measurable changes, but generally the infections reduced volatile emissions until 17 weeks after inoculation, when emissions trended upwards relative to mock-inoculated controls. Forty-five compounds had significant differences compared to mock-inoculated controls in at least one host-pathogen combination.
Keywords: mass spectrometry, nursery detection, ramorum blight, volatile organic compounds (VOCs)
Introduction
Phytophthora ramorum is an invasive plant pathogen that causes sudden oak death (SOD) in coastal forests of western North America and ramorum blight in many understory and ornamental plants (Grünwald et al. 2008; Rizzo et al. 2002; Rizzo et al. 2005; Werres et al. 2001). This oomycete pathogen has a wide host range and is of international concern (USDA-APHIS 2020). Regulatory actions, such as quarantines and destruction of infected nursery stock, seek to block the spread of P. ramorum in the nursery and prevent its escape into natural landscapes and agricultural systems (Chastagner et al. 2010; Cunniffe et al. 2016; Venette and Cohen 2006). Complicating these efforts are asymptomatic, or cryptic, infections, particularly in roots, which can persist for months with above-ground symptoms not developing or delayed until developmental or environmental factors trigger disease expression (Frankel et al. 2018; Garbelotto et al. 2018; Hansen et al. 2012; Roubtsova and Bostock 2009). Undetected root and soil infestations serve as potential reservoirs of inoculum and present a significant challenge for disease management and nursery inspection and certification programs (Chastagner et al. 2013; Junker et al. 2016; Shishkoff 2007; Vercauteren et al. 2013).
Current testing for presence of P. ramorum and other Phytophthora spp. involves several methods that generally rely on sampling symptomatic tissue. These include plating of leaf or stem samples on selective media, which takes several days and is subject to variation depending on host and pathogen species. Pathogen genus-level lateral-flow immunoassays and species-specific molecular diagnostics by real-time or isothermal PCR are limited by their requirement for direct assessment of infected tissue containing pathogen cells, antigenic material, or nucleic acid (Vettraino et al. 2010). Leaf or pear fruit baiting can capture infectious zoospores from soil suspensions and aqueous samples, but generally require further processing by one of the above methods.
A fast, high-throughput and on-site method with sufficient sensitivity could serve as an initial screen for cryptic infections and infestations, and could help focus sampling in large nurseries or ports of entry for conventional laboratory tests and confirmatory diagnoses. A field portable system to detect the “scent” of Phytophthora-infected plants could help flag shipments and nursery stock for interception and containment, or identify them for scrutiny and further analysis before plants are distributed. Such a method would be especially useful in the regulatory environment given the expansion of the catalog of new and emerging Phytophthora species of concern, their devastating impact in various landscapes, and the continuing risk posed by the yearly import to the U.S. of over 2.8 billion plants for planting (Liebhold et al. 2012).
Nursery surveys throughout Europe indicate a significant proportion of plants cryptically infested with Phytophthora species, which if imported to the U.S. or other markets pose a risk to crops and other plant resources (Jung et al. 2016). Domestic shipments between nurseries also present unacceptable risk of distribution of high-consequence Phytophthora species (Bienapfl and Balci 2014; Frankel et al. 2018; Parke et al. 2014). In 2014-16, well over 50 Phytophthora taxa were identified in native plant nurseries and restoration sites, including species new to the U.S., new hybrids, and a first detection in nurseries (Frankel et al. 2018). In surveys conducted in the western states of California, Oregon, and Washington to estimate the prevalence of Phytophthora in native plant nurseries, over 20% of the nursery plant samples tested were positive for at least one Phytophthora species.
In previous work, our group demonstrated efficacy of volatile organic compound (VOC) measurements for detecting asymptomatic infections of P. ramorum in potted Rhododendron plants (McCartney et al. 2018). Because physiological stresses of many kinds can alter the volatile profile of a living system, it was hypothesized that the measured VOCs from infected and non-infected plants would be significantly different, even in the absence of symptoms. We had confirmed this concept in another plant genus, citrus, where the volatile profile of trees could be used to diagnose at least three citrus pathogens (Aksenov et al. 2014; Cheung et al. 2015; McCartney et al. 2016; Pasamontes et al. 2016). For P. ramorum infections in Rhododendron, this was found to be the case as well (McCartney et al. 2018). Headspace sorptive extraction (HSSE) of plant ambient volatiles, stir-bar sorptive extraction (SBSE) of metabolites from extracted leaf tissue, and solid-phase microextraction (SPME) of water runoff from plant roots were all performed and samples analyzed using gas chromatography-mass spectrometry (GC-MS). With all three methods, differences were found between the volatile profiles of infected and non-infected plants. However, this work was limited in that plants were grown in growth chambers and VOC measurements required use of branch enclosures, which did not represent nursery settings, where we hope this test would be applicable. In addition, we did not look at specificity to distinguish P. ramorum from other pathogens.
The work herein expands our previous work to address prior limitations. We perform our VOC test under containment in an experimental nursery setting to determine efficacy in the field. Headspace volatiles were measured without branch enclosures. This allowed us to test whether differences between healthy and infected plants persisted in the field with variable environmental factors and a less invasive sampling method. We also tested two additional pathogens under the rigidly controlled conditions of a growth chamber to assess specificity and capability of our analytical platform to detect different pathogens. The growth chamber study was performed under the same conditions as in our original study, and HSSE was performed using branch enclosures. The additional pathogens included in this experiment are Phytophthora cactorum and Rhizoctonia solani, two broad host-range pathogens capable of infecting roots and crowns of rhododendrons.
Materials and Methods
Plant and pathogens.
Rhododendron sp. cv. Cunningham’s White, a hybrid cultivar that is highly susceptible to P. ramorum, was selected as the experimental host plant as in prior studies (McCartney et al. 2018; Roubtsova and Bostock 2009). Plants were purchased from Monrovia Nursery Co. (Dayton, Oregon) and maintained in 3.8 L plastic pots in their original potting soil in a growth chamber (see below). Plants for use in the experimental nursery at the National Ornamental Research Site at Dominican University of California (NORS-DUC, San Rafael, CA) also were purchased from Monrovia Nursery, and delivered directly to the NORS-DUC nursery. Plants were confirmed to be free of plant pathogens and pests by visual inspection of aerial parts and by bait testing of soil runoff to check for Phytophthora spp.
Phytophthora ramorum isolate #1418886 from the California Department of Food and Agriculture (CDFA) collection, originally isolated from infected Camellia japonica leaves (Marin County, CA), was selected for use in experiments. In previous research, we found this isolate to be pathogenic on Rhododendron and to grow and sporulate well in culture. We also used Phytophthora cactorum isolate #P1679 from the collection of David Rizzo, which was originally isolated from toyon plants (San Jose, CA), and an isolate of Rhizoctonia solani from the Bostock lab collection.
Outdoor nursery study - Experimental design and inoculation procedure.
A trial was conducted at NORS-DUC ( 37°58’51.12” N, 122°31’04.20” W; EL 22.6 m), an outdoor nursery facility for conducting research under containment with P. ramorum and other high consequence, regulated pathogens of nursery plants. NORS-DUC was established in 2009 as a cooperative venture by the USDA APHIS, the CDFA, and the Dominican University of California. Rhododendron sp. cv. ‘Cunningham’s White’ plants (3.8 L pots) were maintained in the nursery and watered using natural precipitation from the initiation of the experiment on 24 January 2019. Plants were inoculated on 30 January, and the first sampling (“Week 1”) occurred on 7 February. On 11 April, drip irrigation was installed with a single emitter in each pot, and plants were then irrigated with municipal water at the site for five minutes every morning for the duration of the experiment, which was terminated on 13 September 2019. During this trial, the average temperature (high/low °C) was 22.6/10.1°C and ranged from 9.0 – 40.9°C for the daily high and 0.0 – 15.3°C for the daily low. Cumulative precipitation for the period was 412 mm, which occurred primarily (>99%) between 30 January and 21 May 2019. Temperature data were collected on-site at the NORS-DUC facility. Archived daily precipitation data (not available at NORS-DUC) were retrieved from the nearest University of California IPM weather station CIMIS #157 at Point San Pedro, San Rafael, CA (37°59’ N, 122°28’ W, EL 1.5 m; http://ipm.ucanr.edu), located approximately 4 km southeast from the NORS-DUC site.
Three treatments were used in the nursery trial: P. ramorum-inoculated, mock-inoculated control, and non-inoculated control. There were twelve plants per treatment, for a total of 36 plants. For inoculation, each mock-inoculated and P. ramorum-inoculated plant was carefully removed from its pot and transferred to a 4 L tub containing either DI water (mock-inoculated) or a tub amended with 5 × 10⁶ zoospores/tub of P.ramorum. Plants were carefully positioned such that only the roots were immersed to eliminate any potential contact of the leaves and to minimize immersion of the lower stems in the treatment solutions. All plants within a treatment were immersed together in the same tub. Non-inoculated controls were not immersed in any solutions and were segregated from the inoculation area. Twenty-four hours after initiation of the treatments, the plants were returned to their original pots. Plants were placed on standard plastic supports (122 cm x 102 cm), with six plants of the same treatment evenly distributed per support (approximately 15 cm apart), in the nursery in two containment blocks (3.6 m x 4.6 m), referred to as “Block A” and “Block B”, that were lined with an impermeable barrier to capture and disinfect runoff from the site. Each of the two blocks contained 3 plastic supports, one for non-inoculated controls, a second for mock-inoculated controls, and the third for P. ramorum-inoculated plants. Each support had 6 plants of the same treatment. There were 18 plants per block.
Growth chamber study - Experimental design and inoculation procedures.
For growth chamber studies, plants were transferred from the greenhouse to a chamber (Conviron PGR-15) set at 20°C, 70% relative humidity, with fluorescent and incandescent lights at 150 μmol m−2s−1 and 16 h day length. Plants were watered twice weekly with a 0.5x Hoagland’s nutrient solution (Hoagland and Arnon 1950). Plants were divided into five groups with three plants per group according to the following treatment assignments: (i) P. cactorum-inoculated; (ii) P. ramorum-inoculated; (iii) R. solani-inoculated; (iv) mock-inoculated control; and (v) non-inoculated control. The procedures for mock- and P. ramorum-inoculations were as described above, except a zoospore concentration of 5 × 10⁵ zoospores/tub was used for the P.cactorum group. Rhizoctonia solani inoculum was prepared by making a suspension of mycelium scraped from three 10-day-old PDA plate cultures in 100 ml sterile water with a blender. Mycelial suspensions were applied to plants as a soil drench (100 ml/pot). Twenty-four hours after initiation of the mock-inoculation and Phytophthora inoculation treatments, the plants were returned to their original pots, placed in new tubs for collecting runoff water, and returned to the growth chamber. This trial was conducted over a 44-week period, with placement of the plants in the growth chamber on 15 January 2019, inoculations occurring on 22 January, and final sampling occurring on 19 November 2019.
Confirmation of infection of plants.
At the end of each trial, all plants were sampled to evaluate root colonization by pathogens. Soil core samples were taken from each pot with a 2.54-cm-diameter stainless steel soil sampler that was surface sterilized with 70% ethanol between each sample. The core sampler was inserted approximately half the distance between the plant stem and pot edge and to the bottom of a pot. The soil cores containing roots were shaken and rinsed with tap water to remove soil particles. Root samples were treated with 0.6% NaOCl for 30 sec, rinsed in DI water, and sectioned with a razor blade. Twenty root pieces, each approximately 0.5 cm long, from each pot were plated on PARP-H (pimaricin-ampicillin-rifampicin-pentachloronitrobenzene-hymexazol) medium (selective for Phytophthora species, used in both nursery and growth chamber trials) (Jeffers and Martin 1986), and on acidified potato dextrose agar for determination of R. solani (growth chamber trial only). Plates were incubated for 7-10 days at room temperature (22-24°C) and observed for colony morphology and structures consistent with P. ramorum, P. cactorum, and R. solani to estimate pathogen colonization (i.e., percentage of root pieces infected).
Volatile collection and analyses
Two extraction formats for VOC collection were used in nursery and growth chamber trials. A minimally invasive ambient headspace sorptive extraction (HSSE) captured VOCs in the plant canopy in situ using polydimethylsiloxane (PDMS)-coated stir bars (Twisters®; Part 01222-001-00; Gerstel Inc., Linthicum, MD). The second method used in vivo stir bar sorptive extraction (SBSE), where Twisters® collect VOCs from leaf extracts in methanol. The SBSE method is a more labor-intensive process and unlikely to be useful for sampling in the field. However, SBSE generally measures more compounds in samples and provides a useful comparison to HSSE-collected VOC profiles for initial characterization of the system (McCartney et al. 2018).
Volatile measurements from ambient headspace in the nursery.
Plant VOCs in the nursery were collected without using branch enclosures. This was done in an effort to make the sampling process minimally invasive and as streamlined as possible to mimic a real-world application of our test. Two Twisters®, polydimethylsiloxane (PDMS)-coated stir bars that extract headspace volatiles, were placed in a stainless steel tea strainer (San Francisco Herb Co., San Francisco, California) to serve as a protective cage, which was then hung in the branches of a single plant for two hours.1 Block A mock and infected plants were clustered for VOC collection at each sampling event. This was accomplished by moving all Block A mock plants out of their potholders and onto the center of one Block A mock pallet, and all Block A infected plants onto the center of one Block A infected pallet. Prior to every sampling event, the tea strainers were conditioned in a vacuum oven at 80 °C for a minimum of four hours prior to every sampling event. After two hours, all Twisters® were collected in vials and stored at −20 °C pending GC-MS analysis. Ambient headspace measurements were done 1, 3, 5, 7, 9, 10, 13, 15, 17, 19 and 32 weeks after inoculation (wai).
Volatile measurements from plant enclosures in the growth chamber.
Headspace volatiles were collected using branch enclosures as previously used to isolate and concentrate each plant’s volatiles, an important step in the small space of the growth chamber (McCartney et al. 2018). Each enclosure had a flow of dry air (Part AI D300, Airgas USA, LLC, Woodland, California) with a needle valve-controlled flow rate into the bag of 1.3 L min−1 to maintain temperature & humidity levels. All tubing used was 6.35 mm outer diameter PTFE with Swagelok® brass fittings, and the compressed air was filtered via hydrocarbon trap (Part 22013, Restek Crop., Bellefonte, Pennsylvania).
Two Twisters® were placed inside stainless steel tea strainers. The tea strainers were hung in the branches of the plant being sampled before the entire plant or, later in the study, several branches marked with flagging tape for consistency, was enclosed in the PTFE bag (0.0635 mm x 610 mm x 305 mm, Part P-00021-2, Welch Fluorocarbon Inc., Dover, New Hampshire). The bag was secured and closed around the woody stem of the plant or, as plants became too large for the bags, around the base of selected branches marked with flagging tape, and the air inlet tube using zip ties. The transition from bagging the entire plant to bagging selected branches varied among the plants, as plants grew to exceed the bag dimensions at different times over the course of the trial. The last time point where all plants were in full enclosures was 15 weeks after infection. After a twenty-four hour sampling period (i.e., HSSE), the Twisters® were retrieved, placed in vials and stored at −20°C until GC-MS analysis. Bags and tea strainers were conditioned in a vacuum oven at 80 °C for a minimum of four hours after sampling to purge any potentially lingering volatiles. Growth chamber samples were collected at 1, 4, 5, 7, 9, 11, 13, 15, 17, 19, 21, 27, 29, 31, 33, 35, 37, 40 and 43 wai.
Volatile measurements from leaf extracts.
For both nursery and growth chamber experiments, leaves were collected for SBSE according to the same schedules as ambient headspace (HSSE) sampling. One mature leaf was collected, generally from mid-canopy, from each mock-inoculated and inoculated plant at each sampling event and placed in a plastic bag on ice. All leaves collected across treatments at each sampling event were healthy-appearing and of similar size. Intact leaves were transported on ice and stored whole in a −80 °C freezer before extraction in pure methanol, using a leaf material to methanol ratio of 1 g:10 mL, for 24 hours, as described in our previous study (McCartney et al. 2018). The methanol extract was then decanted and stored at −20 °C until analysis using a stir-bar sorptive extraction (SBSE) method.
For SBSE, the extract was diluted with water using a ratio of 17:83, extract:water. The water used was 18.2 Milli-Q (MΩ) deionized water, doped with 10 ppm naphthalene-d8 internal standard. A total volume of 1.5 mL was added to a vial with one Twister®. The Twister® was allowed to extract volatiles from this solution for 21 hours before being removed, rinsed with water, and placed in a clean vial for storage at −20 °C prior to GC-MS analysis.
GC-MS analysis of Twisters®.
All sample-containing Twisters® from HSSE and SBSE experiments were analyzed using the same method. Twisters® were thermally desorbed and injected to the GC by the Gerstel Thermal Desorption Unit (TDU) and cryo-cooled injection system (CIS). Sample introduction was performed by a Gerstel autosampler (Gerstel Inc., Linthicum, Maryland). For HSSE samples, a 1 μL aliquot of 10 ppm napthalene-d8 was desorbed alongside each Twister® as an internal standard. SBSE samples included the naphathalene-d8 in their extraction step. An Agilent 7890B GC and Agilent 5977A MS (Agilent Technologies Inc., Santa Clara, California) was used for chemical separation & detection. In addition to the internal standard, instrument performance was monitored by injection of an external control solution every ~40 sample injections.
For instrumental analysis, the CIS was used for sample concentration via cryogenic cooling, with an initial temperature of −80 °C and a final temperature of 300 °C, achieved with a 12 °C/sec ramp and held for 4 minutes. TDU sample desorption occurred at the final TDU temperature of 280 °C, which was rapidly attained from an initial temperature of 60 °C and sustained for 3 minutes. The samples were run using a constant flow method, with a flow rate through the 20 m x 0.18 mm x 18 μm DB-5MS column (Agilent Technologies Inc.) of 1.08 mL/min. The initial temperature was 60 °C, with an initial ramp rate of 4 °C/min to 150 °C and a second ramp rate of 25 °C/min to the final temperature of 300 °C, which was held for 3 minutes; total run time of 42.75 minutes. The mass spectrometer was run with a solvent delay of 6 minutes. Normal scanning was used, with a low mass of 44.5 m/z, a high mass of 350.0 m/z, and a threshold of 150. The ion source temperature was set to 230 °C, and the quadrupole was 150 °C.
Chemometric analysis.
GC-MS data were deconvoluted and aligned using Agilent’s MassHunter software platform, including Quantitative Analysis Version B.10 and Profinder Version B.08. Known artifacts, such as siloxanes from the Twister® sorbent or volatiles not of plant origin, were excluded. Data were normalized to the peak area of the internal standard from each sample. Statistical analyses were performed using MATLAB Version R2019b (MathWorks, Natick, Massachusetts) and PLS_Toolbox Version R8.8.1 (Eigenvector Research Inc., Manson, Washington).
Results and Discussion
In this study, we measured VOCs emitted from inoculated and non-inoculated Rhododendron plants in both nursery and growth chamber settings. In the nursery trial, we compared P. ramorum-infested and control plants using an ambient VOC headspace technique and through extraction of volatiles from leaf tissue. In the growth chamber, we compared effects of three pathogens – P. ramorum, P. cactorum, and R. solani – on VOC emissions collected within plant enclosures.
At the end of the nursery trial (34 wai), all of the Rhododendron plants among the three treatments were asymptomatic (N = 12 plants per treatment). Although all inoculated plants were infected by P. ramorum, the percentage of root pieces positive for the pathogen varied between plants, ranging from 15% to 60% of the root pieces, with an average percent recovery of 34.2 ± 4.6 % (mean ± SE). All mock-inoculated and non-inoculated control plants were free of contamination by P. ramorum.
At the end of the growth chamber trial (44 wai), shoot and leaf symptoms were absent from the Phytophthora-inoculated plants, although all inoculated and mock-inoculated plants showed slight stunting relative to the non-inoculated controls. The shoot of one non-inoculated control plant developed blight symptoms and was confirmed as infected by Phytophthora plurivora based on isolation in culture and ITS sequence analysis (Jung and Burgess 2009). Most likely, the infection was acquired at the nursery where plants were purchased. This plant was discarded and excluded from the analyses. All inoculated plants were positive for the pathogen used to inoculate them, and all non-inoculated and mock-inoculated control plants, except as noted above, were free of pathogen contamination (N = 3 plants per treatment). Within the inoculated treatments, root colonization rates varied between plants, ranging from 10-60% (P. ramorum, mean 43%), 10-20% (P. cactorum, mean 17%), and 35-70% (R. solani, mean 57%).
Predictions of P. ramorum in nursery plants
Our prior work employed partial least squares-discriminant analysis to make health predictions from plant samples (McCartney et al. 2018). In this study, we compared PLS-DA to other supervised statistical techniques to determine the best predictive model for our assay. Statistical analyses were performed on the nursery headspace samples using three different statistical tools: artificial neural network discriminant analysis (ANN-DA), extreme gradient boosting discriminant analysis (XGB-DA), and PLS-DA (Supplemental Fig. 1). Models were built for each of eleven sampled timepoints, measured by wai. Each model was built by randomly choosing 2/3 of each timepoint’s samples for calibration. The calibrated model was then used to predict the health status of the remaining 1/3 of samples, known as the validation set. Receiver operating characteristic (ROC) curves were generated for each model to describe its predictive accuracies for samples in the validation set. A ROC curve combines the specificity and sensitivity of the test. If the area under the curve is 1, predictions were 100% accurate; if the area under the curve is 0.5, the model’s predictions are indistinguishable from random guesses. A value of 0 indicates the model always predicted the opposite health status than actual status.
As shown in Supplemental Figure 1, the XGB-DA models had the highest average predictive accuracy of the three model types. The mean area under the curve (AUC) for XGB-DA ROC curves was 0.79, higher than that of ANN-DA ROCs and PLS-DA ROCs by 0.12 and 0.17, respectively. Therefore, XGB-DA models were selected for prediction of infection status from leaf extracts as well.
The predictive results for each extraction method are shown in Figure 1 and summarized in Table 1. Overall, predictions of infection status from ambient headspace VOCs were more accurate to discriminate infected and control plants than predictions from extracted volatiles. AUC values for headspace HSSE samples were 0.79 ± 0.17, greater than that of the extracted tissue, 0.51 ± 0.21 (Table 1). A two-sample t-test found these means to be significantly different (p = 0.003). Furthermore, at no time point was a perfectly accurate prediction made from leaf tissue, whereas the AUC for the HSSE curve equaled 1.00 at both weeks 3 and 9 after infection; the highest SBSE AUC, 0.80, was found at Week 19, essentially identical to the HSSE AUC of 0.79. Indeed, at only two timepoints—Weeks 5 and 10—were the predictions more accurate using SBSE, with Week 5 having an AUC larger by 0.11 and Week 10’s being 0.17 larger.
Figure 1.

Receiver operating characteristic (ROC) curves from XGB-DA validation sets to predict P. ramorum infections of rhododendrons in a nursery trial. Compared are results from ambient headspace measurements (HSSE) to volatiles extracted from leaf tissue (SBSE). Overall, more accurate predictions were made from ambient headspace. TPP: True positive proportion; TNP: true negative proportion.
Table 1:
Area under the curve (AUC) values for XGB-DA models in Figure 1.
| Week | Field, ambient headspace (HSSE) | Field, extracts (SBSE) |
|---|---|---|
| 1 | 0.67 | 0.33 |
| 3 | 1.00 | 0.40 |
| 5 | 0.60 | 0.71 |
| 7 | 0.61 | 0.33 |
| 9 | 1.00 | 0.20 |
| 10 | 0.50 | 0.67 |
| 13 | 0.87 | 0.33 |
| 15 | 0.78 | 0.67 |
| 17 | 0.97 | 0.38 |
| 19 | 0.79 | 0.80 |
| 32 | 0.89 | 0.75 |
| Mean (Standard Deviation) | 0.79 (0.17) * | 0.51 (0.21) * |
Significantly different (p=0.003)
This result was unanticipated but still promising for possible future deployment of a VOC-test in a nursery setting. The raw GC-MS signal was much higher in extracted leaf tissue than in ambient headspace samples, which might lead to an expectation that leaf tissue may result in stronger predictive models. Even in other analyses, however, as will be shown, this signal strength advantage did not translate into increased predictive sensitivity or specificity of the tests. The success of the HSSE analysis is hopeful because one important goal of the NORS-DUC trial was to attempt to find a minimally invasive test that could easily be deployed in commercial nurseries that still yielded useful predictions. The comparison of HSSE with SBSE shows that the efficacy of testing was not impaired by lack of signal concentration introduced by a shortened sampling time and absence of headspace enclosures.
Model accuracies from both headspace and tissue extract techniques wavered throughout the course of this experiment. For ambient volatile measurements, area under the curve values ranged from a perfect score of 1 to 0.5; extracted leaf tissue had a range of 0.8 to 0.2. We hypothesize that biotic and abiotic factors have confounding effects on Rhododendron volatile emissions used to predict P. ramorum infections, in addition to changes during the course of infection as the pathogen progresses in the host plant. Samples were collected over a period of nearly 8 months. During the course of this extended period, we would expect developmental and seasonal cycling in the physiology of the plants and in pathogen activity to influence volatile emissions. Noteworthy is that the sampling conducted at the NORS-DUC facility during Weeks 1-10 occurred during the coolest and wettest period of the outdoor trial (Supplemental Fig. 2). During this period several sample sets (Weeks 1, 5, 7 and 10) had ROC curves with the lowest AUC values for XGB-DA models, and thus lower predictive strength, for ambient headspace samples compared to the other weeks (Fig. 1, Table 1). The reason for this is unresolved, but could be due to a weaker VOC signal during establishment of infections and the cooler, wetter conditions that would be expected to suppress plant VOC emissions (Gouinguené and Turlings 2002).
Comparison of P. ramorum diagnostics in nursery and growth chamber plants
We wanted to compare the overall differences in the volatile profile of P. ramorum-infected and control plants in our three experimental settings: field ambient headspace samples, field extracts, and growth chamber enclosure headspace. PLS-DA models were built for each experimental setting at each timepoint, and we compared the 1st latent variable (LV1) scores (Fig. 2). Latent variables are used to reduce data dimensionality; in this case, they represent a combination of volatile compounds that the PLS-DA models determined to best explain differences between infected and control samples. For each experiment and timepoint, we subtracted the mean LV1 score for mock-inoculated plants from the mean of P. ramorum-infected plants (Fig. 2). Inferences can be made from the magnitude of the difference. Overall, there was a much greater LV1 difference from enclosed plants than in either field headspace or field extracts. This is likely due to the enclosures, which greatly concentrate ambient volatile emissions. With a more robust VOC signal, enclosure samples result in LV1 scores with a larger difference among treatments. Nonetheless, Figure 1 demonstrates that in an outdoor nursery setting, where VOC samples were collected without enclosing the plants, the VOC signal was still sufficient to discern infected from healthy plants. Nursery plants are likely experiencing a higher degree of abiotic and biotic stressors in addition to P. ramorum infection compared to plants in growth chambers. Additional stressors could have diminished the volatile response to infection.
Figure 2.

Comparison of chemical signal differences in field ambient headspace samples (HSSE), field leaf extract samples (SBSE) and enclosed headspace samples from growth chamber plants using the 1st Latent Variable (LV1) from PLS-DA models.
Whatever the reason for the disparity in the size of the difference between growth environments, all three sampling methods show definite differences between mock-inoculated and infected plants at each time point. This provides further confirmation that plants infected with P. ramorum, at least, have measurably different volatile profiles than healthy plants, both when sampled using headspace volatiles or volatiles extracted from tissue, and when measuring the profiles of plants in the field and the growth chamber.
Growth chamber: comparison of three root pathogens
Another goal of this study was to determine whether a VOC test was specific to P. ramorum. To that end, growth chamber plants included infections by P. ramorum, P. cactorum and R. solani, and we monitored the volatile profiles of these plants over the time course of infection. T-tests were conducted to compare the abundance of each volatile compound to mock-infected plants at each sampled timepoint. A total of 45 compounds had at least one significant difference between one pathogen and control plants in at least one timepoint, which are identified in Table 2.
Table 2:
The names, CAS registry numbers, and Kovats Retention Indices (KI) of the 45 compounds shown in Figure 3. Seventeen of these compounds were also found in the previous study. Of those seventeen, five (indicated with asterisks) were significantly different, as determined by T-tests (p ≤ 0.05) on the abundance of those compounds in infected plants compared to their abundance in mock-inoculated plants at the same timepoint. All compounds except for #15 were significant in at least one time point for P. ramorum (PR), all except #2 were significant for P. cactorum (PC), and nos. 15, 28, 30, 36, 42, and 44 were not significant at any timepoint for R. solani (RS).
| Num. | Name | CAS # | KI | Significance in which pathogen | Prev. found |
|---|---|---|---|---|---|
| 1 | α-pinene | 80-56-8 | 927 | PR, PC, RS | yes |
| 2 | unknown 1 | PR, RS | |||
| 3 | α-phellandrene | 99-83-2 | 985 | PR, PC, RS | |
| 4 | β-pinene | 127-91-3 | 975 | PR, PC, RS | |
| 5 | β-myrcene | 123-35-3 | 986 | PR, PC, RS | yes |
| 6 | 3-hexenyl methanoate | 3681-71-8 | 1005 | PR, PC, RS | yes |
| 7 | sylvestrene | 1461-27-4 | 1027 | PR, PC, RS | |
| 8 | eucalyptol | 470-82-6 | 1029 | PR, PC, RS | yes |
| 9 | 1,2-oxolinalool | PR, PC, RS | |||
| 10 | unknown 2 | PR, PC, RS | |||
| 11 | unknown 3 | PR, PC, RS | |||
| 12 | unknown 4 | PR, PC, RS | |||
| 13 | geranyl vinyl ether | PR, PC, RS | |||
| 14 | methyl salicylate | 119-36-8 | 1186 | PR, PC, RS | yes |
| 15 | unknown 5 | PC | |||
| 16 | copaene | 3856-25-5 | 1372 | PR, PC, RS | |
| 17 | α-cubebene | 17699-14-8 | 1341 | PR, PC, RS | yes |
| 18 | aristolene | 6831-16-9 | 1486 | PR, PC, RS | |
| 19 | caryophyllene* | 87-44-5 | 1411 | PR, PC, RS | yes |
| 20 | β-gurjunene * | 17334-55-3 | 1420 | PR, PC, RS | yes |
| 21 | aromadendrene | 109119-91-7 | 1436 | PR, PC, RS | |
| 22 | selina-3,7(11)-diene | 6813-21-4 | 1532 | PR, PC, RS | yes |
| 23 | humulene | 6753-98-6 | 1446 | PR, PC, RS | yes |
| 24 | γ-muurolene * | 30021-74-0 | 1466 | PR, PC, RS | yes |
| 25 | β-cubebene | 13744-15-5 | 1390 | PR, PC, RS | |
| 26 | γ-selinene | 515-17-3 | 1470 | PR, PC, RS | |
| 27 | α-selinene * | 473-13-2 | 1487 | PR, PC, RS | yes |
| 28 | unknown 6 | PR, PC | |||
| 29 | α-muurolene | 30021-74-0 | 1508 | PR, PC, RS | yes |
| 30 | β-selinene * | 17066-67-0 | 1480 | PR, PC | yes |
| 31 | α-farnesene | 502-61-4 | 1500 | PR, PC, RS | yes |
| 32 | unknown 7 | PR, PC, RS | |||
| 33 | unknown 8 | PR, PC, RS | |||
| 34 | unknown 9 | PR, PC, RS | |||
| 35 | α-elemene | 5951-67-7 | 1424 | PR, PC, RS | yes |
| 36 | dodecyl acrylate | 2156-97-0 | PR, PC | ||
| 37 | unknown 10 | PR, PC, RS | |||
| 38 | benzene, (1-pentylheptyl)- | 2719-62-2 | 1725 | PR, PC, RS | |
| 39 | unknown 11 | PR, PC, RS | |||
| 40 | stachene | 3564-54-3 | 1962 | PR, PC, RS | |
| 41 | myristic acid | 544-63-8 | 1765 | PR, PC, RS | |
| 42 | ethyl palmitate | 628-97-7 | 1975 | PR, PC | |
| 43 | unknown 12 | PR, PC, RS | |||
| 44 | oleic acid | 112-80-1 | 2125 | PR, PC | yes |
| 45 | stearic acid | 57-11-4 | 2170 | PR, PC, RS |
Figure 3 shows a direct comparison between the normalized peak areas in mock-inoculated and infected plants for the 45 compounds at each time point. Each column represents a single VOC, and each row represents the sampled timepoints. If the abundance of the VOC at a given timepoint was not significantly different relative to mock-inoculated plants, the cell in the figure corresponding to that VOC at that timepoint was shaded grey. Non-grey cells indicate that the VOC had a significant difference between pathogen-infected and mock-inoculated control plants. The color indicates the relative change in abundance caused by infection, presented in Equation 1. A positive value indicates that the VOC abundance was 2 times higher in infected plants; a negative value was 2 times lower in infected plants, relative to mock-inoculated. This normalization to mock-inoculated plants serves to control for changes in the plant’s volatile profile that did not originate from the pathogen, such as seasonal changes or due to the plants’ growth.
Figure 3:
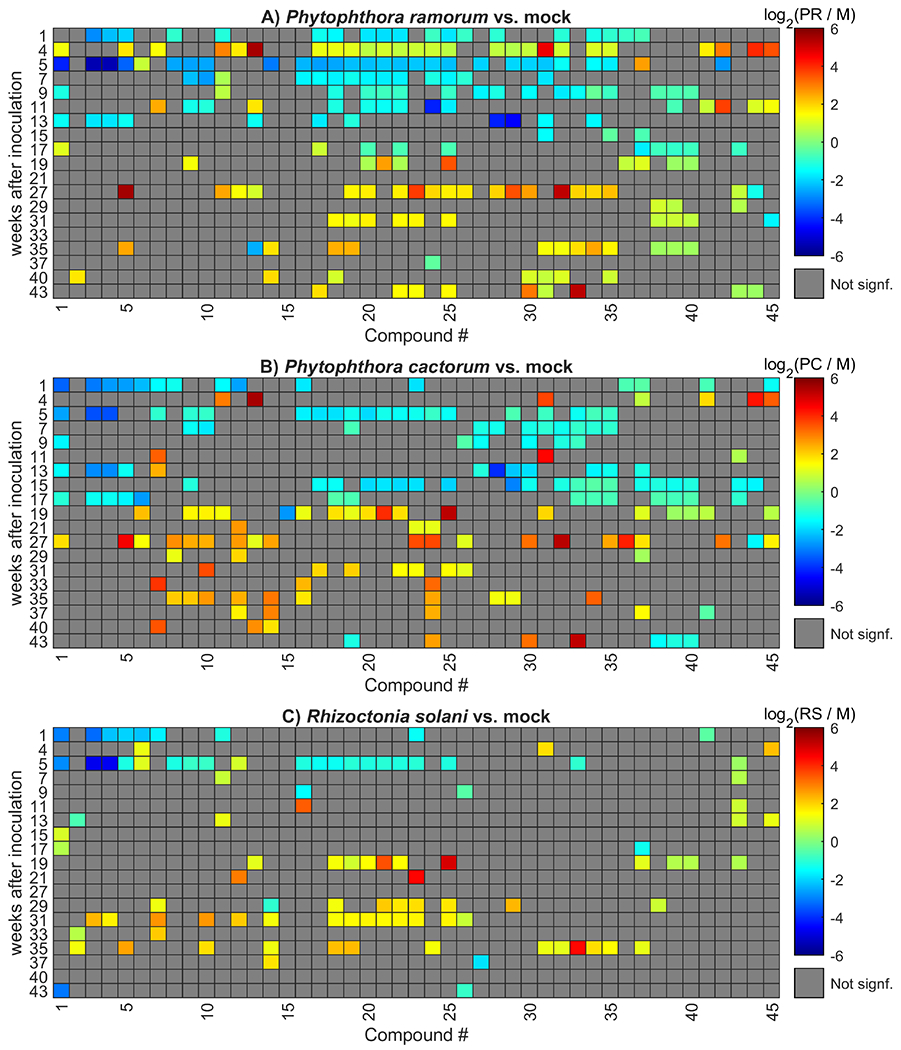
Heatmap of the log2 of the ratio of each compound’s peak area to the average peak area of the mock samples for each time point. Normalization to the average mock peak area for each time point is used as an external control. Blue tones indicate downregulation of compounds in infected plants, and red tones indicate upregulation. Compounds are identified in Table 2.
| (1) |
In all pathogen-inoculated plants, the trend in early stages of infection is toward downregulation of most compounds, followed by a switch to upregulation at later timepoints. For infections by both Phytophthora species, the trend reverses at approximately the 17-week mark. Further, the P. ramorum-infected plants showed significant differences across the most compounds, with P. cactorum-infected showing the second most. R. solani-infected plants change from clear downregulation to a period of relative neutrality at around the five-week mark, with fewer significant differences observed until approximately 17-19 weeks, at which point the same trend is observed as in the two Phytophthora heat maps.
The forty-five compounds identified as significant for tracking these differences are listed in Table 2. Of that number, seventeen were identified in our previous work’s volatile profile of healthy and P. ramorum-inoculated plants in the growth chamber, collected both using headspace and liquid extraction (McCartney et al. 2018). Five of the seventeen compounds were found to be significantly different in the original liquid extraction experiment, while none of them were found significantly different using headspace. In that study, the reference table of the volatile compounds with significant changes from infection was made from samples collected only at 17 weeks after inoculation. At this time point, in our current work, we observed a switch in the trend from down-regulation of significant compounds to up-regulation.
Generally, many of the VOCs listed in Table 2 were significantly impacted by all three pathogens in at least one time point. These overlapping VOCs may indicate general plant stress responses, rather than be specific responses to a given pathogen. However, there were instances where a rhododendron VOC was only significantly up- or down-regulated by one or two pathogen treatments. In the samples from plants infected with each Phytophthora species, all compounds except one were found to be significantly different in at least one timepoint. For P. ramorum, the exception was compound 15 (unknown 5 in Table 2); for P. cactorum, it was compound 2 (unknown 1). Rhizoctonia solani-inoculated plants were found to have no significant differences in six compounds. Only one of the six overlapped with another experimental group: unknown 5 was not found significant in either R. solani- or P. ramorum-inoculated plants. Unknown 5 was therefore only significant in the P. cactorum group. All compounds, both significant and nonsignificant, found in the volatile profile of P. ramorum-infected rhododendrons in our previous study were found to be significant in the profile of the P. ramorum-infected plants in this study. The same is true for plants infected with P. cactorum. β-selinene and oleic acid were the only two compounds that were found in the previous work that were not found in one of the experimental groups in this study—neither was significant in R. solani-infected plants. Neither β-selinene nor oleic acid was significant in the previous study.
Paired comparisons between the different plant-pathogen combinations revealed differences in VOC profiles (Supplemental Fig. 3). Both Phytophthora species infections showed downregulation overall when compared to R. solani, although less so in later than in earlier weeks, a trend that appeared similar to those observed in comparisons to mock-inoculated plants (Fig. 3). There were more differences observed between the two Phytophthora species than had been anticipated, with approximately half of the compounds consistently downregulated in P. cactorum compared to P. ramorum, and the other half consistently upregulated. Around week 17, where the down- to up-regulation switch was observed (Fig. 3), there was consistent downregulation in P. cactorum vis à vis P. ramorum.
PLS-DA was used to visualize differences among the VOC profiles of growth chamber rhododendron plants. At each time point, the degree of separation among the five experimental groups varied, as did the LV along which they were separated (Fig. 4). The LV plots show that at 4 weeks after inoculation, there was a strong volatile difference between the two Phytophthora species and control plants, with R. solani-inoculated samples falling somewhere in between. However, this trend did not hold consistently. Some weeks, for example week 5, showed the largest difference between mock-inoculated plants and all other groups. Some weeks had samples from the same experimental group that separated most widely, as in the mock-inoculated samples of week 13 and the P. ramorum-infected samples of week 15. Partial clustering of unexpected experimental treatment groups occurred, as in the mock, R. solani, and P. cactorum samples in week 7. In some weeks, especially in week 13, no one experimental group strongly clustered together with itself and away from other groups. In week 9, the clearest separation was between P. cactorum and P. ramorum along LV 2; these two groups had generally trended toward clustering more closely. Weeks 5, 7, 9, 13, and 15 were predominantly in contravention of the trends observed in the rest of the dataset.
Figure 4:
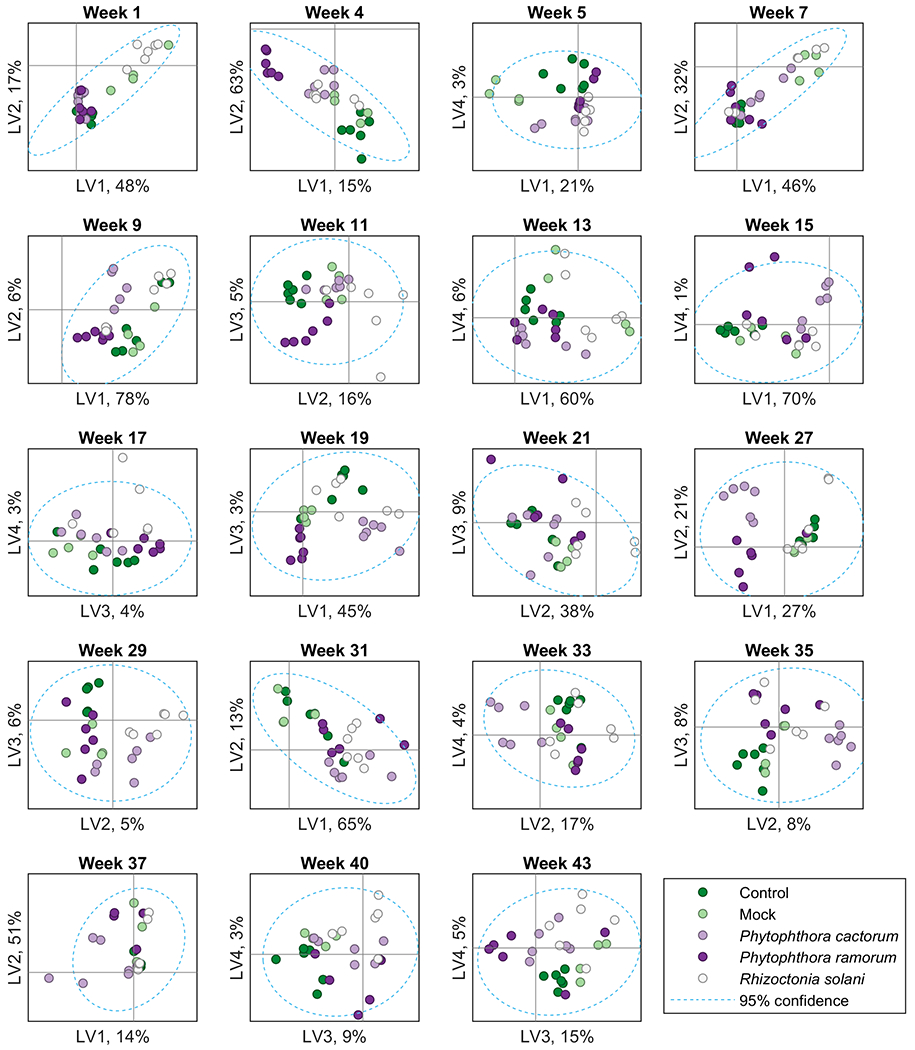
PLS-DA latent variable (LV) plots for growth chamber, enclosed plants at the sampled weeks after infection.
Overall, we observed several interesting phenomena given that infections by all three of the pathogens were asymptomatic during the course of the experiment. With respect to VOC profiling, plants infected with Phytophthora species showed a slight tendency to cluster together in most cases, and the two control groups and R. solani-infected plants tended to cluster together. The former tendency is not unexpected in that infection strategies by different Phytophthora species can be similar. The tendency of clustering of R. solani and the control groups could be due to this pathogen being less damaging to Rhododendron than the Phytophthora species under our experimental conditions, in spite of its apparent ability to colonize roots. At 19 wai, these trends were clearer, and at 27 wai, the clustering among the treatment sets were clearest of all. Although at 21 wai there was almost no separation, at 27 weeks there was clear separation between Phytophthora-infected plants and the other three groups along LV 2, which represented 26.8% of the variables. Further, there was some separation between P. cactorum and P. ramorum along LV 1, representing 29.2% of the data. The clarity of separation among the experimental groups decreased again after 27 wai, with more randomness being observed throughout the plots; the reasons for loss in clarity of separation are uncertain.
Conclusions and future research
Our group’s original study laid groundwork for VOC testing to detect asymptomatic infections by P. ramorum in Rhododendron (McCartney et al. 2018). In this study, the method was tested in an outdoor nursery and in a growth chamber with additional pathogens. We found measurable differences in volatiles from mock-inoculated (healthy) and P. ramorum-infected plants in the field by sampling both from non-enclosed headspace and by performing stir-bar sorptive extraction on collected leaf tissue. Measurable differences in VOC profiles between healthy plants and plants infected with P. cactorum and R. solani were detectable in a growth chamber study.
We found that these three pathogens did not consistently impact one or two plant VOCs over time. Instead, each infestation had up- and down-regulating effects on a varying number of plant VOCs throughout the time course of infection. A similar observation has been made in our studies of citrus diseases, where not one or two VOCs are enough for diagnosis, but rather, machine learning and higher statistical models consider the relative abundance of dozens of plant VOCs to make a health status prediction (Aksenov et al. 2014; Cheung et al. 2015; McCartney et al. 2016; Pasamontes et al. 2016). These models are trained with the inconsistencies that a pathogen has on the plant volatile profile over time. As a result, models can then be used to predict how long a plant has been infected, or even predict the severity of disease with high levels of accuracy.
These results are encouraging and will inform the design of future tests to assess VOC profiling as a diagnostic tool for asymptomatic infections in nursery plants. Future work will continue examination of infection-induced host signatures, but also determine if pathogen-generated VOCs can be detected. Longitudinal sampling in greenhouse and outdoor nursery trials conducted over extended periods can capture extensive datasets that incorporate the impact of expected abiotic and biotic variations (e.g., season, weather, pathogens) on VOC landscapes. With the intentional inclusion of as much biochemical noise as possible, robust statistical models can be built that make accurate health predictions despite variability from other sources in a particular sample.
Supplementary Material
Supplemental Figure 1: Three modeling techniques were compared for their ability to predict P. ramorum infections on nursery rhododendrons: artificial neural network-discriminant analysis (ANN-DA), partial least squares-discriminant analysis (PLS-DA) and extreme gradient boosting-discriminant analysis (XGB-DA). By comparison of the area under the curve (AUC) values of these receiver operating characteristic (ROC) curves, XGB-DA on average yielded the highest accuracy.
Supplemental Figure 2: Daily maximum and minimum temperatures and precipitation during the course of the trial at the NORS-DUC outdoor nursery facility. Plants were inoculated on 31 January and the first VOC sampling occurred on 7 February (2/7/2019; “Week 1”).
Supplemental Figure 3: Comparison of VOC differences caused by each pathogen on rhododendrons in a growth chamber. Compounds are identified in Table 2.
Acknowledgements
This research was supported by the USDA-APHIS Cooperative Agreement award #AP18PPQS&T00C172 [RMB], and was partially supported by NIH award U01 EB0220003-01 [CED]; the NIH National Center for Advancing Translational Sciences (NCATS) through grant UL1 TR000002 [CED]; NIH award 1P30ES023513-01A1 [CED]; NIH award UG3-OD023365 [CED]. The authors thank the NORS-DUC team of Wolfgang Schweigkofler, Vernon Huffman, and Karen Suslow for their advice and assistance during the course of this study, and to Susana Calderon (UC Davis) for technical support and Megan Siefker (UC Davis) for assistance in summarizing the weather data.
Abbreviations:
- ANN-DA
artificial neural network discriminant analysis
- AUC
area under the curve
- GC-MS
gas chromatography-mass spectrometry
- HSSE
head-space sorptive extraction
- LV
latent variable
- PLS-DA
partial least squares discriminant analysis
- PTFE
polytetrafluoroethylene
- ROC
receiver operating characteristic
- SBSE
stir-bar sorptive extraction
- SOD
sudden oak death
- SPME
solid-phase microextraction
- VOC
volatile organic compound
- wai
weeks after inoculation
- XGB-DA
extreme gradient boosting discriminant analysis
Footnotes
Head-space sorptive extraction, HSSE
References
- Aksenov AA, Pasamontes A, Peirano DJ, Zhao W, Dandekar AM, Fiehn O, Ehsani R, and Davis CE 2014. Detection of Huanglongbing disease using differential mobility spectrometry. Anal. Chem 86:2481–2488. [DOI] [PubMed] [Google Scholar]
- Bienapfl J, and Balci Y 2014. Movement of Phytophthora spp. in Maryland’s nursery trade. Plant Dis. 98:134–144. [DOI] [PubMed] [Google Scholar]
- Chastagner G, Elliott M, and Shishkoff N 2013. NORS-DUC FY 2012-13 Final Report: Risk of root-to-root spread of Phytophthora ramorum in ornamental production nurseries. Pages 40–47. [Google Scholar]
- Chastagner GA, Oak S, Omdal D, Ramsey-Kroll A, Coats K, Valachovic Y, Lee C, Hwang J, Jeffers S, and Elliott M 2010. Spread of P. ramorum from nurseries into waterways—implications for pathogen establishment in new areas. in: Frankel Susan J.; Kliejunas John T.; Palmieri Katharine M., tech. coords. 2010. Proceedings of the Sudden Oak Death Fourth Science Symposium. Gen. Tech. Rep. PSW-GTR-229. Albany, CA: US Department of Agriculture, Forest Service, Pacific Southwest Research Station. pp. 22–26. [Google Scholar]
- Cheung WH, Pasamontes A, Peirano DJ, Zhao W, Grafton-Cardwell EE, Kapaun T, Yokomi RK, Simmons J, Doll M, and Fiehn O 2015. Volatile organic compound (VOC) profiling of citrus tristeza virus infection in sweet orange citrus varietals using thermal desorption gas chromatography time of flight mass spectrometry (TD-GC/TOF-MS). Metabolomics 11:1514–1525. [Google Scholar]
- Cunniffe N, Cobb R, Meentemeyer R, Rizzo D, and Gilligan C 2016. Modeling when, where, and how to manage a forest epidemic, motivated by sudden oak death in California. Proc. Natl. Acad. Sci. USA 113:201602153. [DOI] [PMC free article] [PubMed] [Google Scholar]
- Frankel SJ, Alexander JM, Benner D, and Shor A 2018. Coordinated response to inadvertent introduction of pathogens to California restoration areas. . Calif. Agric 72:205–207. [Google Scholar]
- Garbelotto M, Frankel S, and Scanu B 2018. Soil-and waterborne Phytophthora species linked to recent outbreaks in Northern California restoration sites. Calif. Agric 72:208–216. [Google Scholar]
- Gouinguené SP, and Turlings TCJ 2002. The effects of abiotic factors on induced volatile emissions in corn plants. Plant Physiol. 129:1296–1307. [DOI] [PMC free article] [PubMed] [Google Scholar]
- Grünwald NJ, Goss EM, and Press CM 2008. Phytophthora ramorum: a pathogen with a remarkably wide host range causing sudden oak death on oaks and ramorum blight on woody ornamentals. Mol. Plant Pathol 9:729–740. [DOI] [PMC free article] [PubMed] [Google Scholar]
- Hansen EM, Reeser PW, and Sutton W 2012. Phytophthora beyond agriculture. Annu. Rev. Phytopathol 50:359–378. [DOI] [PubMed] [Google Scholar]
- Hoagland DR, and Arnon DI 1950. The water-culture method for growing plants without soil. Circular. California Agricultural Experiment Station 347. [Google Scholar]
- Jeffers S, and Martin S 1986. Comparison of two media selective for Phytophthora and Pythium species. Plant Dis. 70:1038–1043. [Google Scholar]
- Jung T, and Burgess T 2009. Re-evaluation of Phytophthora citricola isolates from multiple woody hosts in Europe and North America reveals a new species, Phytophthora plurivora sp. nov. Persoonia 22:95. [DOI] [PMC free article] [PubMed] [Google Scholar]
- Jung T, Orlikowski L, Henricot B, Abad-Campos P, Aday A, Aguín Casal O, Bakonyi J, Cacciola S, Cech T, and Chavarriaga D 2016. Widespread Phytophthora infestations in European nurseries put forest, semi-natural and horticultural ecosystems at high risk of Phytophthora diseases. For. Pathol 46:134–163. [Google Scholar]
- Junker C, Goff P, Wagner S, and Werres S 2016. Occurrence of Phytophthora species in commercial nursery production. Plant Health Progress 17:64–75. [Google Scholar]
- Liebhold AM, Brockerhoff EG, Garrett LJ, Parke JL, and Britton KO 2012. Live plant imports: the major pathway for forest insect and pathogen invasions of the US. Front. Ecol. Environ 10:135–143. [Google Scholar]
- McCartney MM, Roubtsova TV, Yamaguchi MS, Kasuga T, Ebeler SE, Davis CE, and Bostock RM 2018. Effects of Phytophthora ramorum on volatile organic compound emissions of Rhododendron using gas chromatography–mass spectrometry. Anal. Bioanal. Chem 410:1475–1487. [DOI] [PubMed] [Google Scholar]
- McCartney MM, Spitulski SL, Pasamontes A, Peirano DJ, Schirle MJ, Cumeras R, Simmons JD, Ware JL, Brown JF, and Poh AJ 2016. Coupling a branch enclosure with differential mobility spectrometry to isolate and measure plant volatiles in contained greenhouse settings. Talanta 146:148–154. [DOI] [PubMed] [Google Scholar]
- Parke JL, Knaus BJ, Fieland VJ, Lewis C, and Grünwald NJ 2014. Phytophthora community structure analyses in Oregon nurseries inform systems approaches to disease management. Phytopathology 104:1052–1062. [DOI] [PubMed] [Google Scholar]
- Pasamontes A, Cheung WH, Simmons J, Aksenov AA, Peirano DJ, Grafton-Cardwell EE, Kapaun T, Dandekar AM, Fiehn O, and Davis CE 2016. Citrus tristeza virus infection in sweet orange trees and a mandarin× tangor cross alters low molecular weight metabolites assessed using gas chromatography mass spectrometry (GC/MS). Metabolomics 12:41. [Google Scholar]
- Rizzo DM, Garbelotto M, and Hansen EM 2005. Phytophthora ramorum: integrative research and management of an emerging pathogen in California and Oregon forests. Annu. Rev. Phytopathol 43:309–335. [DOI] [PubMed] [Google Scholar]
- Rizzo DM, Garbelotto M, Davidson JM, Slaughter GW, and Koike ST 2002. Phytophthora ramorum as the cause of extensive mortality of Quercus spp. and Lithocarpus densiflorus in California. Plant Dis. 86:205–214. [DOI] [PubMed] [Google Scholar]
- Roubtsova TV, and Bostock RM 2009. Episodic abiotic stress as a potential contributing factor to onset and severity of disease caused by Phytophthora ramorum in Rhododendron and Viburnum. Plant Dis. 93:912–918. [DOI] [PubMed] [Google Scholar]
- Shishkoff N 2007. Persistence of Phytophthora ramorum in soil mix and roots of nursery ornamentals. Plant Dis. 91:1245–1249. [DOI] [PubMed] [Google Scholar]
- USDA-APHIS. 2020. APHIS List of Regulated Hosts and Plants Proven or Associated with Phytophthora ramorum. Pages 1–6, APHIS, ed. [Google Scholar]
- Venette RC, and Cohen SD 2006. Potential climatic suitability for establishment of Phytophthora ramorum within the contiguous United States. For. Ecol. Manage 231:18–26. [Google Scholar]
- Vercauteren A, Riedel M, Maes M, Werres S, and Heungens K 2013. Survival of Phytophthora ramorum in Rhododendron root balls and in rootless substrates. Plant Pathol. 62:166–176. [Google Scholar]
- Vettraino A, Sukno S, Vannini A, and Garbelotto M 2010. Diagnostic sensitivity and specificity of different methods used by two laboratories for the detection of Phytophthora ramorum on multiple natural hosts. Plant Pathol. 59:289–300. [Google Scholar]
- Werres S, Marwitz R, De Cock AW, Bonants PJ, De Weerdt M, Themann K, Ilieva E, and Baayen RP 2001. Phytophthora ramorum sp. nov., a new pathogen on Rhododendron and Viburnum. Mycol. Res 105:1155–1165. [Google Scholar]
Associated Data
This section collects any data citations, data availability statements, or supplementary materials included in this article.
Supplementary Materials
Supplemental Figure 1: Three modeling techniques were compared for their ability to predict P. ramorum infections on nursery rhododendrons: artificial neural network-discriminant analysis (ANN-DA), partial least squares-discriminant analysis (PLS-DA) and extreme gradient boosting-discriminant analysis (XGB-DA). By comparison of the area under the curve (AUC) values of these receiver operating characteristic (ROC) curves, XGB-DA on average yielded the highest accuracy.
Supplemental Figure 2: Daily maximum and minimum temperatures and precipitation during the course of the trial at the NORS-DUC outdoor nursery facility. Plants were inoculated on 31 January and the first VOC sampling occurred on 7 February (2/7/2019; “Week 1”).
Supplemental Figure 3: Comparison of VOC differences caused by each pathogen on rhododendrons in a growth chamber. Compounds are identified in Table 2.