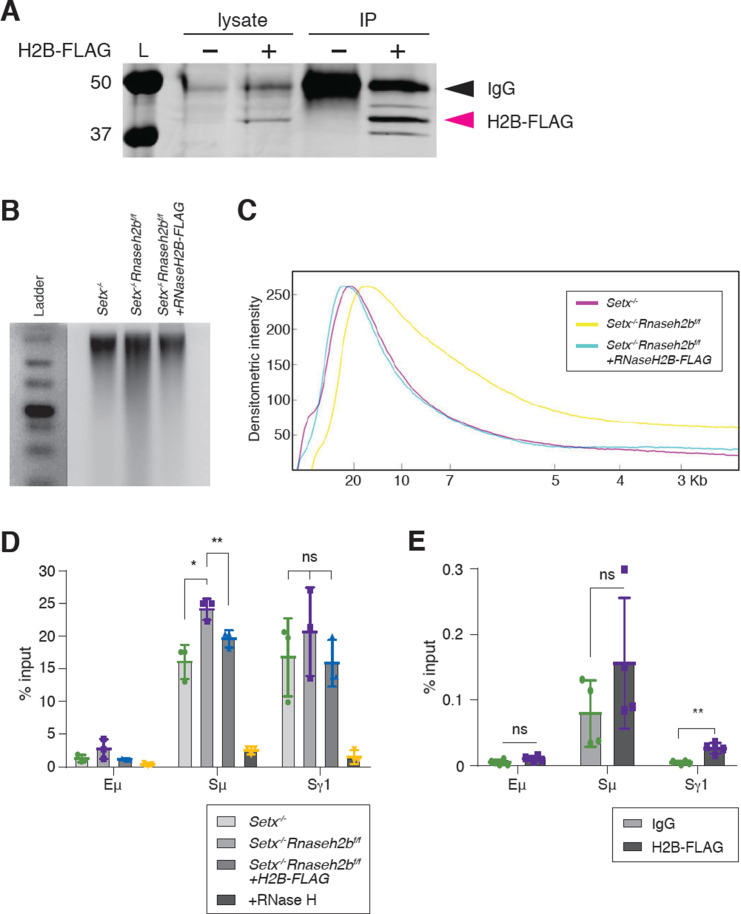
Figure 4. RNase H2 activity rescues DNA:RNA hybrid levels in stimulated B cells.
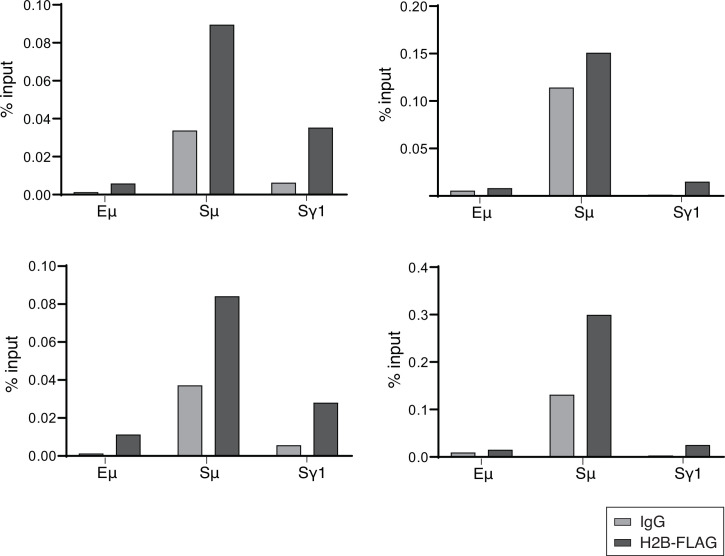
(A) Total cell lysates were extracted from Setx-/-Rnaseh2bf/f cells stimulated for 96 hr with LPS/IL-4/α-RP105. Cells were infected with empty vector or retrovirus, expressing FLAG-RNaseH2B, then subjected to immunoprecipitation and immunoblotting with indicated antibodies. (B) Representative image of alkaline gel from Setx-/-, Setx-/-Rnaseh2bf/f EV, and Setx-/-Rnaseh2bf/f+FLAG-RNaseH2B cells (n = 3 independent mice/genotype). (C) Densitometry trace of representative alkaline gel in (B). (D) DNA:RNA hybrid immunoprecipitation (DRIP) assay was performed with S9.6 antibody on Setx-/-, Setx-/-Rnaseh2bf/f, and Setx-/-Rnaseh2bf/f+FLAG-RNaseH2B-expressing cells stimulated with LPS/IL-4/α-RP105 for 96 hr. RNase H treatment of Setx-/-Rnaseh2bf/f sample was a negative control. Relative enrichment was calculated as chromatin immunoprecipitation (ChIP)/input, and the results were replicated in three independent experiments. Error bars show standard deviation; statistical analysis was performed using one-way ANOVA. (E) ChIP analysis for FLAG-RNaseH2B occupancy in Eμ, Sμ, and Sγ regions of primary B cells in response to LPS/IL-4/α-RP105 stimulation. Relative enrichment was calculated as ChIP/input. Error bars show standard deviation. Statistical analysis was performed using Student’s t-test (n = 3 mice/genotype).


