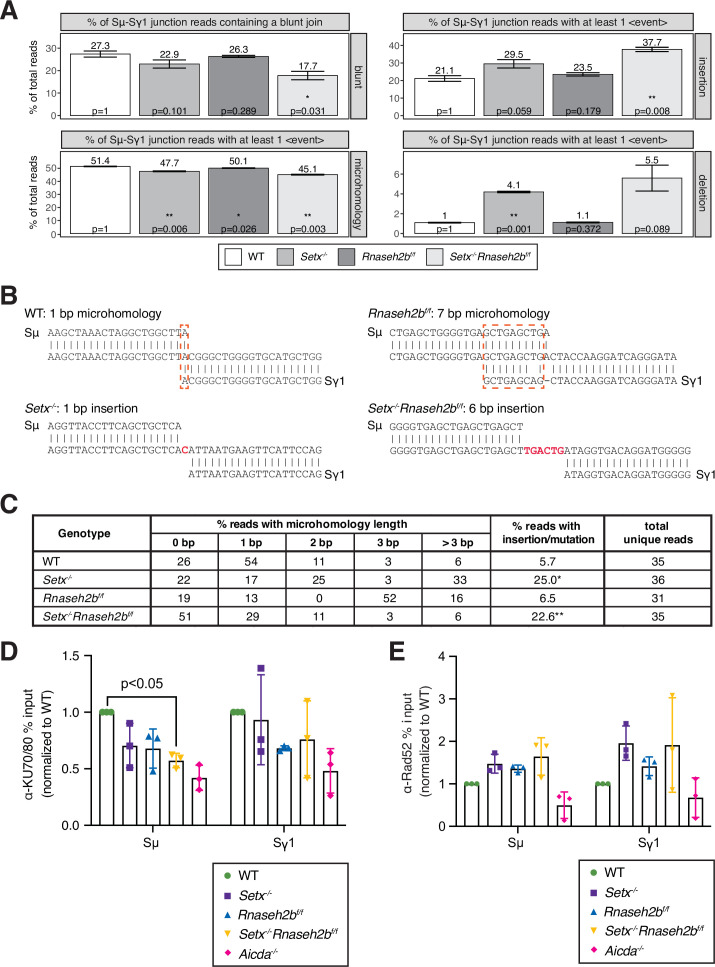
Figure 6. Altered switch junctions in in Setx-/-, Rnaseh2bf/f, and Setx-/-Rnaseh2bf/f B cells.
(A) Linear amplification-mediated high-throughput genome-wide translocation sequencing (LAM-HTGTS) analysis showing the percentage of sequenced junction events harboring blunt joins, microhomology (MH) use, insertions, or deletions at junction sites. LAM-HTGTS uses two technical replicates from genomic DNA isolated from cells 72 hr after LPS/IL-4/α-RP105 stimulation. p-Values are calculated using Student’s t-test. Sequencing reads may harbor more than one event class (insertion, deletion, mutation, MH) with the resulting junctions having a more complex result; a junction exhibiting MH may also have a deletion or mismatches in flanking DNA. Thus, junction types were quantified on whether they contained at least one event of the class listed in the side bar (deletions, insertions, MH). (B) Representative nucleotide sequences surrounding representative Sμ-Sγ junctions from WT, Setx-/-, Rnaseh2bf/f, and Setx-/-Rnaseh2bf/f B cells from Sanger sequencing of cloned junctions. Overlap was determined by identifying the longest region at the switch junction of perfect uninterrupted donor/acceptor identity. Sμ and Sγ1 germline sequences are shown above and below each junction sequence, respectively. Regions of MH at junctions are boxed with a dashed red line, and insertions are in red bold text. Genomic DNA from sequencing experiments was isolated from two independent mice for each genotype. (C) Table with absolute numbers of uniquely mapping cloned switch junctions harboring MH and insertions in WT, Setx-/-, Rnaseh2bf/f, and Setx-/-Rnaseh2bf/f B cells 72 hr after stimulation with LPS/IL-4/α-RP105. p-Values were calculated using the chi-square goodness-of-fit test: *WT vs. Setx-/- 6.19 × 10⁻⁷, ** WT vs. Setx-/-Rnaseh2bf/f: 1.25 × 10⁻⁵. (D) Chromatin immunoprecipitation (ChIP) analysis for KU70/KU80 occupancy in Sμ and Sγ regions of primary B cells in response to LPS/IL-4/α-RP105 stimulation. Relative enrichment was calculated as fold change relative to WT set to 1; error bars show standard deviation (n = 3 mice/genotype), statistical analysis versus WT was performed using Student’s t-test. (E) ChIP analysis for RAD52 occupancy in Sμ and Sγ regions of primary B cells in response to LPS/IL-4/α-RP105 stimulation. Relative enrichment was calculated as fold change relative to WT set to 1; error bars show standard deviation (n = 3 mice/genotype).


