

Abstract
Objectives
Ultrasound often corroborates clinical diagnosis of Achilles tendinopathy (AT). Traditional measures assess macromorphological features or use qualitative grading scales, primarily focused within the free tendon. Shear wave imaging can non-invasively quantify tendon elasticity, yet it is unknown if proximal structures are affected by tendon pathology. The purpose of the study was to determine the characteristics of both traditional sonographic measures and regional shear wave speed (SWS) between limbs in patients with AT.
Methods
Twenty patients with chronic AT were recruited. Traditional sonographic measures of tendon structure were measured. Regional SWS was collected in a resting ankle position along the entire length of the tendon bilaterally. SWS measures were extracted and interpolated across evenly distributed points corresponding to the free tendon (FT), soleus aponeurosis (SA), and gastrocnemius aponeurosis (GA). Comparisons were made between limbs in both traditional sonographic measures and regional SWS.
Results
Symptomatic tendons were thicker (10.2 (1.9) vs. 6.8 (1.8) mm; p < 0.001) and had more hyperemia (p = 0.001) and hypoechogenicity (p = 0.002) than the contralateral tendon. Regional SWS in the FT was lower in the symptomatic limb compared to the contralateral limb (11.53 [10.99, 12.07] vs. 10.97 [10.43, 11.51]; p = 0.03). No differences between limbs were found for the SA (p = 0.13) or GA (p = 0.99).
Conclusions
Lower SWS was only observed in the FT in AT patients, indicating that alterations in tendon elasticity associated with AT were localized to the FT and did not involve the proximal passive tendon structures.
Keywords: Achilles tendon, Tendinopathy, Ultrasonography, Elasticity
Introduction
Achilles tendinopathy (AT) is characterized by localized pain, swelling, and impaired physical function during daily activities such as walking, and stiffness particularly after long periods of inactivity. The prevalence of Achilles tendinopathy is observed in both athletic [1, 2] and general populations [3, 4]. Both intrinsic and extrinsic factors influence the pathogenesis of Achilles tendinopathy [5], resulting in the disruption of the collagen fibril matrix and changes in the overall tendon structure.
Ultrasound and magnetic resonance imaging (MRI) are useful diagnostic imaging tools to assess overuse changes in the appearance of the Achilles tendon. However, ultrasound is accessible and well-suited for evaluating superficial tendon locations, such as the Achilles tendon. Typical ultrasound characteristics of tendinopathy include increased tendon thickness, hypoechogenicity, and neovascularity. Although useful in characterizing tendinopathy, these traditional morphologic measures provide limited insight into tendon structure changes.
Shear wave imaging, either characterized by the modulus expressed in kilopascals (kPa) or by shear wave speed (SWS) measured in meters per second, has been shown to be a reliable quantitative technique in both tendon [6–8] and muscle [9–11]. This imaging technique has been used to estimate tissue elasticity in both healthy [12–18] and tendinopathy patients [19–22]. SWS may be an adjunctive tool to traditional US in quantifying tissue properties in tendinopathy patients.
Recent studies have used SWS as an outcome measure following different treatment options for Achilles tendinopathy [20, 23, 24]. Despite the increased interest in SWS to estimate tendon elasticity, the use of this technique has primarily been limited to the free tendon. Some groups have previously characterized regional variations in SWS along the Achilles tendon and showed differences between the free tendon (FT), the soleus aponeurosis (SA), and gastrocnemius aponeurosis (GA) regions [12–14, 25]. However, these investigations were limited to only one limb and in healthy populations.
In this paper, we report baseline characteristics of sonographic measures between symptomatic and contralateral limbs in patients with AT. Traditional morphologic measures of maximum tendon thickness, hypoechogenicity, and hyperemia are described. Additionally, regional measures of SWS along the entire length of the tendon are compared between the symptomatic and contralateral limbs to determine if differences in SWS are detected. We hypothesized that there would be differences in measured SWS between limbs in the FT, but not in the SA or GA regions.
Materials and methods
This study (ClinicalTrials.gov Identifier: NCT01911650) was a prospective randomized, single-blinded, control trial with a block randomized allocation to PRP treatment or wait-and-see control group. The Health Sciences Institutional Review Board at the University of Wisconsin-Madison approved all procedures, and patients provided written informed consent prior to enrollment.
Inclusion and exclusion criteria
Patients were recruited from the University of Wisconsin Orthopedic Surgery or Sports Medicine clinics from June 2013 to January 2019. A total of 20 participants were included in this pilot study. Inclusion criteria were (1) age 18–65 years, (2) confirmed clinical diagnosis of moderate to severe midsubstance AT, (3) pain for at least 6 months and visual analog scale (VAS) pain > 5 (0–10 scale), (4) failure of eccentric exercise protocol, and (5) failure of at least 2 of the 3 most common treatments for AT (non-steroidal anti-inflammatory drugs, rest/ice, or taping). Exclusion criteria were (1) bilateral AT; (2) insertional AT; (3) local steroid injection within 6 weeks or physical therapy within 4 weeks; (4) inability to comply with follow-up criteria; (5) history of bleeding disorders, hematologic conditions, inflammatory arthritis, systemic nervous system disease, lower-extremity surgeries, or neuropathy; (6) daily use of opioids for pain; (7) anticoagulation or immunosuppressive therapy in the prior month; (8) intent to use NSAIDs or steroids; and (9) self-reported pregnancy.
Patient recruitment initiated with original inclusion criteria started June 2013. Due to poor enrollment after 11 months, the inclusion criteria were modified to include bilateral Achilles tendinopathy until study completion (January 2019). In the event of bilateral Achilles tendinopathy, the side that experienced the most pain was identified as the symptomatic side. A flow diagram of study enrollment is shown in Fig. 1.
Fig. 1.
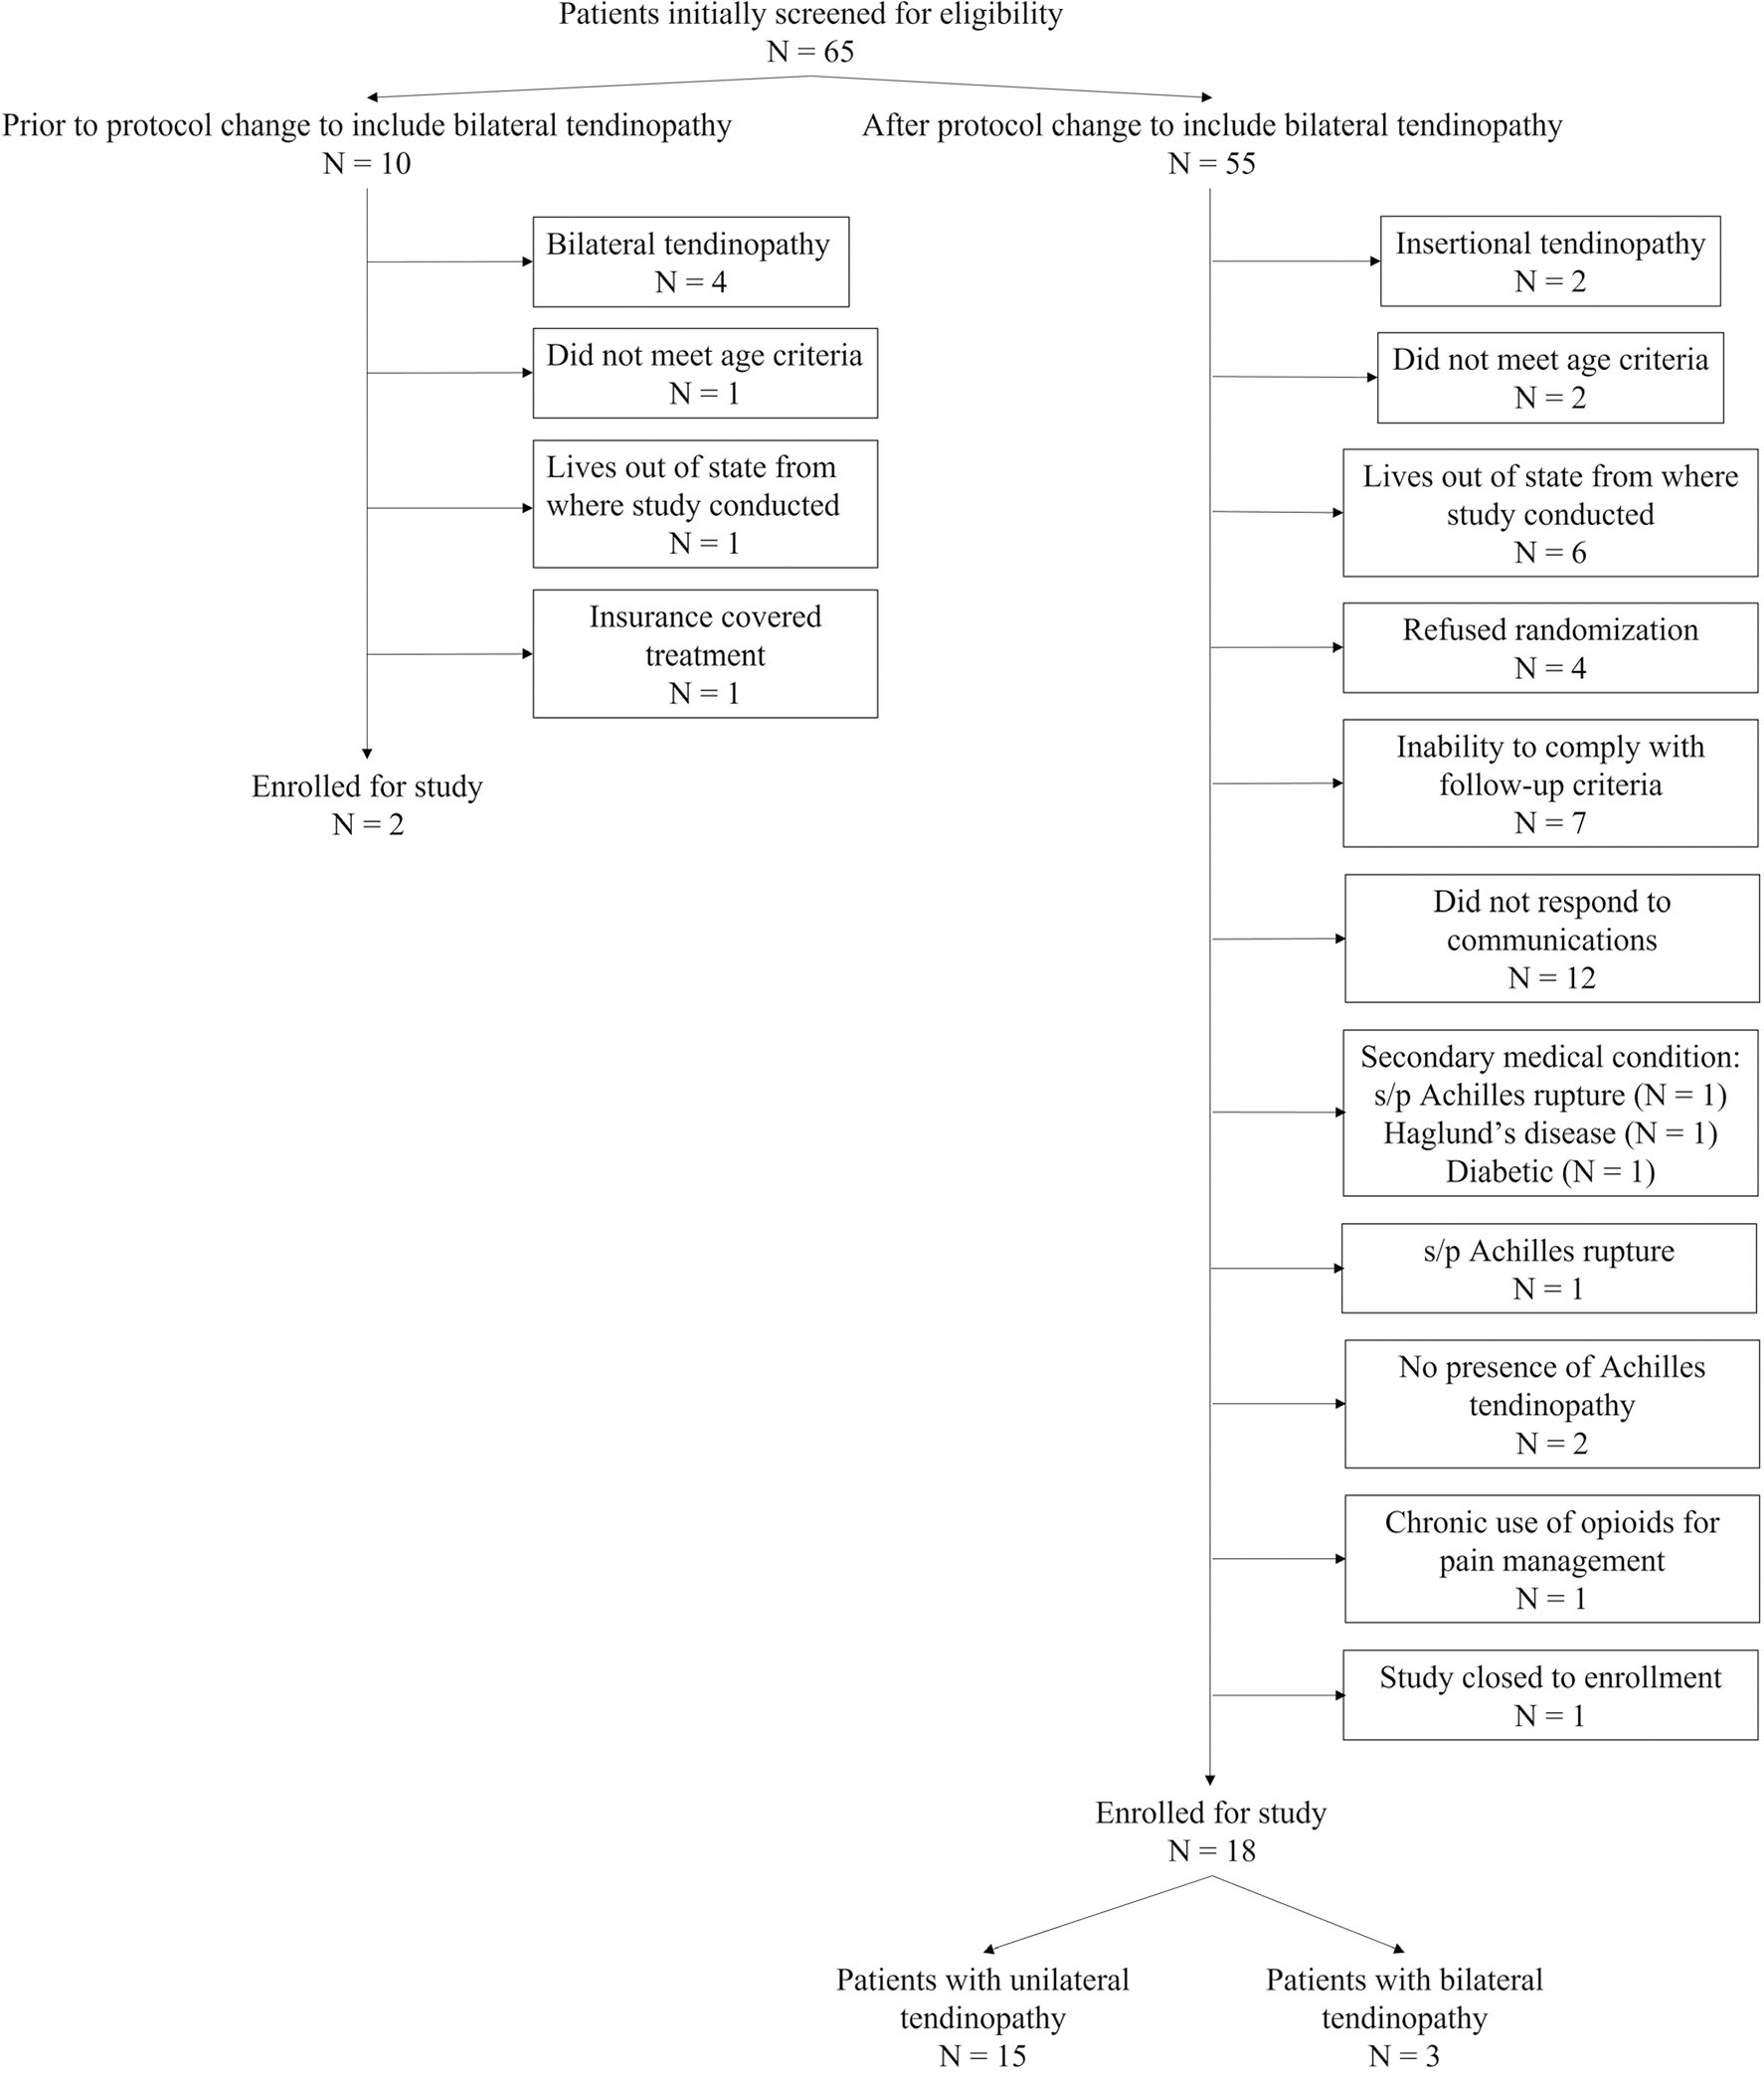
Flow diagram of patients enrolled and included for the study
Study design and outcomes
Baseline assessments of pain and function (VAS and Victorian Institute of Sports Assessment-Achilles (VISA-A) questionnaire score [26]) were collected. The primary outcome was SWS measured along the tendon length. Secondary outcomes included sonographic measures of maximum tendon thickness, hypoechogenicity, hyperemia assessed with Power Doppler, and resting ankle angle measured manually via goniometry. Secondary outcomes of traditional sonographic measures were determined within the free tendon at the thickest portion. A single board-certified radiologist with over 15 years’ experience (K.S.L) reviewed all images and graded the level of hypoechogenicity and hyperemia [27]. Consistent with previous work [27], hypoechogenicity was graded according to an ordinal scale from 0 to 3 with 0 indicating normal echogenicity and fibrillar pattern, 1 indicating irregular fibrillar pattern and a slightly weakened echogenicity (< 25% of the area), 2 indicating significant hypoechoic regions (25–50%) and fiber irregularity, and 3 indicating marked hypoechogenicity (> 50%). Hyperemia was graded according to a modified Ohberg scale from 0 to 3 with 0 corresponding to no visible blood vessels, 1 corresponding to mild (one to two visible vessels extending into the tendon), 2 corresponding to moderate (three to four visible vessels), and 3 corresponding to marked neovascularity (> 4 visible vessels extending into the tendon) [27].
Ultrasound shear wave speed acquisition and data analysis protocol
Prior to imaging, each patient walked for 6 min to precondition the tendon. The patient was then laid prone on an exam table with their feet slightly hanging off the table edge. The resting ankle angle was measured bilaterally. A musculoskeletal (MSK)–trained sonographer (5+ years’ experience in MSK ultrasound) performed all scans and was blinded to patient treatment group allocation. After conventional sonographic measures, SWS was collected in the resting ankle position bilaterally using the same ultrasound machine (Aixplorer, SuperSonic Imagine, software version 5) with a linear array transducer (50 mm, L 15–4). The same settings were used across all patients (high persist, superficial MSK preset, smoothing 7) [12–14, 25, 28].
The SWS was collected along the entire tendon length according to previous standardized protocols [12–14, 25]. The end of the transducer was initially positioned over the distal tendon insertion and parallel to the underlying tendon. Three repeat frames of SWS data were collected at four consecutive shear wave maps within the transducer location. A path along the medial gastrocnemius aponeurosis was identified and the transducer moved proximally one transducer length (50 mm). The most proximal location was defined as (1) at least one transducer length beyond the gastrocnemius muscle-tendon junction (MTJ), (2) until the tendon was no longer visible, or (3) if the SWS map did not have data within the entire acquisition box or over the tendon [14]. A gel standoff pad was used at the two most distal locations (Fig. 2).
Fig. 2.

Illustration of shear wave speed (SWS) acquisition protocol. The transducer was initially placed over the distal insertion of the Achilles tendon on the calcaneus. Within each transducer location, a total of 4 consecutive SWS boxes were placed along the tendon and 3 sequential images were captured. The transducer was then moved proximally one transducer length (50 mm). For clarity, only a single SWS overlay is depicted for illustrative purposes
Shear wave data were extracted from exported DICOM images using a custom MATLAB (The MathWorks, Inc.) script. Anatomical locations corresponding to the edge of the calcaneus, the soleus MTJ, and gastrocnemius MTJ were identified (Fig. 3). The SWS measures were interpolated such that the FT had 10 evenly distributed data points, the SA had 30, and the GA had 10 for between-subject comparison [12–14]. The saturation (percentage of pixels that exceed maximum measurable speed of 16.3 m/s) and quality factor (similarity between a shear wave measured at one time point and a later time point with values ranging from 0 to 1) were also extracted [12, 14, 25]. A single researcher (S.K.C.) manually defined regions of interest (ROIs) that spanned the entire visible tendon. The average SWS, saturation, and quality factor of three frames at each transducer and box location were used for analysis [12, 14, 25].
Fig. 3.

Shear wave speed (SWS) maps from one representative subject across the different transducer locations. Each separate image corresponds to an individual transducer location. Due to the fact that a gel stand-off pad was used for the first two transducer locations, the images corresponding to transducer locations 3–5 have been shifted down to match the skin surface from the free tendon. Note that the image acquisition depth for the final image is 3 cm compared to the other images, which is approximately 2 cm for all other images. Additionally, it should be noted that the stand-off gel pad places the underlying Achilles free tendon at approximately 1 cm below the transducer surface which is consistent with the tendon depths across the soleus and gastrocnemius aponeuroses. For clarity, only a single SWS overlay map is depicted at each transducer location for illustrative purposes. The original images have been cropped only to exclude study data, including dates and subject IDs, but have not been modified in any other way
Statistical analysis
Separate Wilcoxon tests were used to compare hypoechogenicity and hyperemia between limbs due to the ordinal grading scales. Paired t tests were used to compare maximum tendon thickness and resting ankle angle between limbs. A full-factorial linear mixed-effects model with fixed effects of anatomical regions (FT, SA, and GA) and limb (symptomatic, contralateral) and a random effect (patient) was used to detect differences in SWS between limbs. Linear mixed-effects outputs are expressed as least square mean estimate (95% confidence interval). A priori significance was defined as α = 0.05.
Results
Clinical sonographic measures between contralateral and symptomatic limbs
Patient demographics are listed in Table 1. Traditional sonographic measures are summarized in Table 2. Wilcoxon tests revealed differences between limbs for both hypoechocity (p = 0.002) and hyperemia (p = 0.001). The mean thickness measured at the region of maximal tendon thickness was significantly larger in the symptomatic limb compared to the contralateral limb (10.2 (1.9) vs. 6.8 (1.8) mm; p < 0.001) (Fig. 4). The resting ankle angle in the contralateral and symptomatic limbs was 26.8° (5.4) and 24.4° (5.6) of plantarflexion, respectively, with no significant differences observed between limbs (p = 0.06).
Table 1.
Patient characteristics
| Patient characteristics | |
|---|---|
|
| |
| Demographics | |
| Number of patients | 20 |
| Sex (male | female) | 13 | 7 |
| Age (years) | 56.3 (6.1) |
| Height (cm) | 176.1 (10.2) |
| Weight (kg) | 86.3 (20.1) |
| Body mass index (kg/m2) | 27.4 (5.4) |
| Tendinopathy characteristics | |
| Symptomatic limb (left | right) | 8 | 12 |
| Unilateral | bilateral | 17 | 3 |
| Symptom duration prior to enrollment (months) | 14.5 (12.9) |
| Baseline VISA-A score | 45.4 (20.7) |
| Baseline VAS score | 7.0 (1.4) |
Values are expressed as mean (standard deviation) or as number of patients
Table 2.
Summary of traditional sonographic measures measured within the free tendon at the region of maximal thickness
| Traditional sonographic measure | Descriptive statistics† | p value‡ |
|---|---|---|
|
| ||
| Hypoechogenicity score | ||
| Contralateral | 1 [0, 2] | 0.002 |
| Symptomatic | 2 [0, 3] | |
| Hyperemia score | ||
| Contralateral | 0 [0, 2] | 0.001 |
| Symptomatic | 2 [0, 3] | |
| Maximum tendon thickness (mm) | ||
| Contralateral | 6.8 (1.8) | < 0.001 |
| Symptomatic | 10.2 (1.9) | |
Descriptive statistics are presented as either median [range] or mean (standard deviation)
p values derived from separate Wilcoxon tests for hypoechogenicity and hyperemia and a paired t test for tendon thickness
Fig. 4.

Individual and group measures of maximal tendon thickness. Each subject is plotted as a dot with a line that connects tendon thickness measures between the contralateral and symptomatic tendons
Regional shear wave analyses between contralateral and symptomatic limbs
The mean quality factor was nearly identical across the three different tendon regions for both limbs with the mean quality factor exceeding 0.89 across all regions. The percentage of the number of pixels that reached the maximum SWS of the system at 16.3 m/s (saturation) across the free tendon was 5.73 (12.06)% in the contralateral limb and 5.31 (11.76)% in the symptomatic limb. This decreased slightly in the soleus aponeurosis to 2.08 (8.83)% in the contralateral limb and 2.71 (9.86)% in the symptomatic limb. The number of saturated pixels in the gastrocnemius aponeurosis was nearly zero in both limbs. A detailed summary of the quality factor and saturation measures can be found in the Supplementary materials (Table A).
Figure 5 shows the SWS data in the free tendon from a representative subject. Figure 6 depicts the mean ± one standard deviation of the regional SWS in the contralateral and symptomatic limbs in the FT, SA, and GA for all patients included in the study. Table 3 presents the SWS by tendon region and limb. Significant differences in the free tendon were noted between the contralateral (11.53 [10.99, 12.07]) and symptomatic limbs (10.97 [10.43, 11.51]; p = 0.03). However, no differences were noted between limbs in either the SA (contralateral vs. symptomatic: 9.86 [9.3, 10.37] and 10.13 [9.62, 10.63]; p = 0.13) or GA (contralateral vs. symptomatic: 4.57 [4.03, 5.11] and 4.52 [3.98, 5.06]; p = 0.99). A summary of all post hoc pairwise comparisons can be found in the Supplementary materials (Table B).
Fig. 5.

Shear wave speed (SWS) maps of the Achilles free tendon in the contralateral and symptomatic limbs from one representative subject. The images have been cropped to exclude study data, including dates and subject identification numbers, and manually stitched together for representation of sequential imaging locations of the free tendon but have not been modified in any other way. The regions of interest (depicted in white) from which SWS were extracted were manually defined to encompass the entire tendon thickness and length of the SWS box
Fig. 6.

Mean shear wave speeds (SWS) (m/s) across anatomical regions along the tendon between limbs. The solid line indicates the mean SWS, and the transparent ribbon represents 1 standard deviation. The vertical lines correspond to the normalized location (% tendon length) of the free tendon and the gastrocnemius aponeurosis
Table 3.
Shear wave speed (m/s) least square means [95% confidence intervals] by limb and tendon region
| Tendon region | Limb | Least square mean estimate† [95% CI] | Estimate difference [standard error] | p value |
|---|---|---|---|---|
|
| ||||
| Free tendon | Contralateral | 11.53 [10.99, 12.07] | 0.56 [0.19] | 0.03* |
| Symptomatic | 10.97 [10.43, 11.51] | |||
| Soleus aponerosis | Contralateral | 9.86 [9.36, 10.37] | −0.27 [0.11] | 0.13 |
| Symptomatic | 10.13 [9.62, 10.63] | |||
| Gastrocnemius aponeurosis | Contralateral | 4.57 [4.03, 5.11] | 0.04 [0.19] | 0.99 |
| Symptomatic | 4.52 [3.98, 5.06] | |||
Estimate difference is defined as contralateral–symptomatic
Discussion
The main purpose of our study was to demonstrate the ability of SWS to differentiate abnormal symptomatic Achilles tendons from the contralateral tendon and compare regional SWS along the length of the tendon between limbs. We observed differences in SWS between symptomatic and contralateral limbs in only the free tendon, but not in the soleus or gastrocnemius aponeuroses supporting our hypothesis.
Traditional sonographic measures, coupled with qualitative grading scales, characterize macromorphological changes in the tendon structure due to pathology. Consistent with typical markers of AT, the median hypoechogenicity and hyperemia scores were higher in the symptomatic tendon compared to the contralateral tendon. Additionally, the symptomatic tendon was thicker than the contralateral tendon, consistent with previous investigations and thereby confirming that the symptomatic tendons had known markers indicative of tendinopathy [19, 29]. Resting ankle angle was not different between limbs (p = 0.06), and the difference was not outside the standard error of measure with a goniometer [30]. Differences between limbs evaluated by traditional sonographic measures are qualitatively assessed by a discrete grading scale, do not provide insight into tendon properties integral to transmitting force for movement, and do not correlate with healing response and patient-reported improvement in pain or function. In contrast, shear wave imaging is capable of providing an objective measure of disease other than simply relying on thickness, echotexture, or hyperemia [23].
The observed differences in SWS within the FT are consistent with previous studies characterizing AT using shear wave elastography in both insertional and mid-portion AT typically measured within the critical zone (2–6 cm proximal to the calcaneal insertion) [19, 21, 23]. The observations in the current study are particularly noteworthy as this region includes the watershed zone, which is susceptible to rupture particularly in middle-aged and older adults. Moreover, the estimated difference between the contralateral and symptomatic limbs reported here (0.56 m/s) is greater than the minimal detectable change (0.51 m/s) previously reported in a relaxed ankle position in young, healthy volunteers suggesting that these differences between limbs are indicative of meaningful change rather than measurement error [8].
Previous investigations have shown regional variations in tendon shear wave propagation across a wide age range of participants [12–14, 25, 31]. However, these studies were performed in healthy individuals, and it is unknown if differences in shear wave propagation between limbs in unilateral tendinopathy would exist or if differences would be limited to specific region(s) along the length of the tendon. To the authors’ best knowledge, this is the first study to perform SWS measures along the entire length of the tendon in patients with chronic AT to characterize potential differences in SWS propagation in proximal regions encompassing the SA and GA.
Regarding similarity of shear waves measured at different time points along the tendon, the quality factor did not vary between limbs or across tendon locations, similar to previous findings in healthy individuals [12]. Interestingly, the mean saturation measure in the FT in the current study was nearly half of that observed in middle-age participants in a resting ankle posture in previous investigations [13, 14]. This could reflect the lower SWS, particularly observed within the symptomatic FT. Additionally, it should be noted that SWS could be underestimated with high percentages of pixels with SWS that exceed the maximum measurable speeds of the system (16.3 m/s). However, the percentage of pixels that met or exceeded this speed was on average less than 6% across all measures within the FT and less than 2% in the SA. Additionally, previous work has indicated that substantial SWS saturation occurs near 14 m/s [25]. Considering the low percentage of saturated pixels across all tendon regions and the average SWS observed in our cohort (less than 12 m/s across the tendon length; Fig. 6), we do not think the saturation measures had any meaningful influence on our findings.
Although comparisons between limbs are often made in clinical investigations, the contralateral limb may not be a suitable control in tendinopathy patients due to abnormalities observed bilaterally [32–34]. One group demonstrated not only that the elastic modulus was lower in the symptomatic AT compared to that in the contralateral limb, but also that the elastic modulus in the contralateral tendon was also lower compared to that in healthy controls [35]. Similar observations using shear wave elastography showed lower Young’s modulus in contralateral tendons compared to that in healthy controls [19]. It should be noted that the healthy controls in the aforementioned study were significantly younger (50 vs. 30 years) and had a lower BMI (26.6 vs. 22.8 kg/m2) than the tendinopathy patients. Although age-related differences in regional AT SWS between young and middle-age individuals were not observed [13, 14], age-related changes in tendon stiffness and increased risk of tendinopathy in overweight patients (BMI > 25 kg/m2) have been reported in older adults [36, 37], which may indicate that the healthy controls used by Gatz et al [19] may not be ideal. A review of data reported by Slane et al [13, 14] in a cohort similar in age (49 ± 4 years) to our study showed the mean SWS in the FT region (12.3 m/s) in healthy individuals was higher than those of both the contralateral (11.5 m/s) and symptomatic (11.0 m/s) limbs. Furthermore, previously reported SWS in the SA (10.2 m/s) [13, 14] are similar to the findings in the current study (~ 10 m/s). However, the SWS in the GA in the AT patients are slightly higher compared to the GA SWS measured previously in healthy, middle-aged patients (4.5 m/s vs. 3.9 m/s, respectively). Future work should investigate if these trends persist in a larger cohort and if there are implications for injury even in low-intensity and non-sports-related activities as a result of altered mechanical properties [38, 39].
Limitations of our study include the nature of this pilot study and the small sample size. We also had to open participant enrollment to include individuals with symptoms of bilateral tendinopathy due to difficulties in recruiting. Although a smaller subset of our total sample (N = 3 of 20), it is possible that the bilateral pathology may have underestimated the differences observed in SWS between the symptomatic and less symptomatic limbs. We chose to include these subjects since they correspond to the clinical population being treated for AT as nearly 30% of patients in medical practice show signs of tendinopathy on imaging despite being asymptomatic on one side. Additionally, any signs of tendinopathy on the contralateral side may have reduced the SWS thereby muting some of the differences between limbs observed in the current study. It is possible that between-limb differences in SWS would be greater in unilateral AT, which have been observed in previous investigations [19, 21]. As noted previously, the contralateral limb may not be a suitable healthy control in tendinopathy patients due to abnormalities observed bilaterally [32–34]. Thus, assuming the non-symptomatic side serves as a healthy control is likely a false assumption. Future work should aim to compare regional SWS in symptomatic tendons with a control population of healthy volunteers, while matching age, lifestyle, and BMI. Finally, due to the smaller sample sizes, we do not have enough subjects to perform a sub-analysis between patients with unilateral vs. bilateral tendinopathy.
Conclusions
AT is characterized by the disruption of normal tendon structure and can have a significant, detrimental impact on quality of life. Sonographic assessments of tendon structure prove to be a useful tool to corroborate clinical diagnosis but lack the ability to assess tendon properties. Using shear wave imaging to estimate tendon stiffness, we observed lower SWS only in the FT in AT patients, indicating that alterations in tendon elasticity associated with AT were localized to the FT and did not involve the proximal passive tendon structures of the SA and GA. A reliable quantitative measure of tendon elasticity allows for clinical validation studies to address important topics such as return to activity and the effectiveness of rehabilitation protocols. Large clinical trials should consider including advanced technique such as SWS especially when evaluating emerging injection therapies like platelet-rich plasma or percutaneous tenotomy.
Supplementary Material
Key Points.
Baseline characteristics of a pilot sample of 20 subjects suffering from chronic Achilles tendinopathy showed differences in conventional sonographic measures of tendon thickness, qualitatively assessed hypoechogenicity, hyperemia, and quantitative measures of shear wave speed.
Regional shear wave speeds were lower in the free tendon but not in the proximal regions of the soleus or gastrocnemius aponeuroses in Achilles tendinopathy patients.
Using shear wave imaging to estimate tendon stiffness may prove beneficial for clinical validation studies to address important topics such as return to activity and the effectiveness of rehabilitation protocols.
Funding
Funding for this work was provided by the Radiological Society of North America (Scholar Grant) RSCH1317, the University of Wisconsin Madison Radiology Department Research and Development Fund (#1204-001), and the Clinical and Translational Science Award (CTSA) program, previously through the National Center for Research Resources (NCRR) grant 1UL1RR025011, and now by the National Center for Advancing Translational Sciences (NCATS), grant 9U54TR000021.
Abbreviations
- AT
Achilles tendinopathy
- FT
Free tendon
- GA
Gastrocnemius aponeurosis
- SA
Soleus aponeurosis
- SWS
Shear wave speed
Footnotes
Conflict of interest The authors of this manuscript declare relationships with the following companies:
Kenneth S. Lee
Grant: NBA/GE Collaborative
Royalties: Elsevier
In Kind Research support: Supersonic Imagine
John J. Wilson
Grant: DePuy-Mitek
No other authors have conflicts of interest related to this work.
Guarantor The scientific guarantor of this publication is Kenneth S. Lee.
Statistics and biometry No complex statistical methods were necessary for this paper.
Informed consent Written informed consent was obtained from all subjects (patients) in this study.
Ethical approval Institutional Review Board approval was obtained.
Methodology
• prospective
• observational
• performed at one institution
Supplementary Information The online version contains supplementary material available at https://doi.org/10.1007/s00330-022-08957-3.
References
- 1.Kakouris N, Yener N, Fong DTP (2021) A systematic review of running-related musculoskeletal injuries in runners. J Sport Health Sci 10:513–522 [DOI] [PMC free article] [PubMed] [Google Scholar]
- 2.Florit D, Pedret C, Casals M, Malliaras P, Sugimoto D, Rodas G (2019) Incidence of tendinopathy in team sports in a multidisciplinary sports club over 8 seasons. J Sports Sci Med 18:780–788 [PMC free article] [PubMed] [Google Scholar]
- 3.De Jonge S, Van Den Berg C, De Vos RJ et al. (2011) Incidence of midportion Achilles tendinopathy in the general population. Br J Sports Med 45:1026–1028 [DOI] [PubMed] [Google Scholar]
- 4.Waldecker U, Hofmann G, Drewitz S (2012) Epidemiologic investigation of 1394 feet: coincidence of hindfoot malalignment and Achilles tendon disorders. Foot Ankle Surg 18:119–123 [DOI] [PubMed] [Google Scholar]
- 5.Millar NL, Silbernagel KG, Thorborg K et al. (2021) Tendinopathy. Nat Rev Dis Prim 7:1. [DOI] [PubMed] [Google Scholar]
- 6.Peltz CD, Haladik JA, Divine G, Siegal D, Van Holsbeeck M, Bey MJ (2013) ShearWave elastography: repeatability for measurement of tendon stiffness. Skelet Radiol 42:1151–1156 [DOI] [PubMed] [Google Scholar]
- 7.Dirrichs T, Schrading S, Gatz M, Tingart M, Kuhl CK, Quack V (2019) Shear wave elastography (SWE) of asymptomatic Achilles tendons: a comparison between semiprofessional athletes and the nonathletic general population. Acad Radiol 26:1345–1351 [DOI] [PubMed] [Google Scholar]
- 8.Payne C, Watt P, Cercignani M, Webborn N (2018) Reproducibility of shear wave elastography measures of the Achilles tendon. Skelet Radiol 47:779–784 [DOI] [PubMed] [Google Scholar]
- 9.Dorado Cortez C, Hermitte L, Ramain A, Mesmann C, Lefort T, Pialat JB (2016) Ultrasound shear wave velocity in skeletal muscle: a reproducibility study. Diagn Interv Imaging 97:71–79 [DOI] [PubMed] [Google Scholar]
- 10.Šarabon N, Kozinc Ž, Podrekar N (2019) Using shear-wave elastography in skeletal muscle: a repeatability and reproducibility study on biceps femoris muscle. PLoS One 14:e0222008. [DOI] [PMC free article] [PubMed] [Google Scholar]
- 11.Mendes B, Firmino T, Oliveira R et al. (2018) Hamstring stiffness pattern during contraction in healthy individuals: analysis by ultrasound-based shear wave elastography. Eur J Appl Physiol 118:2403–2415 [DOI] [PubMed] [Google Scholar]
- 12.DeWall RJ, Slane LC, Lee KS, Thelen DG (2014) Spatial variations in Achilles tendon shear wave speed. J Biomech 47:2685–2692 [DOI] [PMC free article] [PubMed] [Google Scholar]
- 13.Slane LC, DeWall R, Martin J, Lee K, Thelen DG (2015) Middle-aged adults exhibit altered spatial variations in Achilles tendon wave speed. Physiol Meas 36:1485–1496 [DOI] [PMC free article] [PubMed] [Google Scholar]
- 14.Slane LC, Martin J, DeWall R, Thelen D, Lee K (2017) Quantitative ultrasound mapping of regional variations in shear wave speeds of the aging Achilles tendon. Eur Radiol 27:474–482 [DOI] [PMC free article] [PubMed] [Google Scholar]
- 15.Chernak LA, Dewall RJ, Lee KS, Thelen DG (2013) Length and activation dependent variations in muscle shear wave speed. Physiol Meas 34:713–721 [DOI] [PMC free article] [PubMed] [Google Scholar]
- 16.Le Sant G, Ates F, Brasseur JL, Nordez A (2015) Elastography study of hamstring behaviors during passive stretching. PLoS One 10:e0139272. [DOI] [PMC free article] [PubMed] [Google Scholar]
- 17.Wang AB, Perreault EJ, Royston TJ, Lee SSM (2019) Changes in shear wave propagation within skeletal muscle during active and passive force generation. J Biomech 94:115–122 [DOI] [PMC free article] [PubMed] [Google Scholar]
- 18.Corrigan P, Zellers JA, Balascio P, Silbernagel KG, Cortes DH (2019) Quantification of mechanical properties in healthy Achilles tendon using continuous shear wave elastography: a reliability and validation study. Ultrasound Med Biol 45:1574–1585 [DOI] [PMC free article] [PubMed] [Google Scholar]
- 19.Gatz M, Betsch M, Bode D et al. (2020) Intra individual comparison of unilateral achilles tendinopathy using B-mode, power doppler, ultrasound tissue characterization and shear wave elastography. J Sports Med Phys Fitness 60:1462–1469 [DOI] [PubMed] [Google Scholar]
- 20.Gatz M, Betsch M, Dirrichs T et al. (2020) Eccentric and isometric exercises in Achilles tendinopathy evaluated by the VISA-A score and shear wave elastography. Sports Health 12:373–381 [DOI] [PMC free article] [PubMed] [Google Scholar]
- 21.Dirrichs T, Quack V, Gatz M, Tingart M, Kuhl CK, Schrading S (2016) Shear wave elastography (SWE) for the evaluation of patients with tendinopathies. Acad Radiol 23:1204–1213 [DOI] [PubMed] [Google Scholar]
- 22.Prado-Costa R, Rebelo J, Monteiro-Barroso J, Preto AS (2018) Ultrasound elastography: compression elastography and shear-wave elastography in the assessment of tendon injury. Insights Imaging 9:791–814 [DOI] [PMC free article] [PubMed] [Google Scholar]
- 23.Dirrichs T, Quack V, Gatz M et al. (2018) Shear wave elastography (SWE) for monitoring of treatment of tendinopathies: a double-blinded, longitudinal clinical study. Acad Radiol 25:265–272 [DOI] [PubMed] [Google Scholar]
- 24.Gatz M, Schweda S, Betsch M et al. (2021) Line- and point-focused extracorporeal shock wave therapy for Achilles tendinopathy: a placebo-controlled RCT study. Sports Health 13:511–518 [DOI] [PMC free article] [PubMed] [Google Scholar]
- 25.Martin JA, Biedrzycki AH, Lee KS et al. (2015) In vivo measures of shear wave speed as a predictor of tendon elasticity and strength. Ultrasound Med Biol 41:2722–2730 [DOI] [PMC free article] [PubMed] [Google Scholar]
- 26.Robinson JM, Cook JL, Purdam C et al. (2001) The VISA-A questionnaire: a valid and reliable index of the clinical severity of Achilles tendinopathy. Br J Sports Med 35:335–341 [DOI] [PMC free article] [PubMed] [Google Scholar]
- 27.Ryan M, Wong A, Rabago D, Lee K, Taunton J (2011) Ultrasound-guided injections of hyperosmolar dextrose for overuse patellar tendinopathy: a pilot study. Br J Sports Med 45:972–977 [DOI] [PubMed] [Google Scholar]
- 28.Kot BCW, Zhang ZJ, Lee AWC, Leung VYF, Fu SN (2012) Elastic modulus of muscle and tendon with shear wave ultrasound elastography: variations with different technical settings. PLoS One 7:e44348. [DOI] [PMC free article] [PubMed] [Google Scholar]
- 29.Matthews W, Ellis R, Furness JW, Rathbone E, Hing W (2020) Staging Achilles tendinopathy using ultrasound imaging: the development and investigation of a new ultrasound imaging criteria based on the continuum model of tendon pathology. BMJ Open Sport Exerc Med 6:e000699. [DOI] [PMC free article] [PubMed] [Google Scholar]
- 30.Konor MM, Morton S, Eckerson JM, Grindstaff TL (2012) Reliability of three measures of ankle dorsiflexion range of motion. Int J Sports Phys Ther 7:279–287 [PMC free article] [PubMed] [Google Scholar]
- 31.Slane LC, Thelen DG (2015) Achilles tendon displacement patterns during passive stretch and eccentric loading are altered in middle-aged adults. Med Eng Phys 37:712–716 [DOI] [PMC free article] [PubMed] [Google Scholar]
- 32.Splittgerber LE, Ihm JM (2019) Significance of asymptomatic tendon pathology in athletes. Curr Sports Med Rep 18:192–200 [DOI] [PubMed] [Google Scholar]
- 33.Giombini A, Dragoni S, Di Cesare A, Di Cesare M, Del Buono A, Maffulli N (2013) Asymptomatic Achilles, patellar, and quadriceps tendinopathy: a longitudinal clinical and ultrasonographic study in elite fencers. Scand J Med Sci Sports 23:311–316 [DOI] [PubMed] [Google Scholar]
- 34.Comin J, Cook JL, Malliaras P et al. (2013) The prevalence and clinical significance of sonographic tendon abnormalities in asymptomatic ballet dancers: a 24-month longitudinal study. Br J Sports Med 47:89–92 [DOI] [PubMed] [Google Scholar]
- 35.Kulig K, Chang Y-J, Winiarski S, Bashford GR (2016) Ultrasound-based tendon micromorphology predicts mechanical characteristics of degenerated tendons. Ultrasound Med Biol 42:664–673 [DOI] [PubMed] [Google Scholar]
- 36.Krupenevich RL, Beck ON, Sawicki GS, Franz JR (2022) Reduced Achilles tendon stiffness disrupts calf muscle neuromechanics in elderly gait. Gerontology 68:241–251 [DOI] [PMC free article] [PubMed] [Google Scholar]
- 37.Klein EE, Weil L, Weil LS, Fleischer AE (2013) Body mass index and Achilles tendonitis: a 10-year retrospective analysis. Foot Ankle Spec 6:276–282 [DOI] [PubMed] [Google Scholar]
- 38.Child S, Bryant AL, Clark RA, Crossley KM (2010) Mechanical properties of the Achilles tendon aponeurosis are altered in athletes with achilles tendinopathy. Am J Sports Med 38:1885–1893 [DOI] [PubMed] [Google Scholar]
- 39.Obst SJ, Heales LJ, Schrader BL et al. (2018) Are the mechanical or material properties of the Achilles and patellar tendons altered in tendinopathy? A systematic review with meta-analysis. Sports Med 48:2179–2198 [DOI] [PubMed] [Google Scholar]
Associated Data
This section collects any data citations, data availability statements, or supplementary materials included in this article.