

Abstract
Cell-type specific gene expression patterns and dynamics during development or in disease are controlled by cis-regulatory elements (CREs) such as promoters and enhancers. Distinct classes of CREs can be characterized by their epigenomic features, including DNA methylation, chromatin accessibility, combinations of histone modifications and conformation of local chromatin. Tremendous progress has been made in cataloging CREs in the human genome using bulk transcriptomic and epigenomic methods. However, single-cell epigenomic and multi-omic technologies have the potential to provide deeper insight into cell type-specific gene regulatory programs and how they change during development, in response to environmental cues, and through disease pathogenesis. Here, we highlight recent advances in single-cell epigenomics methods and analytical tools, and discuss their readiness for human tissue profiling.
INTRODUCTION
Spatiotemporal and cell-type specific gene expression patterns are governed by DNA sequences known as cis-regulatory elements [G] (CREs)1–3. CREs are broadly classified as promoters [G] , enhancers [G] , and insulators [G] 3–5; other types of CREs have also been reported in recent years, including silencer elements [G] 6–9 and tethering elements [G] 10, but have yet to be extensively characterized. A detailed understanding of each CRE in the genome will help to delineate the gene regulatory programs that control development, cellular differentiation and adaptation of species to their environment. It is also critical for understanding the evolution of traits in different species and interpreting the growing number of non-coding risk variants that have been linked to human diseases and complex traits.
Efforts to annotate CREs in the human genome began shortly after the genome sequence was released, but it soon became clear that sequence information alone is insufficient to identify CREs and describe their activity in each cell type and developmental stage11,12. Promoters and enhancers direct spatiotemporal patterns of gene expression in a cell-type-specific manner by interacting with combinations of sequence-specific transcription factors, which associate with additional transcription factors, and/or chromatin [G] remodeling complexes to facilitate gene transcription. However, these interactions are also regulated by epigenetic mechanisms, including chromatin accessibility, which can be profiled using methods such as DNase I-hypersensitive site sequencing (DNase-Seq)13,14 and the Assay for Transposase-Accessible Chromatin using sequencing (ATAC-seq)15; DNA methylation, which can be profiled using whole genome bisulfite sequencing (WGBS)16; and histone modifications [G] , which can be profiled using chromatin immunoprecipitation followed by sequencing (ChIP-seq)17–20. Moreover, transcriptional regulation by promoters and enhancers also depends on their spatial organization within the nucleus (recently reviewed in3). The chromatin fibers in the nucleus of eukaryotic cells are folded into topologically associating domains (TADs) 3,21. Insulators, which demarcate TAD boundaries and play a critical role in their formation, can be profiled using ChIP-seq of CTCF, an insulator binding protein22. Through their role in TAD formation, insulators facilitate interactions between enhancers and promoters within the same TAD and reduce the contacts between promoters and enhancers located in separate TADs. The frequency of these contacts can be used to deduce chromatin architecture, and can be measured using high-resolution chromosome conformation capture methods such as Hi-C23,24.
Several large-scale studies, including the Roadmap Epigenome Project and those conducted by the Encyclopedia of DNA elements (ENCODE) consortium, have profiled the epigenomes [G] of hundreds of tissue samples, primary cells, or cell lines to annotate millions of candidate CREs (cCREs)4,25–27 in the human genome. The resulting cCREs have been classified as promoter-like or enhancer-like elements based on co-occurrence of chromatin accessibility, DNA methylation and certain histone modifications (trimethylation of lysine 4 of histone H3 (H3K4me3) for poised or active promoters; H3K4me1 for poised, primed and active enhancers, or acetylation of H3K27 (H3K27ac) for active enhancers and promoters) or as insulator-like based on binding of (Figure 1)4,25–27. Coupled with chromatin interaction profiles, these cCRE catalogs provide a valuable resource to study gene regulation in distinct tissues and cell types in humans and other species, helping to establish a critical role for non-coding DNA variants in the etiology of human diseases and complex traits, and providing a framework to interpret such variants28. Despite this tremendous progress, existing cCRE catalogs of the human genome have several limitations that could, at least in part, be addressed by unbiased single cell profiling. Many catalogs lack cell-type resolution because the datasets were generated from unsorted bulk tissue. Moreover, only cell types present in high numbers and with well characterized surface markers, such as blood cell types, are amenable to sorting and isolation in sufficient quantities for bulk epigenomic profiling – rare or uncharacterized cell types will escape profilng29 (Figure 2a). Where cell numbers are limiting in vivo, ex vivo primary cells or cancer cell lines have been used instead but these do not fully recapitulate regulatory landscapes in vivo, owing to transformation or culturing conditions30. Furthermore, the completeness of a catalog is hard to achieve because CREs are often active only in select cell types, developmental stages, or physiological states, many of which are difficult to investigate using bulk assays.
Figure 1: Epigenomic marks at cis regulatory elements and their association with gene expression.
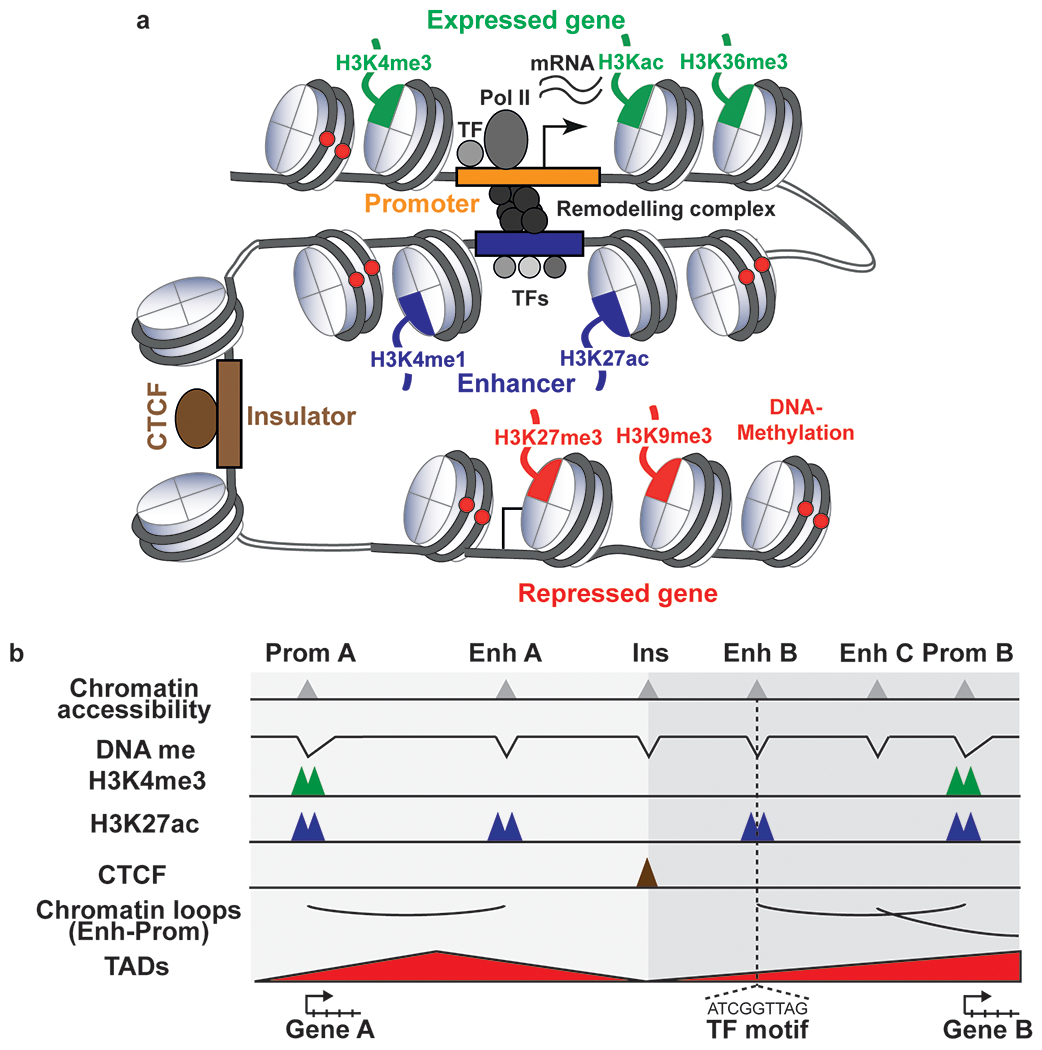
a Activity of cis-regulatory elements (CREs) and gene regions can be identified using distinct chromatin modifications. Promoters of expressed genes show high levels of chromatin accessibility, low DNA methylation levels and high levels of histone H3 trimethylated at lysine 4 (H3K4me3) and acetylated at other lysine residues, such as H3K27ac. The histone modification H3K36me3 is found at gene bodies of expressed genes. Gene expression can be modulated by enhancers, distal cis-regulatory elements that can be brought in close proximity to the promoter of target genes through the folding of chromatin. Active enhancers are characterized by high chromatin accessibility, low DNA methylation levels and high H3K4me1 and H3K27ac levels. Transcription factors bind to enhancers and promoters, and recruit chromatin remodelers and transcription machinery to regulate gene expression. Repressed genes or heterochromatic regions show high levels of DNA methylation and histone marks such as H3K9me3 and H3K27me3. Insulators, characterized by open chromatin and binding of CTCF, can prevent enhancer-dependent gene activation when placed between the promoter and enhancer or the spread of heterochromatin to euchromatin. Pol II: RNA Polymerase II, TF: Transcription factor. b Schematic representation of epigenetic features associated with different classes of CREs viewed on a genome browser. CREs are characterized by accessible chromatin and low DNA methylation levels. Active promoters (Genes 1,4) have a strong signal for H3K4me3 and H3K27ac and active enhancers have a strong signal for H3K4me1 and H3K27ac. Poised promoters have a strong signal for H3K4me3 (Gene 3) and inactive promoters are devoid of H3K4me3 (Gene 2). Poised or primed enhancers are marked by H3K4me1. Enhancer and promoter contacts are constrained by TADs, which are separated by boundaries bound by CTCF. The DNA sequence in the peak region of the chromatin accessibility track or the valley of the DNA methylation track can be used to infer binding motifs of transcription factors. Enhancers do not always act on the closest genes (Genes 2 and 3) and are brought into proximity of their target genes by chromatin loops, which can increase gene expression (Gene 4). DNA me: DNA methylation, Enh: Enhancer, Prom: Promoter, Ins: Insulator, TAD: Topologically associated domain, TF: Transcription factor
Figure 2: Single-cell epigenomic profiling enables insight into cell-type-specific CRE annotation and activity.
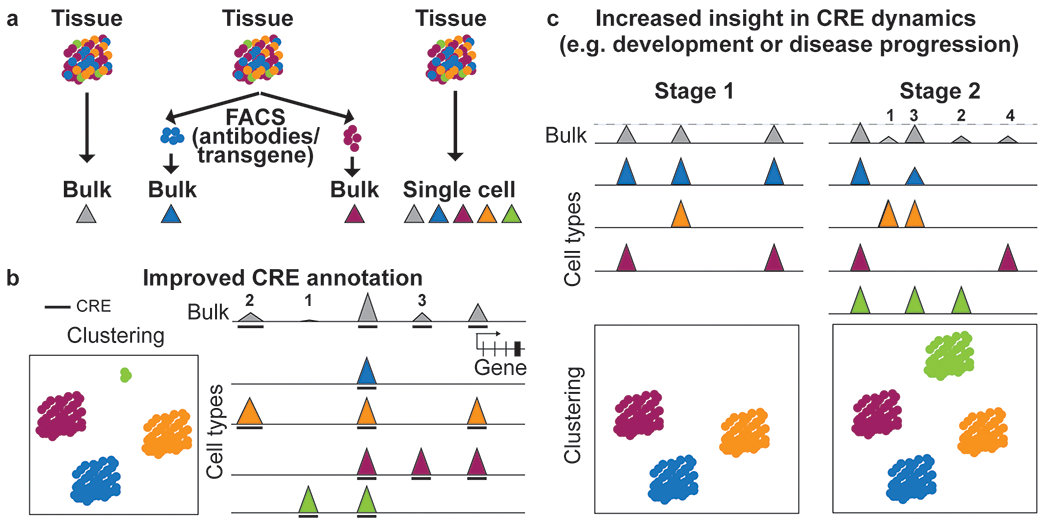
a Schematic of different ways to profile epigenomes from tissue samples. Traditionally, bulk assays are used that result in one average dataset for the tissue (left). Cell types with established surface or intracellular markers that can be identified using antibodies, transgenic expression or lineage tracers can be sorted prior to epigenomic profiling to enable insight into distinct cell types. Cell types without known epitope or validated antibody and unknown cell types could be missed or under-represented in this approach (middle). Single-cell profiling captures known and unknown cell types. By combining reads from individual cells, it also provides a pseudobulk dataset for each cell type (right). b Single-cell epigenomic datasets can be used to group cells with similar profiles into clusters corresponding to cell types or cell states and to infer tissue composition (left). Single-cell epigenomic profiles can be used to deconvolute activities of CREs (1-4 and 6) in each cell type making up the heterogeneous sample and enable annotation of an additional CRE (5) only active in the rare cell type (green) that was not detected in the bulk dataset. Lower signal strength in bulk as compared to the maximum signal (CRE 1) can be due to full activity in only one cell type (CRE 2,4,6) or lower activity of the CRE in several cell types (CRE 3). Activity of distal and proximal CREs can also be used to predict putative enhancer-promoter pairs (CRE 2 and 6). Height of peaks indicates signal strength. Arc indicates linkage between enhancer and promoter. The bold line beneath the tracks indicates peak calls. c Cell type resolution is critical to studying dynamic activities of CREs in development and disease. Clustering analysis shows that a tissue at Stage B contains an additional cell type compared to Stage A and two of the cell types transitioned to a new state (indicated by arrows) (top). Multiple different scenarios could explain the changes seen in the bulk profile. An increase in signal between stages can result from an increase in the activity of a single CRE (Scenario 1); from activation of a CRE in a cell type already present in Stage B (Scenario 2); from activity of a CRE in the Stage B-specific cell type (Scenario 3); or a combination of these mechanisms (Scenario 4). A CRE with lower signal strength in bulk data can be caused by changes solely in the cellular composition, for example if a CRE is not active in the stage B specific cell type which leads to a lower fraction of cell types in which the CRE is active (Scenario 5, see ‘cluster proportion’ graph on the top right). A CRE with unaltered signal strength can result from changes in multiple cell types that compensate each other (Scenario 6). Height of peaks indicates signal strength.
The development of single-cell epigenomic techniques offers a way to overcome some of these limitations by generating more comprehensive catalogs of CREs that enable the investigation of relationships between chromatin state changes at CREs and gene expression in specific cell types within primary tissues. These methods can overcome cellular heterogeneity, reveal cellular states under distinct physiological or pathological conditions, allow detection of unknown or rare cell types, and unravel cell-type-specific differences and dynamics. For example, cell-type specific profiles can help reveal whether a low signal detected in bulk datasets results from high signal in a limited number of cell types or low signal across the majority of cells in the sample (Figure 2b). When profiling dynamic processes during differentiation, development or disease, single cell epigenomics can untangle if changes in bulk profiles are due to changes in CRE activity in a cell type that transitions to another cell state, due to activity of this CRE in a new cell type, or simply due to changes in cellular composition (Figure 2c).
In this Review, we provide an overview of the general technical principles of single-cell profiling and discuss the current state of experimental single-cell platforms for profiling different epigenomic features, with a particular focus on methods for CRE annotation. We also discuss analytical tools for processing single-cell epigenomic datasets and characterizing the cell-type specific activities of CREs.
SINGLE-CELL EPIGENOMIC TECHNOLOGIES
General strategies for single-cell epigenomics.
Single-cell technologies can be generally categorized into three groups. The first group involves miniaturized versions of conventional bulk-cell assays, in which individual cells or nuclei are sorted or distributed into tubes or micro-wells, or captured in microfluidic reaction chambers, that each contain a unique barcode (Figure 3a). The resulting uniquely-tagged single-cell libraries are then combined for sequencing. As only one cell is barcoded per tube (or well or chamber), the throughput of this approach is limited to a few hundred to a few thousand, and the cost per cell is usually high. Thus, this approach is ideal for analyzing biological samples with a limited number of cells (such as early embryos) or profiling rare cell populations that can be sorted using flow cytometry.
Figure 3: Overview of technologies for barcoding single cells.
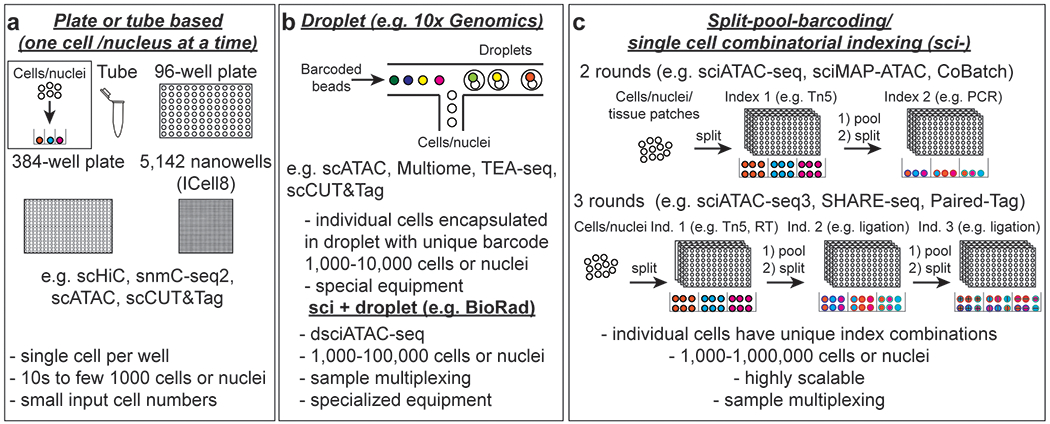
a In plate, tube, microfluidicsor nanowell chip-based assays, single cells are dispensed into individual wells or tubes or captured in reaction chambers where library preparation and molecular barcoding are carried out. These approaches usually have low throughput but can yield high coverage libraries. Plate and tube-based assays are well suited for rare cell types or assays that require high coverage such as DNA methylation and single-cell Hi-C. Throughput for plate-based assays can be increased using liquid handling robotics. IFC: Integrated fluidic circuit b Droplet-based assays allow ten thousand cells or nuclei to be profiled in parallel (left). An initial sample indexing step allows sample multiplexing prior to loading. If samples are indexed at the fragment level, channels can be superloaded to enable profiling of large numbers of cells for one sample or multiplexing of many samples. If a droplet contains more than one nucleus, sequencing reads can be assigned to individual samples or sublibraries with the initial sample index sequence.(right). Both sample and cell barcodes are used to assign reads to specific cells or nuclei. c Single-cell combinatorial indexing (sci-) or split-pool barcoding assays provide very high scalability and enables sample multiplexing by introducing a sample barcode in the first indexing round. After each indexing step nuclei are pooled and distributed to another set of plates for a total of 2 or more rounds. The cell barcode is composed of the combination of indexes from each round. With automation this approach delivers high data quality and reproducibility. RT: reverse transcription.
The second group of methods capitalizes on the rapid flow rates of droplet-based microfluidic platforms to achieve a higher throughput of up to ten thousand cells per library. In these approaches, barcoding occurs in liquid droplets that each contain a single cell (or nucleus) and a single bead coated with unique DNA oligos used to introduce cell-specific molecular barcodes. The droplets are usually resolved before library generation (Figure 3b). The availability of commercial platforms has enabled these methods to be widely adopted in laboratories. The high costs of current platforms can in part be compensated by introducing a sample-specific barcode prior to droplet-based single-cell barcoding, which enables sample multiplexing and profiling of up to a hundred thousand cells (Figure 3b).
The third group of methods use single-cell combinatorial indexing (sci) to achieve a throughput similar to, or higher than, droplet-based methods (Figure 3c). In this approach, cells are distributed into microtiter plates, with each well containing a group of cells rather than a single cell; all cells in the same well are tagged with the same barcode. After each round of indexing, cells from all wells are combined and redistributed into a new set of microtiter plates for another round of indexing. Sequencing reads are assigned to individual cells based on the index combination. (Figure 3c). The probability of two cells sharing the same combination of indexes can be limited by ensuring the number of indexes is high relative to the number of profiled cells. Thus, this approach can scale extraordinarily well by including additional rounds of indexing or by increasing the number of indexes in each round and can be adapted for a variety of molecular modalities. Furthermore, it enables sample multiplexing by introducing a sample-specific barcode in the first indexing round. An advantage of the combinatorial barcoding approach compared to commercial droplet-based approaches is its cost effectiveness. However, the experimental workflows are often complex. Moreover, several reagents required for some approaches, such as Tn5 enzymes, can be difficult to procure at cost-effectively or consistently.
All three single cell strategies have been used in recent years to develop methods for profiling distinct epigenomic features including DNA methylation, chromatin accessibility, histone modifications, and chromatin interactions. Initially developed to assess one modality at a time, advancements have been made to enable profiling of multiple epigenomic features and/or the transcriptome in parallel from the same cell (Tables 1 and 2).
Table 1:
Overview of single modality single-cell epigenomics methods.
| Method | Single cell principle | Description |
|---|---|---|
| DNA methylation (5mC) | ||
| scBS-seq39 | tube-based, single cell dispension | Individual cells are distributed, lysed and treated with bisulfite. Fragments are captured by several rounds of random priming. Primed fragments are amplified by index PCR. |
| scWGBS40 | plate-based, single cell dispension | Individual cells are added to wells, lysed and treated with bisulfite. Single stranded bisulfite-converted DNA is transcribed using tagged random hexamers and subsequently 3’ ends are also tagged. Tagged fragments are amplified by PCR to introduce sequencing adapters. |
| snmCseq41 and snmC-seq242 | plate-based, single cell dispension | Single nuclei are sorted into plates. Bisulfite conversion is carried out prior to indexing by random priming and extension. Libraries are generated using an adapter, compatible with single-stranded, bisulfite-converted DNA. SnmC-seq2 increases data quality by using a different random primer and inactivation of nucleotide triphosphates after extension. Automation of snmC-seq2 allows processing of 3,072 (eight 384 well plates) per experiment. |
| scRRBS45 | tube-based, single cell dispension | Cells are picked and transferred to a tube. DNA is digested by methylation insensitive Mspl to enrich for CG rich regions (for example, CpG islands) of the genome. After end repair and adapter ligation, DNA is bisulfite converted, PCR amplified, and size selected for sequencing. |
| scXRBS46 | plate-based, single cell dispension | Cells are sorted into individual wells. DNA is digested with Mspl and ligated to an indexed biotinylated adapter. After ligation wells are pooled and bisulfite conversion is performed on the pool. The second adapter is introduced using random hexamer extension prior to PCR amplification. Random hexamers help to rescue degraded fragments and enable measuring of regions with an isolated Mspl site. |
| sci-MET47 | split-pool (2 rounds) | Nuclei from crosslinked cells are distributed into wells and tagmentation is performed with indexed Tn5 without cytosines. After tagmentation nuclei are pooled, redistributed and bisulfite converted. After random priming and linear amplification, the second barcode is introduced by index PCR. |
| Chromatin accessibility | ||
| scDNAse-seq50 | plate-based, single cell dispension | Individual cells are sorted, and chromatin is digested with DNase I. Circular carrier DNA is added before end repair and adaptor ligation to minimize loss of digested fragments. Cells are indexed by PCR. |
| iscDNase-seq51 | split-pool (3 rounds) | DNase I digestion in bulk cells. Indexed P7 adaptor ligated in 96-well plates in bulk. After pooling and redistributing another index is introduced using PCR and finally the whole sample is marked by a third index introduced by PCR. |
| scATAC-seq52,53 | plate-based, single cell dispension | Nuclei are isolated and tagmented in bulk. Nuclei are sorted, lysed, and released DNA fragments are PCR amplified using indexed primers. |
| scATAC-seq54,55 | Strip-tubes/plates, single cell dispension | Individual nuclei are sorted into wells prior to tagmentation. Tagmentation is stopped with a Proteinase K solution. Tagmented DNA is bead purified and PCR amplified. |
| scATAC-seq56 | nanowell (SMARTer ICELL8, Takara Bio), single cell dispension | Cells are dispensed into wells of a 5,184 nanowell chip prior to tagmentation. Wells containing one living cell are selected for tagmentation and library preparation. |
| scATAC-seq57 | microfluidics chamber (Fluidigm) | Individual nuclei are tagmented and released DNA is PCR amplified in the integrated fluidic circuit (IFC). Amplified DNA is transferred to a 96-well plate for index PCR. |
| 10x scATAC-seq58 | droplet, 10x Genomics | Tagmentation without indexes. Tagmented DNA binds to barcoded beads in droplets. Initial amplification using linear amplification in droplets. Libraries are generated after pooling by PCR. |
| dsc/(dsci)ATAC-seq45 | (Indexing +) droplet (Bio-Rad) | Tagmentation with barcoded Tn5 to index at the molecular level. Tagmented nuclei are combined and encapsulated in droplets. Tagmented DNA binds to barcoded beads in droplets. The experiment can also be performed without indexing during tagmentation (dscATAC). |
| SNuBar-ATAC61 | indexing + droplet (10x Genomics) | Tagmentation with unindexed Tn5. The index at the nuclei level is introduced using an oligonucleotide adapter during tagmentation that is complementary to the universal part of the transposon and contains a PCR handle and sample. Tagmented nuclei are combined and encapsulated in droplets. |
| HyDrop-ATAC62 | droplet, custom | Tagmentation is performed in bulk without indexes before loading onto a custom, open-source droplet-based platform. Hydrogel beads dissolve in droplets and release indexed primers that anneal to DNA fragments. Initial amplification using linear amplification. Libraries are generated after pooling by PCR. |
| sciATAC-seq60 | split-pool (2 rounds) | Nuclei are isolated and distributed into 96-well plates. Bulk nuclei in each well are tagmented using indexed Tn5. After pooling and dispensing/sorting of 15-25 nuclei-well into new plates a second barcode is introduced using indexed PCR primers. Custom sequencing recipe and primers. |
| snATAC-seq67 | split-pool (2 rounds) | Based on the original sciATAC strategy60. Here, Tn5 is loaded with a different set of transposons (universal T5; indexed T7) to omit custom sequencing recipes. Liquid handling robotics is used for pipetting steps in 96-well plates. After tagmentation, nuclei are pooled and 20 nuclei/well are sorted into new plates to introduce second barcode using indexed PCR primers (universal i7; indexed i5). Custom sequencing primers. |
| sci-ATAC-seq363 | split-pool (3 rounds) | Tagmentation without indexes. Barcoding is performed through ligation (two rounds) followed by index PCR. Additional round of indexing increases scale. Custom sequencing recipe and primers. |
| sciATAC-seq68 | split-pool (2 rounds) | Based on the original sciATAC strategy60. Fixed cells are distributed to 96-well plates and permeabilized. Indexed Tn5 is added to the wells for tagmentation. After tagmentation, wells are pooled, centrifuged, resuspended and distributed across a new set of 96-well plates. Each well is reverse crosslinked with a proteinase K buffer prior to PCR with indexed primers. |
| sciMAP-ATAC70 | split-pool (2 rounds) | Small biopsies are added to wells as starting material for indexed tagmentation. Custom sequencing recipe and primers. |
| scTHS-seq71 | split-pool (2 rounds) | In ATAC-seq only 50% of molecules have forward and reverse adapter and can be amplified by PCR. Here, tagmentation with T7 promoter sequence and in vitro transcription are used to overcome this limitation. |
| S3-ATAC72 | split-pool (2 rounds) | In ATAC-seq only 50% of molecules have forward and reverse adapter and can be amplified by PCR. Here, single indexed adapter Tn5 and adapter switching are used to overcome this limitation. Tagmentation is performed using Tn5 with a single indexed adapter containing a uracil in the transposon sequence. Nuclei are pooled after tagmentation and redistributed into new plates. A uracil intolerant polymerase is used for gap fill in. An oligo containing a 3’ lock nuclei acid (LNA) is annealed to the unindexed fragment end. Fragments are extended to copy the oliqo sequence and are finally amplified by PCR using indexed primers. |
| Histone modifications and/or DNA binding proteins | ||
| scChIP-seq78 | droplet, custom | Cells are encapsulated with micrococcal nuclease (MNase). These droplets are merged with droplets containing barcoded oligonucleotides and the adaptors are ligated to the nucleosomes. Indexed chromatin fragments from 100 cells are used as input for ChIP. Profiled modification: H3K4me3 |
| scChIP-seq79 | droplet, custom | MNase digestion is followed by single cell barcoding of nucleosomes and pull down of pooled nucleosomes. For barcoding, nucleosome-containing droplets are fused with droplets containing hydrogel beads carrying barcoded DNA adapters. Subsequently the barcoded DNA adapters are cleaved off the beads with UV light and ligated to the nucleosomes. Profiled modification: H3K27me3 |
| itChIP-seq80 | split-pool (1 round) | Fixed individual cells are sorted into 96-well plates and incubated with SDS to open the chromatin. The genomic DNA is fragmented with barcoded Tn5 and indexed soluble chromatin is used as input for ChIP-seq library preparation. Profiled modification: H3K27ac |
| scChIC-seq84 | plate-based, single cell dispension | Cells are incubated with MNase-Protein A and antibody or MNase-Antibody complexes. After incubation, single cells are sorted and MNase is activated. Profiled modifications: H3K4me3, H3K27me3 |
| uliCUT&RUN85 | tube/plate-based, single cell dispension | Cells are sorted prior to incubation with primary antibody followed by incubation with MNase-Protein A. Profiled factors: SOX2/NANOG |
| iscChIC-seq86 | split-pool (2 rounds) | Fixed cells are incubated with MNase-Protein A and antibody complexes. MNase is activated and cells distributed to 96-well plate where barcoded adapters are ligated. Wells are pooled and redistributed into new set of plates where PCR indexing is performed. Profiled modifications: H3K4me3, H3K27me3 |
| scCUT&Tag83 | nanowell (SMARTer ICELL8, Takara), single cell dispension | Cells are permeabilized to isolate nuclei. Nuclei are incubated with primary antibodies and washed several times. Nuclei are incubated with pA-Tn5 in high-salt buffer, washed and tagmented. After tagmentation in bulk, nuclei are dispensed on the SMARTer ICELL8 single-cell system and cells are indexed during PCR amplification. Profiled modifications: H3K4me2, H3K27me3 |
| scCUT&Tag89 | droplet, 10x Genomics | Adaptation of CUT&Tag83. After tagmentation in bulk, nuclei suspensions are encapsulated into gel emulsions on a Chromium controller and libraries are prepared following the 10x scATAC-seq protocol. Profiled modification: H3K27me3 |
| scCUT&Tag90 | droplet, 10x Genomics | Adaptation of CUT&Tag83. After tagmentation in bulk, nuclei suspensions are encapsulated into gel emulsions on a Chromium controller and libraries are prepared following the 10x scATAC-seq protocol. Profiled modifications/factors: H3K4me3, H3K27ac, H3K36me3, H3K27me3, RAD21, OLIG2 |
| CoBATCH88 | split-pool (2 rounds) | Permeabilized fixed or non-fixed cells are first incubated with antibodies. Cells are sorted into wells containing protein A (pA)-Tn5 with unique combinations of T5 and T7 barcodes. After tagmentation, cells are combined and redistributed into another set of 96-well plate for PCR barcoding. Profiled modification: H3K27ac |
| iACT-seq87 | split-pool (2 rounds) | Antibodies are first incubated with barcoded protein A (pA)-Tn5. These complexes are then added to permeabilized cells and incubated to bind to chromatin. Cells are combined, sorted into a 96-well plate and tagmentation is started. After tagmentation, DNA in each well is purified using phenol-chloroform extraction and transferred to new tubes for PCR barcoding. Profiled modification: H3K4me3 |
| sciTIP-seq91 | split-pool (2 rounds | Adaptation of CUT&Tag83, but using indexed transposons with T7 promoter sequence similar to scTHS-seq71 to overcome the limitation that only 50% of tagmented fragments can be PCR amplified. Cells are tagged with primary and secondary antibodies in bulk, then distributed to 96-well plates for indexed pA-Tn5 binding and tagmentation. After tagmentation, cells are pooled and redistributed to another plate for in vitro transcription followed by index PCR in the same well. Profiled modification/factors: H3K27me3, H3K27ac, H3K9me3, CTCF, RNA Pol II |
| Chromatin architecture | ||
| scHi-C95 | plate-based, single cell dispension | Crosslinking, restriction enzyme digestion, biotin fill-in and ligation are performed in bulk nuclei. Nuclei are selected under a microscope and libraries generated |
| scHi-C96 | plate-based, single cell dispension | This protocol combines imaging and scHiC. Cells are crosslinked in bulk. Nuclei are extracted and sorted into wells. Nuclei are imaged, overlaid with agarose and permeabilized. Restriction enzyme digestion, biotin fill-in and ligation are performed in individual wells. Libraries are generated either by adapter ligation or tagmentation. |
| snHi-C97 | plate-based, single cell dispension | Crosslinking, restriction enzyme digestion and ligation are performed in bulk or in individual nuclei. Biotin steps are omitted to increase fragment numbers. After ligation, whole genome amplification is performed prior to library preparation. |
| Dip-C98,99 | plate-based, single cell dispension | Crosslinking, restriction enzyme digestion and ligation are performed in bulk. Biotin-related steps are omitted, and an efficient transposon based whole-genome amplification with multiplex end-tagging amplification is performed. |
| scHi-C100 | plate-based, single cell dispension | Crosslinking, restriction enzyme digestion and ligation are performed in bulk. Nuclei are dispensed in a 96-well plate, tagmented with Tn5 and biotinylated fragments are bound to beads. Fragments are amplified from the beads with PCR using indexed primers. |
| sciHi-C101,102 | split-pool (2 rounds) | Crosslinked nuclei are distributed into 96-well plates after restriction enzyme digestion. The first barcode is introduced during biotinylated adapter ligation. After pooling and redistribution another barcode is introduced using another round of adapter ligation. |
| s3-GCC72 | split-pool (2 rounds) | Crosslinked nuclei are distributed into 96-well plates after restriction enzyme digestion and ligation. Biotin-related steps are omitted. Libraries are prepared using single indexed adapter Tn5 and adapter switching as in s3-ATAC-seq72. |
| scSPRITE103 | split-pool (3 rounds for nuclei, 3 rounds for chromatin clusters) | Crosslinking, restriction enzyme digestion is performed in bulk. Nuclei are distributed across a 96-well plate and fragmented DNA in each nucleus is tagged by ligation with a unique cell barcode through three rounds of split-pooling. A small subset of nuclei is sonicated to shear the chromatin. Crosslinked chromatin is bound to magnetic N-hydroxysuccinimide beads. Bead-bound chromatin complexes are barcoded for another three rounds to generate unique label for clusters in close spatial proximity. Detects multiway contacts. |
scBS-seq, single-cell bisulfite sequencing; scWGBS, single-cell whole genome bisulfite sequencing, snmC-seq, single nucleus methylcytosine sequencing; scRRBS, single-cell reduced representation bisulfite sequencing; XRBS, single-cell extended-representation bisulfite sequencing, sci-MET, single-cell combinatorial indexing for methylation analysis; scDNAse-seq, single-cell DNase sequencing; iscDNase-seq, indexing single-cell DNase sequencing; scATAC-seq, single-cell assay for transposase-accessible chromatin with high-throughput sequencing; dscATAC-seq, droplet single-cell assay for ATAC-seq; dsciATAC-seq, droplet-based single-cell combinatorial indexing for ATAC-seq; SNuBar-ATAC, single nucleus barcoding approach for ATAC-seq; HyDrop-ATAC, hydrogel-based droplet microfluidics for scATAC-seq; sciATAC-seq, single-cell combinatorial indexing ATAC-seq; snATAC-seq, single-nucleus ATAC-seq; sciMAP-ATAC, single-cell combinatorial indexing on microbiopsies assigned to positions for ATAC-seq; scTHS-seq, single-cell transposome hypersensitive sites sequencing; s3-ATAC, Drop-ChIP, Droplet-based single-cell chromatin immunoprecipitation sequencing, scChIP-seq, single-cell chromatin immunoprecipitation followed by sequencing; sc-itChIP-seq, single-cell indexing and tagmentation-based ChIP-seq; scChIC-seq, single-cell chromatin immunocleavage sequencing; uliCUT&RUN, ultra-low input cleavage under targets and release using nuclease; iscChIC-seq, indexing single-cell immunocleavage sequencing; scCUT&Tag, single-cell cleavage under targets and tagmentation; CoBATCH, combinatorial barcoding and targeted chromatin release; iACT-seq, indexing antibody-guided chromatin tagmentation sequencing; scTIP-seq, single-cell targeted insertion of promoters sequencing; scHi-C, single-cell HiC; Dip-C, diploid chromatin conformation capture; snHi-C, single-nucleus Hi-C, single-cell combinatorial indexing Hi-C; s3-GCC, symmetrical strand single-cell combinatorial indexing genome conformation capture; scSPRITE, single-cell split-pool recognition of interactions by tag extension;
Table 2:
Overview of multi-modality single-cell epigenomics methods.
| Method | Single cell principle | Description |
|---|---|---|
| DNA methylation + RNA | ||
| scM&T-seq38 | plate-based, single cell dispension | Individual cells are sorted. After lysis, polyadenylated mRNA is captured using biotinylated oligo dT primers and separated from the DNA using strepatavidin-coupled magnetic beads. Single-cell full length transcriptome libraries and single cell bisulfite libraries are generated. |
| scMT-seq106 | tube-based, single cell dispension | Individual cells are picked and incubated in a drop of cell lysis buffer in a tube. After cell lysis, nuclei are transferred with a micro pipette to another tube. Single-cell full length transcriptome libraries for cytosolic RNA and scRRBS libraries are generated. |
| scTrio-seq107 and scTrio-seq108 | tube-based, single cell dispension | Individual cells are mouth pipetted into tubes and lysed. After cell lysis, nuclei are pelleted, and the supernatant is transferred to another tube. Single-cell transcriptome libraries for cytosolic RNA and scRRBS libraries are generated. Copy number variation (CNV) detection as third modality. |
| Chromatin accessibility + RNA | ||
| sciCAR109 | split-pool (2 rounds) | RNA is reverse transcribed with an indexed oligo(dT) primer followed by tagmentation with indexed Tn5. After one round of split-pooling and second strand synthesis, nuclei are lysed and separated for RNA and ATAC library preparation. The second index is introduced by PCR during library preparation. |
| SNARE-seq110 | droplet, custom | Nuclei are tagmented using Tn5 without index. Nuclei are encapsulated in droplets and a splint oligonucleotide is added to link tagmented DNA to oligo(dT) barcoded beads. After reverse transcription, separate libraries for cDNA and tagmented DNA are generated. |
| SNARE-seq2115 | split-pool (4 rounds) | Adaptation of SNARE-seq to combinatorial indexing. |
| Paired-Seq111 | split-pool (5 rounds) | Tagmentation precedes reverse transcription with sample specific indexes for both DNA and RNA. Barcodes are introduced through 3 rounds of ligation. After preamplification, product is split for DNA and RNA library preparation. DNA and RNA products are distinguished by molecule specific restriction enzyme sites. |
| SHARE-seq112 | split-pool (3 rounds) | Fixed nuclei are first tagmented and then reverse transcribed with a biotinylated indexed primer. Barcodes are introduced through 3 rounds of hybridization. After reverse crosslinking, cDNA is bound to streptavidin beads and separated from the supernatant containing tagmented DNA for library preparation. |
| ASTAR-seq113 | microfluidics chamber (Fluidigm) | Nuclei are first tagmented in the integrated fluidic circuit (IFC) and after quenching of the transposition RNA is reverse transcribed and cDNA amplified using biotinylated primers. Products are removed from the IFC and cDNA and tagmented DNA separated using streptavidin beads. |
| scCAT-seq114 | plate-based, single cell dispension | Cells are lysed, and the nucleus is separated from the cytoplasm by centrifugation. Separate libraries for chromatin accessibility and full-length transcriptomes are generated. |
| Chromium Single Cell Multiome ATAC + Gene Expression | droplet, 10x Genomics | Nuclei are tagmented using Tn5 without index. Nuclei are encapsulated into droplets with beads containing indexed adapters for both tagmented DNA and RNA. After breaking of the emulsion, tagmented DNA and cDNA are amplified by PCR and separated for library construction. |
| SNuBar-ARC61 | indexing + droplet (10x Genomics) | Tagmentation with Tn5. The index at the nuclei level is introduced using an oligonucleotide adapter during tagmentation that is complementary to the universal part of the transposon and contains a PCR handle, sample barcode and a polyA tail. |
| Histone modifications + RNA | ||
| Paired-Tag117 | split-pool (4 rounds) | This assay is a combination of CUT&Tag83 and Paired-Seq111. Histone modifications are targeted by antibody and indexed pA-Tn5 followed by indexed reverse transcription. After reverse transcription, nuclei are pooled and redistributed into new plates. After two more rounds of indexing by ligation, nuclei are pooled, preamplified and then split for RNA and DNA library preparation. DNA and RNA products are distinguished by molecule specific restriction enzyme sites. Profiled modifications: H3K4me1, H3K4me3, H3K27ac, H3K9me3, H3K27me3 |
| CoTECH116 | split-pool (2 rounds) | A modification of CoBATCH56 to enable simultaneous measurement of RNA. Histone modifications are targeted by antibody and indexed Protein-Tn5 followed by indexed reverse transcription. After reverse transcription, nuclei are pooled, redistributed into new plates and preamplified. After preamplification, products are split into two plates and a second set of indexes is introduced using indexed primers for DNA and RNA component, respectively. Profiled modifications: H3K4me3, H3K27ac, H3K27me3 |
| scSET-seq118 | plate-based, single cell dispension | Single cells are transferred to wells of a 96-well plate. Cells are lysed, and nuclei bound by Concanavalin A coated magnetic beads. The supernatant with RNA is transferred to another plate. Histone modifications are targeted by antibody and indexed pA-Tn5. Cytoplasmic RNA is reverse transcribed and mRNA/cDNA hybrids are tagmented with indexed Tn5. Profiled modifications: H3K4me3, H3K27me3 |
| Chromatin accessibility + protein | ||
| ASAP-seq120 | droplet, 10x Genomics | Cells are incubated with antibody-oligonucleotide conjugates against cell surface proteins. After fixation and permeabilization without lysis, cells are used as input for 10x scATAC with the addition of a bridge oligo that enables binding of the antibody-oligonucleotide conjugates to the index coated beads. |
| Pi-ATAC122 | plate-based, single cell dispension | Cells or tissues are fixed and permeabilized. Cells are incubated with an antibody and transposition is performed in bulk. Tagmentation is quenched and single cells are sorted into wells using index sorting to record antibody signal. Libraries are generated with indexed PCR primers after reverse crosslinking. |
| PHAGE-ATAC123 | droplet, 10x Genomics | Cells are incubated with nanobody-displaying phages to recognize and bind surface antigens. Cells are fixed, lysed and used as input for 10x scATAC. Phages express a PHAGE-ATAC tag (PAC-tag) that contains an Illumina Read1 sequence and a hypervariable genetic barcode that binds to the oligo coated beads in the droplets. Workflow is compatibe with ASAP-seq |
| Chromatin accessibility + RNA + protein | ||
| DOGMA-seq120 | droplet, 10x Genomics | Based on ASAP-seq but combined with 10x scMultiome instead of 10x scATAC. No need for bridge oligo. |
| TEA-seq121 | droplet, 10x Genomics | Cells are incubated with antibody-oligonucleotide conjugates against cell surface proteins. After permeabilization without lysis, cells are used as input for 10x scMultiome. |
| NEAT-seq125 | droplet, 10x Genomics | Cells are fixed, lysed and nuclei permeabilized. Nuclei are preincubated with ssDNA oligos and antibody oligo conjugates are preincubated with single stranded DNA from E coli (EcoSSB). Nuclei are incubated with antibodies against nuclear pore complex with hash tag oligos (HTO) and against transcription factors with antibody-derived tags (ADT). HTO and ADT contain a poly-A sequence. After incubation, nuclei are used as input for 10x scMultiome. |
| Histone modifications + Protein | ||
| scCUT&Tag-pro124 | droplet (10x Genomics) | Based on ASAP-seq120. Cells are incubated with oligonucleotide-conjugated antibodies against cell surface proteins. Cells are fixed and permeabilized without lysis. Cells are incubated with primary antibodies against a histone modification, followed by secondary antibodies and pA-Tn5. After tagmentation, cells are loaded onto the Chromium controller and libraries generated following the 10x scATAC-seq protocol. Profiled modifications: H3K4me1, H3K4me2, H3K4me3, H3K9me3, H3K27ac, H3K27me3 |
| DNA methylation + Chromatin accessibility | ||
| scNOMe-seq127 | plate-based, single cell dispension | Nuclei are isolated and treated in bulk with M.CviPI which methylates GpC dinucleotides at nucleosome free chromatin. Individual nuclei are sorted, lysed, bisulfite converted, and sequencing libraries are prepared. |
| scCOOL-seq126 and iscCOOL-seq128 | plate-based, single cell dispension | Nuclei are isolated and treated in bulk with M.CviPI which methylates GpC dinucleotides at nucleosome free chromatin. Individual nuclei are sorted, lysed, bisulfite converted, and sequencing libraries are prepared. In iscCOOL-seq a tailing- and ligation-free method for library prep is used to increase the mapping rates |
| DNA methylation + Chromatin accessibility + RNA | ||
| scNMT-seq129 | plate-based, single cell dispension | Nuclei are treated with M.CviPI which methylates GpC dinucleotides at nucleosome free chromatin. Libraries are generated following the scM&T-seq strateqy. |
| snmCAT-seq48 | plate-based, single cell dispension | Nuclei or cells are treated with M.CviPI to methylate GpC dinucleotides at nucleosome free chromatin. No physical separation of RNA and DNA. 5’-methyl-CTP is added during reverse transcription for full length transcriptomes. Bisulfite conversion and library preparation as in snmC-seq2. 5’-methyl-CTP in cDNA are not converted to uracil during bisulfite conversion, whereas a fraction of DNA cytosines is unmethylated and converted to uracil. Sequencing reads are assigned to RNA and DNA libraries based on the original mC density. |
| scNOMeRe-seq130 | tube-based, single cell dispension | Single cells are transferred to tubes by mouth pipetting. Cells are lysed and nuclei are bound to magnetic beads. Supernatant with RNA is transferred to another tube for library preparation using multiple annealing and dC-tailing-based quantitative single-cell RNA-seq (MATQ-seq) strategy. Nuclei are treated with M.CviPI to methylate GpC dinucleotides and lysed followed by bisulfite conversion and library preparation. |
| Heterochromatin + Chromatin accessibility | ||
| scGET-seq131 | droplet, 10x Genomics | Tn5 fused to chromodomain of HP-1α to target H3K9me3 regions (TnH). Nuclei are tagmented using Tn5 without index to target open chromatin followed by incubation with TnH to target H3K9me3 regions. Libraries are generated with 10x ATAC. Profiled modifications: H3K9me3 |
| Multiple histone modifications from the same cell | ||
| scMulti-CUT&Tag132 | Droplet, 10x Genomics | Adaptation of CUT&Tag83. Antibodies against distinct histone modifications are incubated with indexed pA-Tn5. Antibody-pA-Tn5 conjugates are purified and antibodies against two histone modifications are mixed. Samples are incubated with antibody-pA-Tn5 mixtures. After tagmentation, nuclei are encapsulated into gel emulsions on a Chromium controller and libraries are prepared following the 10x scATAC-seq protocol with slight modification. Profiled modifications: H3K27ac, H3K27me3 |
| DNA methylation + chromatin architecture | ||
| scmethylHiC133 | plate-based, single cell dispension | Crosslinking, restriction enyzme digestion and ligation are performed in bulk. Individual nuclei are sorted into wells (96--well plate). After bisulfite conversion libraries are generated. |
| snm3C-seq134 | plate-based, single cell dispension | Crosslinking, restriction enyzme digestion and ligation are performed in bulk. Single nuclei are sorted into wells (384-well plate). DNA is reverse crosslinked, and bisulfite converted. Libraries are generated using snmC-seq224. |
scM&T-seq, single-cell genome-wide methylome and transcriptome sequencing; scMT-seq, single-cell methylome and transcriptome sequencing; scTrio-seq, single-cell triple omics sequencing; sciCAR, single-cell combinatorial indexing chromatin accessibility and mRNA; SNARE-seq, single-nucleus chromatin accessibility and mRNA expression sequencing; Paired-Seq, parallel analysis of individual cells for RNA expression and DNA accessibility by sequencing; SHARE-seq, simultaneous high-throughput ATAC and RNA expression with sequencing; ASTAR-seq, assay for single-cell transcriptome and accessibility regions; scCAT-seq, single-cell chromatin accessibility and transcriptome sequencing; SNuBar-ARC, single nucleus barcoding approach for chromatin accessibility and RNA expression co-profiling; Paired-Tag, parallel analysis of individual cells for RNA expression and DNA from targeted tagmentation by sequencing; CoTECH, combined assay of transcriptome and enriched chromatin binding; scSET-seq, same cell epigenome and transcriptome sequencing in single cells; ASAP-seq, ATAC with select antigen profiling by sequencing, Pi-ATAC, protein-indexed assay of transposase accessible chromatin with sequencing; TEA-seq, transcription, epitopes, and accessibility with sequencing; NEAT-seq, sequencing of nuclear protein epitope abundance, chromatin accessibility and the transcriptome in single cells; scCUT&Tag-pro, single-cell cleavage under targets and tagmentation with cell surface proteins; scNOMe-seq, single- cell nucleosome occupancy and methylome-sequencing; scCOOL-seq, single-cell chromatin overall omic-scale landscape sequencing; iscCOOL-seq, improved single-cell chromatin overall omic-scale landscape sequencing; scNMT-seq, single-cell nucleosome, methylation and transcription sequencing; snmCAT-seq, single-nucleus methylcytosine, chromatin accessibility, and transcriptome sequencing; scNOMeRe-seq, single-cell nucleosome occupancy, methylome and RNA expression sequencing; scGET-seq, single-cell genome and epigenome by transposases sequencing; scMethyl-HiC, single-cell DNA methylation with HiC, snm3C-seq, single-nucleus methyl-3C sequencing
An ideal single-cell assay would capture all regulatory elements that can be identified by a given epigenetic mark (or combination of marks) in each individual cell and enable profiling of thousands of cells in parallel. One general challenge of adapting bulk assays to the single cell level is that data are often sparse for individual cells, that is only a small fraction of the epigenetic feature of interest can be detected in each cell or nucleus. Moreover, data sparsity is a bigger problem for single cell epigenomic assays than single cell transcriptomic assays for two key reasons. First, whereas a cell can contain several hundred transcripts per gene, most cell types have only two copies of DNA for each epigenetic feature in the genome. Second, the human genome contains ~63,000 genes31, but millions of potential regulatory elements4,25,26. Together these factors lead to considerably lower library complexity (the number of unique reads or fragments per cell) and lower coverage (the fraction of peaks (or for DNA methylation, the fraction CpG dinucleotides) for each cell or nucleus than a corresponding bulk dataset. Data sparsity can be addressed either by increasing the sensitivity of the assay or increasing the cell numbers. Progress has been made in both areas in recent years, with a major focus on increasing the throughput of cells assayed for each sample, enabled by droplet- and combinatorial barcoding-based approaches. These advances are particularly helpful for profiling complex tissues such as the brain. On the other hand, maximizing the coverage per cell is critical when total cell numbers are limited such as in embryonic development. Another important aspect of a single cell assay is its specificity, that is, its ability to deliver a high fraction of reads in regions containing the epigenetic feature of interest and low read numbers regions lacking the feature. A potential confounder for single cell assays is if more than one cell or nucleus share the same barcode or index combination. Rates of such doublets or barcode collision can be assessed for individual assays by processing a mixture of samples from different species. Finally, assays initially developed using cell lines, single cell suspensions of PBMCs (peripheral blood mononuclear cells) or individual tissues frequently require further optimization to be applied to different tissues and/or sample storage conditions.
Single-cell profiling of DNA methylation.
5’-methylcytosine (5mC) in the context of CpG dinucleotides is the predominant form of DNA methylation in the animal genome32. In mammalian cells, cytosine methylation levels are regulated by DNA methyltransferases (DNMT1, DNMT3a and DNMT3b) and the TET family of methylcytosine dioxygenases, which have a central role in the demethylation process33,34. DNA methylation has long been thought to play a repressive role in gene expression. Accordingly, the levels of methyl-CpG at CREs are frequently inversely correlated to their usage and activity, leading to the use of low levels or no cytosine DNA methylation for identification of active or primed CREs in mammalian genomes (Figure 1b)32. By contrast, recent studies have identified a more complex relationship between DNA methylation and transcription factor binding to the DNA. While cytosine methylation can prevent DNA binding by many transcription factors, it may also facilitate DNA binding by others35. Furthermore, cytosine methylation in non-CG contexts has been observed in embryonic stem cells and many neuronal cell types, in which it seems to mediate local transcriptional repression by recruiting repressor proteins such as MeCP236. Therefore, genome-wide, base-pair resolution mapping of cytosine methylation is not only important to annotate candidate CREs but also to inform about its effects on transcription factor binding or gene expression.
DNA methylation can be probed at single base resolution with whole genome bisulfite conversion and sequencing (WGBS) based methods. This approach typically requires tens of thousands of cells due to significant loss of DNA in the bisulfite conversion reactions and low efficiency of DNA amplification. In contrast with conventional WGBS, in single cell protocols bisulfite treatment precedes adapter tagging to limit loss37. Several strategies have been developed for single cell WGBS (Table 1). Plate-based single-cell WGBS approaches are low-throughput, but can detect up to 50% of CpG dinucleotides per cell38–40. Indeed, optimized library preparation strategies in recent protocols have sufficiently improved the mapping rates, throughput, and library complexity to enable profiling of complex tissues such as the mouse and human brain41,42. The high coverage per cell generated by these whole genome approaches enables characterization of DNA methylation states at both promoters and promoter-distal CREs. However, because of the relatively high sequencing cost, usually only a fraction of the DNA methylome is profiled per cell or nucleus (~1.5 million reads or ~6% CpGs covered per cell). Thus, typically DNA methylation profiles from 200-300 cells of the same type or lineage are aggregated to detect a complete set of cCRE43,44. Plate-based single-cell reduced representation bisulfite sequencing (RRBS) is a cost-effective approach that enables genome-wide high coverage profiling of CpG-rich regions, such as promoters, and modest to low coverage of regions with lower CpG density, such as enhancers45,46. The newest iteration expands coverage at low density regions, but still captures less than half of cCREs that could be detected by WGBS46. Single-cell combinatorial barcoding WGBS enables scalable generation of single-cell methylomes albeit with a sparse coverage of 0.10% to 4.5% CpGs per cell from mouse cortex47. This coverage is sufficient to identify cell clusters with similar methylation profiles, but will require large cell numbers to study individual CREs.
Of these methods, only plate-based single cell WGBS assays are sufficiently robust and mature to map CREs in complex tissues such as the mouse44 and human brain41,48. However, because of their high cost and relatively low throughput in the absence of automation, these assays have been slow to be broadly adapted.
Single-cell profiling of chromatin accessibility.
Inactive CREs are generally embedded in compact chromatin fibers and are inaccessible to transcription factors. Binding of pioneer transcription factors to nucleosomal DNA at CREs initiates the recruitment of nucleosome remodeling complexes, leading to displacement of local nucleosomes, which enables the binding of additional transcription factors to the CREs, assembly of transcription machinery at the promoter, and transcription of genes in specific cell lineages49. Displacement of nucleosomes at active CREs also renders the underlying DNA susceptible to digestion by endonucleases (such as DNase-I) or to double strand breaks generated by transposases (such as Tn5). Hence, treatment of chromatin with these enzymes followed by high throughput DNA sequencing, as in DNase-Seq and ATAC-seq, has been broadly used to probe chromatin accessibility and identify active CREs in specific cell or tissue types13–15 (Figure 1b). Conventional bulk chromatin accessibility profiling using DNase-Seq require chromatin from thousands (ATAC-seq) to millions of cells (DNase-seq), and thus adapting them for the low input of single cells has been a key challenge. Both plate-based50 and combinatorial barcoding-based single-cell DNase-seq protocols51 have been developed (Table 1) but have not been broadly adopted, in large part due to the complexity of the protocols. By contrast, the ability of Tn5 to insert an oligonucleotide adaptor for subsequent PCR amplification makes ATAC-seq readily adaptable for single-cell assays (scATAC-seq), and protocols have been developed for microwell52–55 or nano-well plate56, microfluidic57, droplet-based58,59 and combinatorial barcoding platforms60 (Table 1). Plate-based protocols are particularly helpful for profiling rare cell types with low absolute abundance that can be identified using a lineage tracer or antibodies and usually capture 104-105 unique fragments52–54,56.
Droplet-based scATAC-seq approaches produce high complexity libraries with 104-105 unique fragments per nucleus57–59, and the commercial solution from 10x Genomics achieves throughputs of up to 10,000 nuclei per sample58. Higher throughputs of up to 50,000 nuclei per microfluidics channel can be achieved at reduced cost with dsciATAC-seq, in which tagmentation [G] with indexed transposomes [G] is performed prior to encapsulation on a Bio-Rad system to tag each DNA fragment created by tagmentation with a sample-specific barcode to enable sample multiplexing59. SNuBar-ATAC also enables sample multiplexing by adding barcoded oligonucleotides to the tagmentation reaction but, because tagging occurs at the level of the nucleus, cell throughput is not increased61. However, this approach does not require customized Tn5 transposomes, which can present a hurdle to adoption of other approaches. Lastly, HyDrop-ATAC is an open-source, non-commercial, cost-effective droplet-based solution with excellent signal-to-noise ratios but potential obstacles to its wide adoption include the currently lower complexity than commercial solutions (~4k fragments/nucleus)62, the need for specially trained personnel and the upfront cost to build and operate a custom droplet-based platform.
Single-cell combinatorial indexing ATAC-seq (sci-ATAC-seq) can profile 103-105 individual cells or nuclei by implementing two or three rounds of split-and-pool barcoding60,63. Variants of this protocol have increased the sequencing library complexity from a few thousand unique reads60 to up to 43,532 unique reads/nucleus64. Further, it can be applied to fresh60,64, frozen63,65–67 or lightly fixed63,65,68 samples and tissues63–67,69. In sciMAP-ATAC, tagmentation is performed on small tissue punches to link accessible chromatin profiles to spatial localization70, and an ultra-high-throughput version using three rounds of indexing was able to profile ~800,000 single nuclei from 59 human fetal tissue samples in only three experimental batches, with a median of 6,042 unique fragments/nucleus63. However, the enrichment of reads at transcriptional start sites, a measure of the signal-to-noise ratio, was lower using three-round versus two-round barcoding63. One study showed that at a median depth of 5,000 fragments/cell and about 1,000 cells are sufficient to comprehensively detect the open chromatin regions in a neuronal cell type43. The maximum fragment yield of ATAC-seq is theoretically limited to 50% of all tagmentation events because only DNA fragments with a forward and reverse primer sequence after tagmentation can be PCR amplified. Thus, approaches have been developed to overcome this limitation71,72. One of these methods, symmetrical strand sci-ATAC (s3-ATAC), dramatically increased the library complexity to ~100,000 unique reads/nucleus from mouse brain and human cortex72.
Single cell chromatin accessibility profiling has been widely adopted and it is exciting to see both new iterations of combinatorial indexing workflows that offer exceptional throughput and library complexity and recent approaches that combine combinatorial barcoding with droplet platforms. These methods will contribute to large-scale mapping efforts, such as the Human Cell Atlas73, by facilitating cost-effective profiling of millions of cells across hundreds of samples in parallel to reveal CREs that are accessible (and presumably active) only in very rare cell types and to unravel the dynamics of cCREs during development or disease. These techniques would therefore expand upon current single-cell chromatin accessibility atlases in both breadth and depth.
Single-cell profiling of histone modifications and transcription factor binding.
Covalent modifications of histone proteins, including H2A, H2B, H3 and H4 and their variants, are integral to transcriptional regulation5,74. Histone modification profiling in cultured cells or tissues has shown that promoters are associated with H3K4me3, whereas enhancers are associated with H3K4me175. Both classes of CREs are also associated with other histone modifications that can further inform about their activation state76,77. Consequently, genome-wide profiling of histone modifications helps to both identify potential CREs and characterize their activities. Genome-wide profiling of transcription factor binding site occupancy can also be used to identify candidate CREs including insulators, which are bound by CTCF and the cohesin complex3 (Figure 1b).
ChIP-seq has long been used to profile histone modification and transcription factor binding in bulk samples. In such procedures, antibodies that recognize specific histone modifications or transcription factors are used to enrich the bound chromatin fragments from nuclear extracts via immunoprecipitation before high throughput DNA sequencing. However, the efficiency of chromatin immunoprecipitation can be low, making it particularly challenging to perform ChIP-seq with individual cells. In single-cell ChIP-seq approaches, chromatin from individual cells is first fragmented into individual nucleosomes using MNase (micrococcal nuclease, which cuts the linker DNA between nucleosomes)78,79 or Tn580, and then indexed in droplets78,79 or wells of a microtiter plate. Indexed nucleosomes from different cells are pooled and used as input for chromatin immunoprecipitation. Protocols tend to be executed on homebuilt microfluidics devices. The complex workflow78,79 and modest throughput80 hamper their ability to be used for tissue profiling.
Methods based on chromatin immunocleavage (ChIC)81 offer an alternative to ChIP-seq. In these approaches, the enzyme used to fragment the chromatin (MNase in CUT&RUN82 or Tn5 in CUT&Tag83) is fused to a primary antibody (specific to the modification or protein of interest) or to Protein A (which binds to primary antibodies); this approach eliminates the need for fragmentation prior to antibody incubation steps, while increasing sensitivity and reducing background. This experimental strategy has been adapted to single cells, and MNase fusion protein-based approaches have been used to profile H3K4me3 and H3K27me3 in a few hundred white blood cells (scChIC-seq)84 and transcription factors in individual mouse embryonic stem cells (uliCUT&RUN)85. A recent iteration using multiple rounds of indexing (iscChIC-seq) dramatically increased the throughput to >10,000 white blood cells per experiment, which could open the door to tissue profiling86.
Approaches based on ProteinA-Tn5 (pA-Tn5) fusion proteins have been used to profile histone modifications in intact unfixed cells83,87,88. Unlike ChIP-seq or CUT&RUN, no multi-step library preparation is required83,87,88, which reduces cell loss. However, the need to minimize pA-Tn5 bias towards open chromatin using high-salt conditions poses a significant challenge for profiling transcription factor binding, which tends to be transient. Libraries generated using pA-Tn5 for histone modifications showed improved peak calling at lower sequencing depth, with a higher fraction of reads in peaks, compared to both CUT&RUN and ChIP-seq83. In protocols adapted to single cells, pA-Tn5 tethering and tagmentation is performed in bulk before indexing is performed on individual cells in nanowells (scCUT&Tag)83,89 or on the widely available 10x Genomics droplet-based microfluidics system (10x scCUT&Tag)89,90. When 10x scCUT&Tag was applied to mouse brain using antibodies targeting four histone modifications (H3K4me3, H3K27me3, H3K36me3, H3K27ac) and two DNA binding proteins90, the data were sufficient to cluster and annotate major cell types, despite the low library complexity (98 – 453 median unique fragments/cell for histone modifications). In another study, the library complexity for profiling H3K27me3 in two glioblastoma samples was higher (3,643 and 16,232 median reads/cell), but the number of profiled cells per dataset was relatively low for a droplet-based system (1,311 and 1,168 cells)89. In pA-Tn5 based protocols following a combinatorial indexing strategy, CoBatch88 and iACT-seq87, barcoding is performed at the PCR step and with indexed transposons loaded onto pA-Tn5. In CoBatch antibodies are first incubated with permeabilized cells, whereas in iACT-seq antibodies are first incubated with indexed Tn5. CoBatch yielded ~4-fold more complex libraries than iACT-seq87,88 and similar or higher reads per cell than published 10x scCUT&Tag. To profile the cis-regulatory diversity of endothelial cell lineages in E16.5 mouse embryos, CoBatch was performed for H3K27ac and H3K36me3, yielding libraries with an average of ~7,000-10,000 reads/cell88. Another promising combinatorial indexing-based alternative, scTIP-seq, uses tagmentation with T7 promoter sequences and in vitro transcription prior to index PCR to achieve several fold higher reads per cell in two cell lines for both histone modifications and DNA binding proteins compared to other pA-Tn5 based approaches91.
It is exciting to see the breadth of new approaches for profiling histone modifications and transcription factor binding in single cells. Although a systematic comparison between these methods is not yet available due to the use of different sample types and/or profiled modifications, 10x scCUT&Tag is poised to become widely adopted owing to the wide availability of the commercial 10x Genomics platform and the relative simplicity of the protocol. However, a number of current limitations may hamper its broader use, including low library complexity coupled with the low number (only a few thousand) of nuclei that pass quality control per dataset89,90 and the need to generate Tn5 fusion proteins in-house, which can lead to variability between laboratories. MNase-based protocols are currently the most promising approach for single-cell profiling of chromatin-bound proteins such as CTCF or transcription factors90,91.
Single-cell profiling of chromatin architecture.
Chromosomes in interphase nuclei are folded into domains (TADs and sub-TADs) and A/B compartments21, and this 3D-chromatin organization [G] enables distal enhancers to be positioned close to their target gene promoters in space. TADs are formed during early embryogenesis and are stably maintained through development. In dividing cells, TADs disappear during mitosis and are re-established in early G192,93. It is now generally agreed that TADs are the result of dynamic loop-extrusion mediated by the cohesin complex, which is stalled at paired convergent CTCF binding sites on the chromatin fiber94. TADs are thought to contribute to developmentally regulated gene expression by promoting contacts between promoters and enhancers within the same TADs while reducing the chance of interactions between promoters and enhancers located in different TADs 3 (Figure 1b). Thus, understanding chromatin architecture can help identify target genes of CREs.
Several methods have been developed to capture higher order chromatin structures using one-cell-at-a-time or combinatorial barcoding approaches (Table 1). The most widely-used methods are adaptations of the conventional Hi-C protocol, which utilizes proximity ligation of DNA regions to profile chromatin architecture24. Chromatin in crosslinked nuclei is fragmented and biotinylated, and the biotinylated fragments are then ligated in situe, pulled down with streptavidin and finally amplified for sequencing24. This long multiday approach typically requires hundreds of thousands of cells because of DNA loss and the relatively low efficiency of DNA amplification. In the initial single-cell Hi-C protocol, only 10 T-helper cells were assayed with 11,159–30,671 contacts (proximity ligated DNA fragments) detected in each cell95. This low number of contacts and cells revealed megabase-scale chromatin domains but not chromatin loops95, and uncovered a high degree of variability in chromatin architecture between individual cells95,96. By contrast, a protocol that omitted biotin-related steps achieved a median of 0.34 million long-range chromatin contacts in individual oocytes97 and this increase in detected contacts enabled analysis of TADs and chromatin loops97. Dip-C achieves even higher library complexity using a transposon-based whole-genome amplification method, generating a median of up to 1.04 million contacts/cell in a lymphoblastoid cell line and 0.84 million in peripheral blood mononuclear cells (PBMCs)98. A streamlined protocol version enabled profiling of 3,646 cells in the developing mouse cortex and hippocampus to reveal 13 cell clusters based on 3D genome structure (annotated with cell type labels after integration with transcriptomes) and detected 3D reconfiguration after birth99. Lastly, Tn5-based library preparation after cell-sorting and automation of several steps enabled profiling of chromatin interaction in 1,992 mouse embryonic stem (mES) cells with 0.13 million long range contacts per cell100. Using combinatorial barcoding, thousands of nuclei can be profiled per experiment, but these data are several magnitudes sparser than other single-cell Hi-C methods101,102. Using a Tn5-based library strategy increased the contact numbers per cell by ~14.8 fold (~0.1 million contacts)72. Very recently, single-cell SPRITE (split-pool recognition of interactions by tag extension) was introduced to map compartments, TADs and interchromosomal interactions in individual mouse embryonic stem cells103. This method uses several rounds of split-pool barcoding to tag fragmented DNA with a nucleus-or cell-specific barcode followed by a spatial barcode for the DNA fragments that were in close proximity; it detects several fold more pairwise contacts (and multiway contacts) at a lower sequencing depth than single-cell HiC103. It will be interesting to see how scSPRITE will perform on tissue samples.
To date, due to high cost, limited throughput, and data sparsity of single-cell Hi-C, chromatin conformation profiling in single cells has not been widely adopted for tissue profiling. In addition, analysis of single-cell Hi-C data is hampered by the limited knowledge of cell type-specific contacts that could serve as markers for cell type annotation comparable to marker gene expression or accessible chromatin at marker gene loci.
Single-cell multi-omics assays.
The wide array of single-cell epigenomic technologies for molecular profiling of one modality at a time have provided insight into gene regulation in diverse samples and cell types. However, single modality datasets can only provide a partial picture of the complex interplay between different epigenetic modifications and gene expression. Assays that profile multiple modalities from the same cell could help to improve our understanding of the relationships between CRE activity and gene expression or between different epigenetic features104 (Table 2). Multimodal assays can help resolve situations in which CRE activity and gene expression are not directly correlated. For example, the activity of a CRE or a set of CREs may be modulated without changes in gene expression, or the changes in CRE activity and gene expression may occur on different time scales during development or early disease stages. Furthermore, multiomics data could also help to map different modalities to a common reference such as the large single-cell transcriptomics atlases105. Thus, many multiomics assays are designed to detect gene expression together with epigenomic marks.
A challenge to advancing from single modality to multimodal assays is that experimental conditions in single modality assays are optimized for the modification of interest, and might not be ideal for other modalities, such as reverse transcription of RNA for RNA sequencing (RNA-seq), tagmentation in Tn5-based approaches, bisulfite conversion to profile DNA methylation, or crosslinking in HiC. The order in which experimental steps are performed in multimodal assays can also affect the experimental outcome. Despite these challenges, single cell multiomics approaches for many combinations of molecular features are rapidly emerging (Table 2), making use of strategies such as physically separating DNA and RNA components or converting distinct molecules into a unified form that can be profiled together. Here, we first discuss assays that profile individual epigenomic marks in combination with transcriptomes and/or protein abundance, followed by methods that profile multiple epigenomic features in an individual cell.
In early work, plate- or tube-based single cell cytosolic transcriptomes were analyzed in parallel with DNA methylation after physical separation of nuclei and cytoplasm. The methods were used to profile epigenetic and transcriptional heterogeneity in small sets of embryonic stem cells, sensory neurons or hepatocellular carcinoma cells38,106,107 and, for example, analysis of both transcriptomes and DNA methylomes for genetic lineages of colorectal tumor cells revealed that methylomes differ between genetic lineages but are relatively stable within a lineage during metastasis108. However, the required physical separation poses a significant challenge for application to frozen tissues that often only allow nuclei isolation and simultaneous profiling of DNA methylation and RNA from the same nucleus was just recently accomplished48.
Protocols for joint profiling of transcriptomes and accessible chromatin using ATAC-seq from the same cell have been developed on multiple technological platforms109–115 and a droplet-based version is commercially available from 10x Genomics (Chromium Single Cell Multiome ATAC + Gene Expression). Notably, more complex ATAC sequencing libraries are achieved by performing tagmentation of the chromatin prior to reverse transcription of mRNA109,112. Illustrating the potential of multiomic measurements to improve our understanding of developmental gene regulation, combined analysis of accessible chromatin and gene expression in mouse skin using SHARE-seq revealed that chromatin accessibility increased at regulatory regions prior to activation of gene expression, indicating that chromatin changes can prime cells for cell-type specific gene expression during lineage commitment112.
Another group of multiomic assays combine pA-Tn5 based targeting of histone modifications83 with nuclear RNA profiling followed by barcoding using split-and-pool 116,117 or plate-based platforms118. Although these assays measure one histone modification at a time, the shared transcriptomic datasets can be used for integration of data from multiple histone marks. Paired-Tag uses four rounds of combinatorial indexing to dramatically increase the number of cells that can be profiled in one experiment, up to a million cells per experiment 116,117. Its utility was demonstrated by analyzing five histone marks, each in conjunction with nuclear RNA-seq, in adult mouse frontal cortex and hippocampus. The combined profiles of histone modifications and RNA-seq improved clustering resolution compared to individual histone marks alone117.
Protein measurements have been previously combined with single-cell transcriptomics for analysis and/or pooling (hashing)119, but methods have recently been developed to profile the abundance of specific proteins and chromatin accessibility in the same cell120–123. Such combinations can be particularly useful for profiling immune cells with well-established surface proteins to achieve high resolution clustering and annotation followed by projection of sparse epigenomic profiles onto the cell clustering. Two groups independently combined protein tagging with the commercial Multiome platform (10x Genomics) to profile protein abundance, chromatin accessibility and gene expression in parallel120,121. Lastly, 173 surface protein measurements and scCUT&Tag for six histone modifications were combined for PBMCs. Here, the protein abundances can be used as a shared reference for data integration (similar to the transcriptomic modality in the examples above) and inference of chromatin states from intersecting histone patterns’ revealed dynamic changes of repressive chromatin during CD8 T cell maturation124. Since the activity of CREs is regulated by transcription factors and RNA expression levels don’t always correlate with protein levels or activity, a recent study improved intranuclear protein detection to measure transcription factor protein levels together with chromatin accessibility and gene expression in CD4 memory T cells125. Indeed for one of five master transcription factors, GATA3, protein levels but not RNA expression was correlated with motif enrichment and only cells with high GATA3 protein showed allelic imbalance of chromatin accessibility at a CRE that contains a genetic variant disrupting a GATA motif125.
Using a shared reference, such as transcriptomes or a set of protein abundances, enables data integration from different epigenomic layers, but profiling multiple epigenomic layers from the same cell might provide additional insight into their crosstalk. Indeed, both DNA methylation and chromatin accessibility can be assessed in the same cell using the GpC Methyltransferase M.CviPI which methylates GpC dinucleotides at nucleosome free chromatin DNA, prior to bisulfite conversion126–128. Combined with full length transcriptomes it enables three modalities to be captured in parallel48,129,130.
Changes in both accessible chromatin and repressive H3K9me3 chromatin domains are associated with diseases, including cancer, and these relationships together with genetic information from the underlying DNA sequence can be profiled using a combination of regular Tn5 and a Tn5 fused to the chromodomain of heterochromatin protein-1α (HP-1α), a protein that binds to H3K9me3 domains131. For even more versatile profiling of different chromatin states for analysis of their interplay during gene regulation, approaches such as multi-CUT+Tag are emerging that analyze several histone modifications in the same cell 132.
As mentioned above, application of single-cell Hi-C in tissue profiling is in part hampered by the difficulty of cell clustering and annotation. To overcome this hurdle, single-cell Methyl-HiC133 and snm3C-seq134 have been developed to simultaneously profile chromosome conformation and DNA methylation. DNA methylation patterns allowed clustering and annotation of cell types, while the aggregated chromatin contacts in each cell cluster revealed TADs and cell-type specific contacts between enhancers and target genes134. Finally, DNA methylation clusters can serve as a common reference to integrate snm3C-seq data with other datasets, such as joint DNA methylation, chromatin accessibility and transcriptomes profiles and thus enabled insight into the regulatory relationships in 63 cell types in the human frontal cortex48.
The methods mentioned in this section are poised to improve our understanding of the interplay between different molecular layers and how CREs affect gene expression. As the majority of these methods are just emerging, further optimization to improve the robustness and reproducibility is necessary for them to be broadly adapted. Commercial droplet-platforms are now available for combined single cell ATAC-seq and RNA-seq.
SINGLE-CELL EPIGENOMIC DATA ANALYSIS
Single cell epigenomics data presents unique analytical challenges including its high dimensionality and sparsity, significant cell-to-cell variability, and frequent batch effects. Therefore, methods developed to map and characterize CREs from conventional bulk epigenomic assays cannot be directly used, and new analytical strategies are needed. Single-cell epigenome data analysis can be generally broken down into three primary tasks: data processing and clustering; integration with other single-cell modalities; and identification and characterization of candidate CREs (cCREs).
Data Processing and Cell Clustering.
In data processing and clustering, raw sequence data from single-cell epigenome assays are translated into clusters that correspond to cell-types or lineages (Figure 4a). Initial pre-processing of raw sequence data uses DNA barcodes to allocate reads to individual cells and filter out low quality cells or nuclei based on read depth or measurements of signal-to-noise ratios (such as transcriptional start site enrichment (TSSe)). Quality control checks of the resulting cells are then performed both in ‘bulk’ as well as per individual cell and depend on the specific type of epigenomic data being profiled. Further preprocessing then converts read fragments into a read count matrix of cells by features, which depending on the assay and analysis strategy can be genomic regions (such as peak calls, sliding windows or gene promoters) or sequence k-mers. The resulting matrix is transformed and, optionally, feature selection is used to retain only a subset of regions, for example those with strongest signal or highest variability.
Figure 4: General workflow for analysis of single-cell epigenomics datasets.
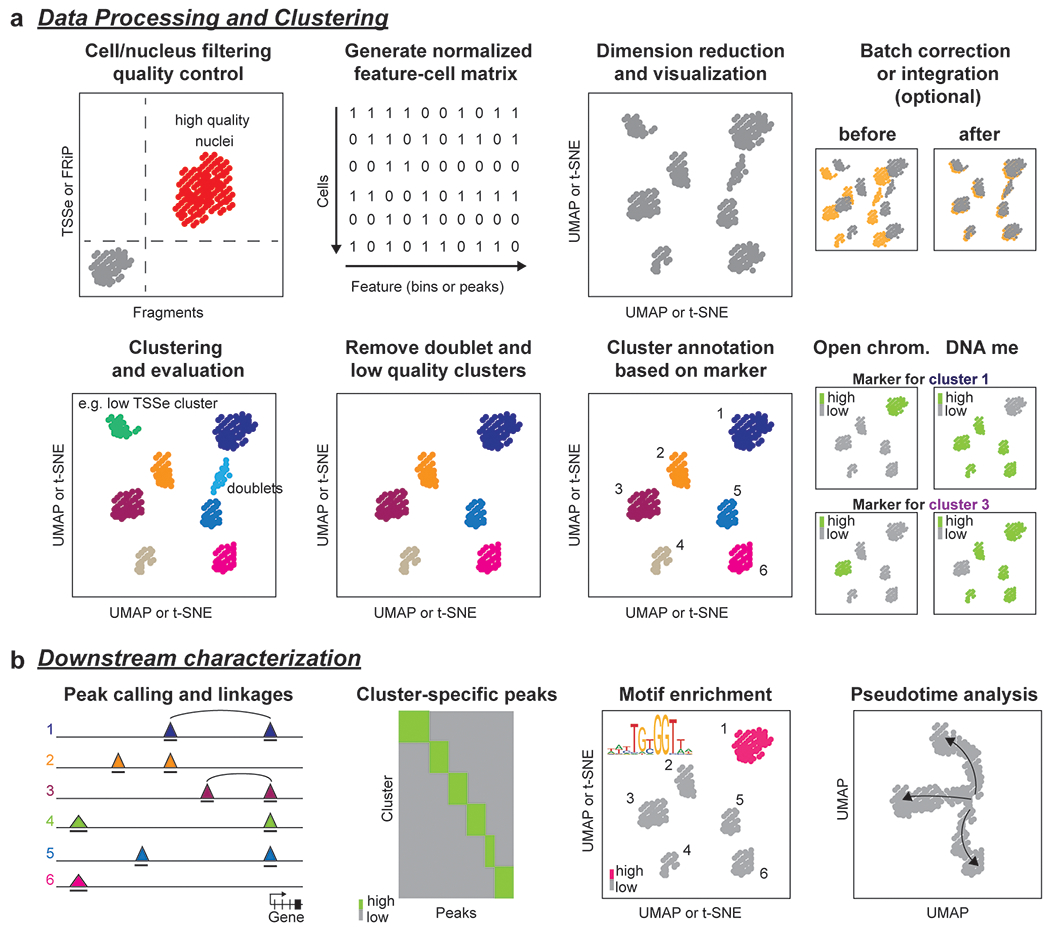
a After preprocessing and mapping, high quality nuclei or cells are detected using quality control criteria such as transcriptional start site enrichment (TSSe) for scATAC-seq, fraction of reads in peaks (FRiP) or the number of fragments/reads per nucleus. Next, a normalized cell-feature matrix is generated followed by dimension reduction and visualization in 2D space. Datasets from different modalities can be integrated to increase cell-type resolution and, if processing datasets from multiple experimental batches, batch correction might be necessary. b The nuclei are first grouped into clusters, then cell clusters with low quality or representing likely doublets are removed from downstream analysis. High quality clusters are annotated using, for example, high chromatin accessibility or low DNA methylation levels at marker gene loci. c Downstream analysis is exemplified for chromatin accessibility datasets. Reads from all nuclei from a cluster are combined to a cell-type-specific pseudobulk dataset to call peaks (triangles indicate signal pile-up and bold lines underneath tracks indicate peak regions) from scATAC-seq. Distal elements can be linked to target genes by assessing if two sites are accessible in the same cell (co-accessible sites are indicated by black arcs). If datasets were integrated with scRNA-seq data or data were generated using joint profiling of RNA and chromatin accessibility, accessibility of distal elements can be associated to putative target gene expression levels. To further characterize gene regulatory networks, cCREs are identified as peaks in each cell cluster followed by analysis of transcription factor motifs or footprints within the cCREs. Single-cell epigenomics data can also be used to generate pseudotime trajectories for analysis of developmental or cell state transitions. Here, computational integration or joint profiling of RNA and chromatin from the same cell can provide insight into the crosstalk and differences in timing between chromatin dynamics and gene expression changes.
A critical step in the analysis of single cell epigenomic data is dimension reduction, which creates the lower-dimensional space necessary for clustering of cells. The high dimensionality and sparsity of single cell epigenomic profiles creates unique challenges for dimension reduction, and therefore requires different approaches than for single cell gene expression. A popular approach that has been implemented in numerous tools60,135,136 is latent semantic indexing (LSI), a technique frequently used in natural language processing where the sparse count matrix is transformed using term frequency-inverse document frequency (TF-IDF) and singular value decomposition (SVD) is then used for dimension reduction. Another approach137 implements spectral embedding, where the sparse count matrix is transformed into a cell-cell similarity matrix which is used for dimension reduction. Other approaches include topic modeling138, which defines a set of ‘topics’ describing similar features, and variational autoencoders139, which encode features using neural networks. After transformation of the count matrix and dimension reduction, clustering is then performed using methods such as K-means140, density-based spatial clustering with noise (DBSCAN)141, Louvain142, or Leiden algorithms143, and the clusters are visualized using t-distributed stochastic neighbor embedding (t-SNE)144 or Uniform Manifold Approximation and Projection (UMAP)145. The clusters are further processed to remove low-quality and doublet cells146–148 and finally annotated using the relative levels of the epigenetic mark at the promoter or gene body of known cell type specific marker genes.
Numerous analysis tools have been developed to perform single cell epigenome data processing, dimension reduction, clustering, and cluster annotation, including Signac135, SnapATAC137, ArchR136, EpiScanpy149, cisTopic138, chromap150, cellranger-atac58 and others59,139,151–154 (Table 3). Due to the wider availability of single-cell assays to profile accessible chromatin, most analysis tools have been developed for this modality, although these tools could also be co-opted for other epigenomic profiles. Given the many differences between these methods, the ‘optimal’ choice of method depends on the specific application, taking into account factors such as the technology used, the complexity of the tissue being profiled, the biological questions being asked, available computing resources and ease of use. For example, methods that use genomic windows (such as SnapATAC137) may be better at detecting rare cell types than methods that use ‘bulk’ peak calls (such as Signac135) as regions active in rare cell types will be underrepresented by ‘bulk’ peaks. Perhaps the biggest difference in performance between methods results from the data transformation and dimension reduction steps, even among methods that use the same technique. For example, both Signac135 and ArchR136 use LSI, but ArchR uses multiple rounds of LSI to iteratively identify and retain only the most variable peak calls in order to reduce noise in clustering. Conversely, cisTopic138, which uses topic modeling, has superior performance to LSI and other methods when analyzing low coverage data. cisTopic138 also performs clustering by cCRE in addition to by cell, which facilitates downstream analyses of cCREs and transcriptional regulators. SnapATAC137 uses the spectral embedding approach for data transformation followed by dimension reduction, which allows the recovery of clusters that take on more complicated manifold structures in feature space155 and performs particularly well at resolving closely-related cell clusters137.
Table 3:
Overview of key analytical tools for single-cell epigenomic data
| Method | Description | Exemplary studies with application in human tissues |
|---|---|---|
| Data processing and clustering | ||
| ArchR136 | Iterative latent semantic indexing using read counts in genomic windows followed by cluster-specific peak calls | Clustering of 70k nuclei from 10x scATAC-seq of isocortex, striatum, hippocampus, and substantia nigra181. |
| Signac156 | Latent semantic indexing using read counts in peak calls | Clustering of 27k nuclei from kidney 10x scATAC-seq184, 81k nuclei from motor cortex SNARE-seq2182, 44k nuclei from pituitary gland 10x scATAC-seq186. |
| Cusanovich et al60 | Latent semantic indexing using read counts in genomic windows and cluster-specific peak calls | Clustering of 1.6k nuclei from pancreatic islet sciATAC-seq187, 35k nuclei from bone marrow and blood 10x scATAC-seq194, 63.8k nuclei from bone marrow and blood 10x scATAC-seq58, 791k nuclei from sciATAC-seq3 of fetal tissue63, 31k nuclei from fetal cortex 10x scATAC-seq191. |
| SnapATAC137 | Spectral embedding using Jaccard similarity of read counts in genomic windows | Clustering of 79.5k nuclei from heart snATAC-seq195, 616k nuclei from snATAC-seq of 30 tissues30, 12.7k nuclei from kidney 10x scATAC-seq198, 12.5k nuclei from frontal cortex snATAC-seq48 |
| Scanpy202/EpiScanpy149 | Principle components analysis of read counts in genomic windows, peak calls, or other features | Clustering of 91k nuclei from lung snATAC-seq188, 15k nuclei from pancreatic islet snATAC-seq199, 131.5k nuclei from islet and PBMCs snATAC-seq and 10x scATAC-seq196. |
| cisTopic138 | Latent Dirichlet allocation of read counts in peak calls | - |
| SCALE139 | Variational autoencoder of read counts in peak calls | - |
| BROCKMAN151 | Principle components analysis of sequence k-mer counts | - |
| Scasat153 | Multidimensional scaling using Jaccard similarity of read counts in peak calls | - |
| Cell Ranger ATAC58 | Latent semantic analysis of read counts in peak calls | Clustering of 10x scATAC-seq of 7k nuclei from atherosclerotic lesions197. |
| AllCools | Consensus clustering using Leiden algorithm on principle components of DNA methylation levels in genomic windows. | |
| Data integration | ||
| Seurat integration (v3)156 | Diagonal and horizontal integration using canonical correlation analysis | Diagonal integration of 130k nuclei from prefrontal cortex snATAC-seq with snRNA-seq192, 7k nuclei of 10x scATAC-seq from atherosclerotic lesions with snRNA-seq197, 31k nuclei from fetal cortex 10x scATAC-seq with snRNA-seq191, 81k nuclei from motor cortex SNARE-seq2182, 79.5k nuclei from heart snATAC-seq with snRNA-seq195, skeletal muscle 10x scATAC-seq, 10x scMultiome with snRNA-seq200, bone marrow and blood 10x scATAC-seq with snRNA-seq194. |
| Liger166 | Diagonal and horizontal integration using integrative non-negative matrix factorization | Diagonal integration of skeletal muscle 10x scATAC-seq, 10x scMultiome with snRNA-seq200 |
| SingleCellFusion48 | Diagonal and horizontal integration using mutual nearest neighbors | Diagonal integration of frontal cortex snmCAT-seq and snATAC-seq48. |
| SnapATAC137 | Horizonal integration using landmark diffusion maps | Horizontal integration of 79.5k nuclei from heart snATAC-seq195, 616k nuclei from sci-ATAC-seq of 30 tissues30. |
| EpiScanpy149 | Horizonal integration using batch-corrected k-nearest neighbors | - |
| ArchR136 | Horizontal integration using estimated latent semantic indexing | - |
| MNN158 | Horizontal integration using mutual nearest neighbors | Horizontal integration for batch correction of prefrontal cortex 10x scATAC-seq192, snATAC-seq of 30 tissues30, heart snATAC-seq195. |
| Harmony157 | Horizontal integration using linear mixed model correction | Horizontal integration for batch correction of pancreatic islet snATAC-seq199, pancreas and PBMCs 10x scATAC-seq and snATAC-seq196, lung snATAC-seq188, isocortex, striatum, hippocampus and substantia nigra 10x scATAC-seq181, sci-ATAC-seq3 of 15 fetal tissues63, kidney 10x scATAC-seq184. |
| Symphony159 | Horizontal integration for reference mapping using linear mixed model correction | - |
| Seurat WNN (v4)161 | Vertical integration using weighted nearest neighbors | Vertical integration of 15k nuclei from 10x scMultiome in pituitary gland186. |
| MOFA+162 | Vertical integration using stochastic variational inference | - |
| Downstream analysis | ||
| Cicero175 | Co-accessibility between peak calls and cis-co-accessibility networks using graphical LASSO | Analysis of co-accessible sites in pancreatic islet snATAC-seq199, pancreas and PBMCs 10x scATAC-seq and snATAC-seq196, lung snATAC-seq188, heart snATAC-seq195, skeletal muscle 10x scATAC-seq200, prefrontal cortex 10x scATAC-seq192, atherosclerotic lesion 10x scATAC-seq197, 10x scATAC-seq of isocortex, striatum, hippocampus, and substantia nigra181, kidney snATAC-seq184, bone marrow and peripheral blood snATAC-seq58. |
| ChromVAR174 | Sequence motif enrichment using bias-corrected deviations | Sequence motif enrichments of cells in pancreatic islet snATAC-seq199, pancreas and PBMCs 10x scATAC-seq and snATAC-seq196, atherosclerotic lesion 10x scATAC-seq197, kidney 10x scATAC-seq184, prefrontal cortex 10x scATAC-seq192, heart snATAC-seq195, fetal cortex 10x scATAC-seq191, bone marrow and peripheral blood 10x scATAC-seq58. |
| Monocle (v2)177 | Pseudo-time trajectory ordering using reverse graph embedding | Pseudo-time ordering of cells in 10x scATAC-seq of atherosclerotic lesions197. |
| Monocle (v3)178 | Pseudo-time trajectory ordering using partitioned approximate graph abstraction | Pseudo-time ordering of cells sites in pancreatic islet snATAC-seq199, prefrontal cortex 10x scATAC-seq191,192, sci-ATAC-seq3 of 15 fetal tissues63, kidney 10x scATAC-seq184. |
| Slingshot179 | Pseudo-time trajectory ordering using simultaneous principal curves | - |
| Destiny180 | Pseudo-time trajectory ordering using diffusion maps | - |
| Signac135 | Multiple methods including peak calling, cluster-specific differential peaks, peak-to-gene links, and transcription factor footprinting | Cluster-specific differential peaks in 10x scATAC-seq of atherosclerotic lesions197, kidney 10x scATAC-seq184, Peak-to-gene links in skeletal muscle 10x scMultiome200. |
| ArchR136 | Multiple methods including peak calling, cluster-specific differential peaks, gene activity, peak-to-gene links, transcription factor footprinting, and pseudotime trajectory ordering | Cluster-specific analyses of isocortex, striatum, hippocampus, and substantia nigra 10x scATAC-seq181, transcription factor footprinting and peak-based analysis in prefrontal cortex 10x scATAC-seq192. |
| SnapATAC137 | Multiple methods including peak calling, cluster-specific differential peaks, and peak-to-gene links | Cluster-specific differential peaks in kidney 10x scATAC-seq198. |
| AllCools | Differential methylated regions and genes | |
ArchR, single-cell analysis of regulatory chromatin in R, SnapATAC, single nucleus analysis pipeline for ATAC-seq, Scanpy, single cell analysis in python; EpiScanpy, epigenomics single cell analysis in python; cisTopic, cis-regulatory topic modeling on single-cell ATAC-seq data; SCALE, single-cell ATAC-seq analysis via latent feature extraction; BROCKMAN, Brockman representation of chromatin by K-mers in mark-associated nucleotides; Scasat, single cell ATAC-seq analysis tool; LIGER, linked Inference of genomic experimental relationships; MNN, mutual nearest neighbour, WNN, weighted nearest neighbor, MOFA+, multi-omics factor analysis
One major analytical challenge moving forwards is the increasing number of samples and cells being profiled in single-cell epigenome studies. When processing data from the same modality across multiple samples or batches together, ‘horizontal’ integration can be performed to remove batch effects from the low-dimensional space prior to clustering using tools such as Seurat156, Harmony157, MNN (mutual nearest neighbors)158 and others. An alternative to processing data from all cells together is to perform a related form of horizontal integration, whereby a reference map representative of all cell types for a tissue is first created and then other cells are projected onto this reference in low-dimensional space159. This form of horizontal integration can also be performed using data from a single study; for example, in SnapATAC137 and ArchR136 the cell matrix is sampled to identify highly informative ‘landmark’ cells and create a low-dimensional embedding that the remaining cells are then projected into. These methods for horizontal integration can reduce the computational burden associated with processing and enable more efficient clustering and cell type assignment of large numbers of cells.
Integration with other Single-Cell Modalities.
Single-cell epigenomic profiles can be combined with other molecular modalities, for example transcriptome, protein abundance, or other epigenomic data types, to increase the resolution of cell type and sub-type identity over that provided by the individual single-cell epigenomic data modality alone, and to enable downstream correlative analyses comparing profiles across multiple levels of ‘-omic’ data between groups of closely related cells. There are two primary forms of cross-modality data integration, ‘vertical’ and ‘diagonal’, depending on whether the data is generated from the same cells or different cells, respectively (reviewed in ref.160). In vertical integration, data are combined from multiple assays generated from the same cell (Table 2). For example, in weighted nearest neighbors (WNN)161, vertical integration consists of pre-processing, dimension reduction, and k-nearest neighbors for each modality individually, followed by weighting to combine data across modalities. Therefore, modalities with greater resolution will contribute more to the resulting nearest neighbor graph. The WNN graph, which is representative of all modalities, is then used for downstream clustering and visualization. Several additional vertical integration approaches have been developed, such as MOFA+162, scAI163, CiteFuse164 and totalVI165.
In ‘late-stage’ and ‘intermediate-stage’ diagonal integration, data from different single-cell assays generated from different cells are combined after the data are already processed and embedded or prior to embedding, respectively. For example, in Seurat integration156,161, late-stage diagonal integration of scATAC-seq and scRNA-seq is performed by converting scATAC-seq profiles into a common gene unit, using canonical correlation analysis (CCA) of the gene units from both modalities, and then identifying anchor cells between the two datasets. Using these anchors, the labels of cells from the scRNA-seq embedding are then transferred onto the scATAC-seq cell embedding. Gene expression profiles can be further imputed in scATAC-seq cells, which then enables co-embedding of both data types together. For intermediate-stage integration in LIGER166, scATAC-seq or other epigenomic data are again first converted to a gene-based unit. Gene-based matrices across modalities are then normalized and subject to iterative non-negative matrix factorization (iNMF), which produces a low-dimensional space containing all cells from which downstream clustering can be performed. Another method SingleCellFusion48 performs intermediate-stage integration by converting modalities to a common unit, identifying nearest neighbors using highly correlated features across modalities, and imputing missing modalities using the profiles of nearest neighbors in the target modality. Additional methods for diagonal integration of different single-cell modalities include Conos 167, SOMatic 168, and MATCHER 169.
Identification and characterization of candidate CREs.
The clusters are next used to define cCREs and gain biological insight into cell type-specific gene regulation (Figure 4b). Downstream analyses can be performed using the same analysis packages as used for processing and clustering, such as Signac135, ArchR136 and SnapATAC137, or using stand-alone tools developed for specific analyses.
In each cell type cluster defined from a single-cell epigenome assay, a typical task is to identify regions of the genome, or ‘peaks’, with enriched signal in the cell type. Such peaks are considered ‘candidate’ CREs (cCRE), as their molecular function needs to be further characterized. The standard for identifying cCREs consists of translating single-cell profiles into a ‘pseudo-bulk’ profile per cell type by aggregating reads for that cell type, and then applying computational methods developed for conventional bulk assays. For example, a peak caller such as MACS2170 can be used to identify cCREs from pseudo-bulk chromatin accessibility profiles. The result is a catalog of cCREs in each cell type and their strength of activity. Furthermore, the activity of cCREs can be compared across cell types to identify cCREs whose signals are stronger in a specific cell type or group of cell types relative to others, which can reveal sets of cCREs regulating specialized cellular processes. As with conventional bulk data, the pseudo-bulk profiles for each cell type cluster can be converted to normalized read depth signal and visualized as a track on a genome browser, such as UCSC171, IGV 172, or WashU Epigenome Browser173.
A key step in the analysis of single-cell epigenome assays that identify cCREs is defining transcriptional regulators of cCRE activity in each cell type. For example, chromVAR174 performs sequence motif enrichment in the accessible chromatin profiles of each cell by determining the relative accessibility of the cell among peaks containing a given motif compared to the average accessibility across cells. Sequence motifs with high variability in enrichments across cells indicate motifs preferentially enriched in one or several cell types relative to others. Motif enrichments from chromVAR can also be used in integrative analyses with single-cell gene expression data to identify transcription factor genes whose expression is highly correlated with motif enrichments across cells or cell types. These results can reveal transcriptional regulators that act in each cell type, or that regulate specific sets of cCREs, as well as transcriptional regulators with enriched activity in individual cells which can be used to, for example, identify regulators of heterogeneous sub-populations within a cell type.
A major challenge in annotating the genome is determining the target genes of cCRE activity. Methods have been developed that leverage single-cell profiles to predict cCRE target genes. Single-cell co-accessibility, which measures the correlation in accessibility between pairs of cCREs across cells, determined using methods such as Cicero175, can help to link cCREs to target gene promoters. Cicero further calculates an ‘activity’ score (the composite accessibility of both the promoter and cCREs co-accessible with the promoter) for each gene, as well as cis-co-accessibility networks (CCANs) of highly correlated sites. However, co-accessibility methods rely on epigenomic profiles, which are an imperfect proxy for gene expression. Single-cell profiles co-embedded across modalities, either from multiomic assays or via diagonal integration, can also be used to derive co-activity between modalities by linking epigenomic activity to gene expression directly using methods implemented in ArchR and SnapATAC136,137,148. A key limitation of co-accessibility and co-activity methods is that they rely on correlations which may not always reflect true cis regulatory effects. The target genes of cCRE activity can also be predicted using chromatin interactions in each cell type derived from single cell Hi-C-based assays. A recent method, SnapHiC176, performs chromatin loop calling in cell types by comparing normalized contact probabilities of genomic bins to a local background across cells for each cell type. Target gene prediction based on physical interactions can therefore provide orthogonal evidence to correlation-based methods, although the methods for single cell Hi-C have not yet been widely adopted.
Finally, projecting cells onto a pseudo-time trajectory is commonly performed with single cell RNA-seq data to study dynamic processes such as cell cycle, development, cellular response to external stimuli, or disease progression. Approaches developed for single cell RNA-seq data, such as Monocle177,178, Slingshot179 and Destiny180, have been applied to single cell epigenomic profiles. As with other analyses described above, many of these tools are implemented within analysis packages in addition to stand-alone tools137,148. These epigenomic trajectories can infer the dynamic activity cCREs and transcriptional regulators. A more recent approach, Chromatin Velocity, leverages similar concepts from single cell RNA-seq data analysis to further predict the rate, directionality and future fate of cells progressing through a dynamic process by comparing ratios of active and closed chromatin131. These results can then be used to identify cCREs and transcriptional regulators likely driving state transitions within or between cell types.
CONCLUSIONS AND FUTURE PERSPECTIVES
Single-cell epigenomics approaches promise to greatly improve our knowledge of cis-regulatory elements in the genome by providing information on the cell-type specificity of each annotated element. Recent years have seen rapid development of methods to assay different layers of the epigenome in single cells, including DNA methylation, chromatin accessibility, histone modifications and chromatin interactions. Protocols for profiling some of these features, such as chromatin accessibility and DNA methylation, are relatively mature and have been broadly used for human tissue profiling. By contrast, most methods for profiling histone modifications or performing multiomics measurements from the same cell currently have not progressed far beyond the proof-of-principle stage. However, we expect that further optimization and cross validation will soon make these protocols robust, reproducible, scalable, and widely applicable. Robust and widely shared protocols or affordable commercial solutions will be foundational to gaining a comprehensive understanding of the dynamic activity of CREs across developmental or disease stages in every cell type in the body.
Single-cell epigenome profiles of both abundant and rare cell types across organs and species has improved the characterization of cCREs in these genomes. For example, human datasets have revealed differential cCRE between sub-types and cellular states in major cell types in the brain41,44,67,181,182, blood58,183, and other tissues30,63,184–189, and suggested candidate transcriptional regulators responsible for the transition of cellular states during development185,189,191 and in pathogenesis192–194. Excitingly, the new cell-type-resolved catalogs of cCREs further enabled identification of disease relevant cell types and facilitated the interpretation of noncoding risk variants in the human genome30,181,187,195–200.
Application of single-cell epigenomics to biomedical research and precision medicine still faces several important hurdles. First, the vast majority of clinical biospecimens are embedded in paraffin after fixation (FFPE; Formalin-fixed, paraffin-embedded), a condition that is incompatible with most single cell epigenomics assays, which typically require freshly collected or flash frozen tissue samples as input. To make the best use of the clinical information associated with archival biospecimens, robust single-cell epigenomics techniques compatible with FFPE or other common storage conditions need to be developed. Second, current single-cell epigenomics approaches typically involve the dissociation of cells or nuclei and loss of tissue context information. To enable capture of epigenomic profiles as well as tissue context information, spatial epigenomics techniques need to be developed. Such techniques could complement the growing spatial transcriptomics technologies to delineate the role of the epigenome in homeostasis or disease pathogenesis in specific tissue and cell type niches. To this end, it is exciting that spatial single cell CUT&Tag has recently been reported201. Third, existing single-cell epigenomic technologies only capture a fraction of the epigenome per cell and in only a fraction of the input cell population. Improvements in the efficiency of capture and completeness of information would be highly desirable for profiling clinical samples with limited quantity or cell types that are very rare. Overcoming these hurdles will bring further leaps in the annotation of the human genome and understanding of disease mechanisms.
Key points.
The human genome harbors millions of cis-regulatory elements (CRE) responsible for spatiotemporal gene expression patterns.
A diverse array of single cell epigenomics assays have been used to determine the status of DNA methylation, chromatin accessibility, histone modifications or chromatin architecture, genome wide in individual cells at scale.
A suite of analytical tools for single cell epigenomic datasets enable mapping and characterization of candidate CREs in the genome across divers cell types and developmental stages.
Single cell epigenomic profiling of diverse tissues are providing deeper insight into mammalian development, disease pathogenesis, and mechanisms of noncoding disease risk variants.
ACKNOWLEDGEMENTS
We apologize to those authors whose work we fail to include in this review due to space constraints. Research in Ren lab is funded by the Ludwig Institute and the National Institutes of Health (NIH) grants 1UM1HG009402, 1U19MH114831, 1U01MH121282, 1R01AG066018, R01AG067153, U01DA052769, 1UM1HG011585, RF1MH124612, 1R56AG069107, R01EY031663, 1U01HG012059, R24AG073198 and RF1MH128838. The Center for Epigenomics was supported, in part, by the UC San Diego School of Medicine and by NIH grants R01EY030591, U01HL148867, U01DK120429, R01HD102534. The Gaulton lab is funded by NIH grants DK114650, DK120429, DK122607, DK105554 and HG012059.
GLOSSARY
- Epigenome
The processes that enable stable propagation of different gene expression patterns out of the same genome sequence. These include methylation of DNA at cytosine bases (mC), chemical modification of the histone proteins, the chromatin accessibility and higher order chromatin structures
- Chromatin
a complex of DNA and histone proteins. The basic unit of chromatin is the nucleosome
- Cis-regulatory element (CRE)
Non-coding DNA sequences that regulate transcription of genes located on the same chromosome. They include enhancers, promoters, insulators, silencing elements and tethering elements. Different classes of CREs can be identified using a combination of molecular markers including chromatin accessibility and epigenetic modifications
- Promoter
A CRE located at the transcriptional start site of a gene
- Enhancer
A CRE that can activate target gene expression from a large genomic distance, ranging from several kilobases to even millions of basepairs. It can be found either upstream or downstream from the target gene promoter
- Insulator
A CRE that prevents an enhancer from activating a target gene when it is placed between the enhancer and gene promoter, but not placed outside. An insulator also refers to a boundary element that can prevent the spreading of heterochromatin into euchromatic regions
- Silencing element
A CRE that can be located close or distal to the transcriptional start site of the target gene. Silencers are bound by repressive transcription factors to inactivate gene expression
- Tethering element
A CRE that can bring together promoter and enhancers for gene activation
- Histone modifications
Covalent modifications to histone proteins such as methylation, acetylation, phosphorylation, ubiquitylation, sumoylation that take place at lysine, serine, threonine, arginine and other residues. Histone modifications are catalyzed by a diverse panel of enzymes referred to as writers, removed by a different set of proteins known as erasers, and recognized by chromatin binding proteins known as readers. Activity of CREs is directly linked to distinct histone modifications due to the activities of writers, erasers, and readers
- Tagmentation
The process by which double-stranded DNA is cleaved by the transposase Tn5, creating short DNA fragments that are simultaneously tagged with PCR adapters. Tagmentation using Tn5 preferentially occurs at accessible or open chromatin and this property is used in ATAC-seq and other related assays
- 3D chromatin organization
Folding of the chromatin fibers inside the nucleus governs the spatial proximity between genes and CREs. While complex and variable between cells, the chromatin organization exhibits certain common features including A/B compartments, topologically associating domains (TADs) and loops
Footnotes
Competing interests
B.R. is a shareholder and consultant of Arima Genomics, Inc., and a co-founder of Epigenome Technologies, Inc. K.J.G. is a consultant of Genentech and a shareholder in Vertex Pharmaceuticals and Neurocrine Biosciences. These relationships have been disclosed to and approved by the UCSD Independent Review Committee.
Related links
Chromium Single Cell Multiome ATAC + Gene Expression: https://www.10xgenomics.com/products/single-cell-multiome-atac-plus-gene-expression
REFERENCES
- 1.Lee TI & Young RA Transcriptional regulation and its misregulation in disease. Cell 152, 1237–1251, doi: 10.1016/j.cell.2013.02.014 (2013). [DOI] [PMC free article] [PubMed] [Google Scholar]
- 2.Levine M, Cattoglio C & Tjian R Looping back to leap forward: transcription enters a new era. Cell 157, 13–25, doi: 10.1016/j.cell.2014.02.009 (2014). [DOI] [PMC free article] [PubMed] [Google Scholar]
- 3.Oudelaar AM & Higgs DR The relationship between genome structure and function. Nat Rev Genet 22, 154–168, doi: 10.1038/s41576-020-00303-x (2021). [DOI] [PubMed] [Google Scholar]
- 4.Consortium EP et al. Expanded encyclopaedias of DNA elements in the human and mouse genomes. Nature 583, 699–710, doi: 10.1038/s41586-020-2493-4 (2020). [DOI] [PMC free article] [PubMed] [Google Scholar]
- 5.Cramer P Organization and regulation of gene transcription. Nature 573, 45–54, doi: 10.1038/s41586-019-1517-4 (2019). [DOI] [PubMed] [Google Scholar]
- 6.Doni Jayavelu N, Jajodia A, Mishra A & Hawkins RD Candidate silencer elements for the human and mouse genomes. Nat Commun 11, 1061, doi: 10.1038/s41467-020-14853-5 (2020). [DOI] [PMC free article] [PubMed] [Google Scholar]
- 7.Gisselbrecht SS et al. Transcriptional Silencers in Drosophila Serve a Dual Role as Transcriptional Enhancers in Alternate Cellular Contexts. Mol Cell 77, 324–337 e328, doi: 10.1016/j.molcel.2019.10.004 (2020). [DOI] [PMC free article] [PubMed] [Google Scholar]
- 8.Pang B & Snyder MP Systematic identification of silencers in human cells. Nat Genet 52, 254–263, doi: 10.1038/s41588-020-0578-5 (2020). [DOI] [PMC free article] [PubMed] [Google Scholar]
- 9.Segert JA, Gisselbrecht SS & Bulyk ML Transcriptional Silencers: Driving Gene Expression with the Brakes On. Trends Genet 37, 514–527, doi: 10.1016/j.tig.2021.02.002 (2021). [DOI] [PMC free article] [PubMed] [Google Scholar]
- 10.Batut PJ et al. Genome organization controls transcriptional dynamics during development. Science 375, 566–570, doi: 10.1126/science.abi7178 (2022). [DOI] [PMC free article] [PubMed] [Google Scholar]
- 11.Hallikas O et al. Genome-wide prediction of mammalian enhancers based on analysis of transcription-factor binding affinity. Cell 124, 47–59, doi: 10.1016/j.cell.2005.10.042 (2006). [DOI] [PubMed] [Google Scholar]
- 12.Pennacchio LA & Rubin EM Comparative genomic tools and databases: providing insights into the human genome. J Clin Invest 111, 1099–1106, doi: 10.1172/JCI17842 (2003). [DOI] [PMC free article] [PubMed] [Google Scholar]
- 13.Thurman RE et al. The accessible chromatin landscape of the human genome. Nature 489, 75–82, doi: 10.1038/nature11232 (2012). [DOI] [PMC free article] [PubMed] [Google Scholar]
- 14.Boyle AP et al. High-resolution mapping and characterization of open chromatin across the genome. Cell 132, 311–322, doi: 10.1016/j.cell.2007.12.014 (2008). [DOI] [PMC free article] [PubMed] [Google Scholar]
- 15.Buenrostro JD, Giresi PG, Zaba LC, Chang HY & Greenleaf WJ Transposition of native chromatin for fast and sensitive epigenomic profiling of open chromatin, DNA-binding proteins and nucleosome position. Nat Methods 10, 1213–1218, doi: 10.1038/nmeth.2688 (2013). [DOI] [PMC free article] [PubMed] [Google Scholar]
- 16.Lister R et al. Human DNA methylomes at base resolution show widespread epigenomic differences. Nature 462, 315–322 (2009). [DOI] [PMC free article] [PubMed] [Google Scholar]
- 17.Albert I et al. Translational and rotational settings of H2A.Z nucleosomes across the Saccharomyces cerevisiae genome. Nature 446, 572–576, doi: 10.1038/nature05632 (2007). [DOI] [PubMed] [Google Scholar]
- 18.Barski A et al. High-resolution profiling of histone methylations in the human genome. Cell 129, 823–837, doi: 10.1016/j.cell.2007.05.009 (2007). [DOI] [PubMed] [Google Scholar]
- 19.Johnson DS, Mortazavi A, Myers RM & Wold B Genome-wide mapping of in vivo protein-DNA interactions. Science 316, 1497–1502, doi: 10.1126/science.1141319 (2007). [DOI] [PubMed] [Google Scholar]
- 20.Mikkelsen TS et al. Genome-wide maps of chromatin state in pluripotent and lineage-committed cells. Nature 448, 553–560, doi: 10.1038/nature06008 (2007). [DOI] [PMC free article] [PubMed] [Google Scholar]
- 21.Dekker J & Mirny L The 3D Genome as Moderator of Chromosomal Communication. Cell 164, 1110–1121, doi: 10.1016/j.cell.2016.02.007 (2016). [DOI] [PMC free article] [PubMed] [Google Scholar]
- 22.Rowley MJ & Corces VG Organizational principles of 3D genome architecture. Nat Rev Genet 19, 789–800, doi: 10.1038/s41576-018-0060-8 (2018). [DOI] [PMC free article] [PubMed] [Google Scholar]
- 23.Lieberman-Aiden E et al. Comprehensive mapping of long-range interactions reveals folding principles of the human genome. Science 326, 289–293, doi: 10.1126/science.1181369 (2009). [DOI] [PMC free article] [PubMed] [Google Scholar]
- 24.Rao SS et al. A 3D map of the human genome at kilobase resolution reveals principles of chromatin looping. Cell 159, 1665–1680, doi: 10.1016/j.cell.2014.11.021 (2014). [DOI] [PMC free article] [PubMed] [Google Scholar]
- 25.Boix CA, James BT, Park YP, Meuleman W & Kellis M Regulatory genomic circuitry of human disease loci by integrative epigenomics. Nature 590, 300–307, doi: 10.1038/s41586-020-03145-z (2021). [DOI] [PMC free article] [PubMed] [Google Scholar]
- 26.Meuleman W et al. Index and biological spectrum of human DNase I hypersensitive sites. Nature 584, 244–251, doi: 10.1038/s41586-020-2559-3 (2020). [DOI] [PMC free article] [PubMed] [Google Scholar]
- 27.Roadmap Epigenomics, C. et al. Integrative analysis of 111 reference human epigenomes. Nature 518, 317–330, doi: 10.1038/nature14248 (2015). [DOI] [PMC free article] [PubMed] [Google Scholar]
- 28.Grubert F et al. Landscape of cohesin-mediated chromatin loops in the human genome. Nature 583, 737–743, doi: 10.1038/s41586-020-2151-x (2020). [DOI] [PMC free article] [PubMed] [Google Scholar]
- 29.Calderon D et al. Landscape of stimulation-responsive chromatin across diverse human immune cells. Nat Genet 51, 1494–1505, doi: 10.1038/s41588-019-0505-9 (2019). [DOI] [PMC free article] [PubMed] [Google Scholar]
- 30.Zhang K et al. A single-cell atlas of chromatin accessibility in the human genome. Cell 184, 5985–6001 e5919, doi: 10.1016/j.cell.2021.10.024 (2021). [DOI] [PMC free article] [PubMed] [Google Scholar]
- 31.Nurk S et al. The complete sequence of a human genome. Science 376, 44–53, doi: 10.1126/science.abj6987 (2022). [DOI] [PMC free article] [PubMed] [Google Scholar]
- 32.Luo C, Hajkova P & Ecker JR Dynamic DNA methylation: In the right place at the right time. Science 361, 1336–1340, doi: 10.1126/science.aat6806 (2018). [DOI] [PMC free article] [PubMed] [Google Scholar]
- 33.Chen Z & Zhang Y Role of Mammalian DNA Methyltransferases in Development. Annu Rev Biochem 89, 135–158, doi: 10.1146/annurev-biochem-103019-102815 (2020). [DOI] [PubMed] [Google Scholar]
- 34.Wu X & Zhang Y TET-mediated active DNA demethylation: mechanism, function and beyond. Nat Rev Genet 18, 517–534, doi: 10.1038/nrg.2017.33 (2017). [DOI] [PubMed] [Google Scholar]
- 35.Yin Y et al. Impact of cytosine methylation on DNA binding specificities of human transcription factors. Science 356, doi: 10.1126/science.aaj2239 (2017). [DOI] [PMC free article] [PubMed] [Google Scholar]
- 36.He Y & Ecker JR Non-CG Methylation in the Human Genome. Annu Rev Genomics Hum Genet 16, 55–77, doi: 10.1146/annurev-genom-090413-025437 (2015). [DOI] [PMC free article] [PubMed] [Google Scholar]
- 37.Miura F, Enomoto Y, Dairiki R & Ito T Amplification-free whole-genome bisulfite sequencing by post-bisulfite adaptor tagging. Nucleic Acids Res 40, e136, doi: 10.1093/nar/gks454 (2012). [DOI] [PMC free article] [PubMed] [Google Scholar]
- 38.Angermueller C et al. Parallel single-cell sequencing links transcriptional and epigenetic heterogeneity. Nat Methods 13, 229–232, doi: 10.1038/nmeth.3728 (2016). [DOI] [PMC free article] [PubMed] [Google Scholar]
- 39.Smallwood SA et al. Single-cell genome-wide bisulfite sequencing for assessing epigenetic heterogeneity. Nat Methods 11, 817–820, doi: 10.1038/nmeth.3035 (2014). [DOI] [PMC free article] [PubMed] [Google Scholar]
- 40.Farlik M. et al. Single-cell DNA methylome sequencing and bioinformatic inference of epigenomic cell-state dynamics. Cell Rep 10, 1386–1397, doi: 10.1016/j.celrep.2015.02.001 (2015). [DOI] [PMC free article] [PubMed] [Google Scholar]
- 41.Luo C. et al. Single-cell methylomes identify neuronal subtypes and regulatory elements in mammalian cortex. Science 357, 600–604, doi: 10.1126/science.aan3351 (2017). [DOI] [PMC free article] [PubMed] [Google Scholar]
- 42.Luo C. et al. Robust single-cell DNA methylome profiling with snmC-seq2. Nat Commun 9, 3824, doi: 10.1038/s41467-018-06355-2 (2018). [DOI] [PMC free article] [PubMed] [Google Scholar]
- 43.Yao Z. et al. A transcriptomic and epigenomic cell atlas of the mouse primary motor cortex. Nature 598, 103–110, doi: 10.1038/s41586-021-03500-8 (2021). [DOI] [PMC free article] [PubMed] [Google Scholar]
- 44.Liu H et al. DNA methylation atlas of the mouse brain at single-cell resolution. Nature 598, 120–128, doi: 10.1038/s41586-020-03182-8 (2021). [DOI] [PMC free article] [PubMed] [Google Scholar]
- 45.Guo H et al. Single-cell methylome landscapes of mouse embryonic stem cells and early embryos analyzed using reduced representation bisulfite sequencing. Genome Res 23, 2126–2135, doi: 10.1101/gr.161679.113 (2013). [DOI] [PMC free article] [PubMed] [Google Scholar]
- 46.Shareef SJ et al. Extended-representation bisulfite sequencing of gene regulatory elements in multiplexed samples and single cells. Nat Biotechnol, doi: 10.1038/s41587-021-00910-x (2021). [DOI] [PMC free article] [PubMed] [Google Scholar]
- 47.Mulqueen RM et al. Highly scalable generation of DNA methylation profiles in single cells. Nat Biotechnol 36, 428–431, doi: 10.1038/nbt.4112 (2018). [DOI] [PMC free article] [PubMed] [Google Scholar]
- 48.Luo C. et al. Single nucleus multi-omics identifies human cortical cell regulatory genome diversity. Cell Genom 2, doi: 10.1016/j.xgen.2022.100107 (2022). [DOI] [PMC free article] [PubMed] [Google Scholar]
- 49.Zaret KS Pioneer Transcription Factors Initiating Gene Network Changes. Annu Rev Genet 54, 367–385, doi: 10.1146/annurev-genet-030220-015007 (2020). [DOI] [PMC free article] [PubMed] [Google Scholar]
- 50.Jin W et al. Genome-wide detection of DNase I hypersensitive sites in single cells and FFPE tissue samples. Nature 528, 142–146, doi: 10.1038/nature15740 (2015). [DOI] [PMC free article] [PubMed] [Google Scholar]
- 51.Gao W. et al. Multiplex indexing approach for the detection of DNase I hypersensitive sites in single cells. Nucleic Acids Res 49, e56, doi: 10.1093/nar/gkab102 (2021). [DOI] [PMC free article] [PubMed] [Google Scholar]
- 52.Chen X, Miragaia RJ, Natarajan KN & Teichmann SA A rapid and robust method for single cell chromatin accessibility profiling. Nat Commun 9, 5345, doi: 10.1038/s41467-018-07771-0 (2018). [DOI] [PMC free article] [PubMed] [Google Scholar]
- 53.Xu W. et al. A plate-based single-cell ATAC-seq workflow for fast and robust profiling of chromatin accessibility. Nat Protoc 16, 4084–4107, doi: 10.1038/s41596-021-00583-5 (2021). [DOI] [PubMed] [Google Scholar]
- 54.Graybuck LT et al. Enhancer viruses for combinatorial cell-subclass-specific labeling. Neuron 109, 1449–1464 e1413, doi: 10.1016/j.neuron.2021.03.011 (2021). [DOI] [PMC free article] [PubMed] [Google Scholar]
- 55.Mich JK et al. Functional enhancer elements drive subclass-selective expression from mouse to primate neocortex. Cell Rep 34, 108754, doi: 10.1016/j.celrep.2021.108754 (2021). [DOI] [PMC free article] [PubMed] [Google Scholar]
- 56.Mezger A. et al. High-throughput chromatin accessibility profiling at single-cell resolution. Nat Commun 9, 3647, doi: 10.1038/s41467-018-05887-x (2018). [DOI] [PMC free article] [PubMed] [Google Scholar]
- 57.Buenrostro JD et al. Single-cell chromatin accessibility reveals principles of regulatory variation. Nature 523, 486–490, doi: 10.1038/nature14590 (2015). [DOI] [PMC free article] [PubMed] [Google Scholar]
- 58.Satpathy AT et al. Massively parallel single-cell chromatin landscapes of human immune cell development and intratumoral T cell exhaustion. Nat Biotechnol 37, 925–936, doi: 10.1038/s41587-019-0206-z (2019). [DOI] [PMC free article] [PubMed] [Google Scholar]
- 59.Lareau CA et al. Droplet-based combinatorial indexing for massive-scale single-cell chromatin accessibility. Nat Biotechnol 37, 916–924, doi: 10.1038/s41587-019-0147-6 (2019). [DOI] [PMC free article] [PubMed] [Google Scholar]
- 60.Cusanovich DA et al. Multiplex single cell profiling of chromatin accessibility by combinatorial cellular indexing. Science 348, 910–914, doi: 10.1126/science.aab1601 (2015). [DOI] [PMC free article] [PubMed] [Google Scholar]
- 61.Wang K. et al. Simple oligonucleotide-based multiplexing of single-cell chromatin accessibility. Mol Cell 81, 4319–4332 e4310, doi: 10.1016/j.molcel.2021.09.026 (2021). [DOI] [PMC free article] [PubMed] [Google Scholar]
- 62.De Rop F. et al. HyDrop enables droplet based single-cell ATAC-seq and single-cell RNA-seq using dissolvable hydrogel beads. Elife 11, doi: 10.7554/eLife.73971 (2022). [DOI] [PMC free article] [PubMed] [Google Scholar]
- 63.Domcke S. et al. A human cell atlas of fetal chromatin accessibility. Science 370, doi: 10.1126/science.aba7612 (2020). [DOI] [PMC free article] [PubMed] [Google Scholar]
- 64.Sinnamon JR et al. The accessible chromatin landscape of the murine hippocampus at single-cell resolution. Genome Res 29, 857–869, doi: 10.1101/gr.243725.118 (2019). [DOI] [PMC free article] [PubMed] [Google Scholar]
- 65.Cusanovich DA et al. A Single-Cell Atlas of In Vivo Mammalian Chromatin Accessibility. Cell 174, 1309–1324 e1318, doi: 10.1016/j.cell.2018.06.052 (2018). [DOI] [PMC free article] [PubMed] [Google Scholar]
- 66.Preissl S. et al. Single-nucleus analysis of accessible chromatin in developing mouse forebrain reveals cell-type-specific transcriptional regulation. Nat Neurosci 21, 432–439, doi: 10.1038/s41593-018-0079-3 (2018). [DOI] [PMC free article] [PubMed] [Google Scholar]
- 67.Li YE et al. An atlas of gene regulatory elements in adult mouse cerebrum. Nature 598, 129–136, doi: 10.1038/s41586-021-03604-1 (2021). [DOI] [PMC free article] [PubMed] [Google Scholar]
- 68.LaFave LM et al. Epigenomic State Transitions Characterize Tumor Progression in Mouse Lung Adenocarcinoma. Cancer Cell 38, 212–228 e213, doi: 10.1016/j.ccell.2020.06.006 (2020). [DOI] [PMC free article] [PubMed] [Google Scholar]
- 69.Cusanovich DA et al. The cis-regulatory dynamics of embryonic development at single-cell resolution. Nature 555, 538–542, doi: 10.1038/nature25981 (2018). [DOI] [PMC free article] [PubMed] [Google Scholar]
- 70.Thornton CA et al. Spatially mapped single-cell chromatin accessibility. Nat Commun 12, 1274, doi: 10.1038/s41467-021-21515-7 (2021). [DOI] [PMC free article] [PubMed] [Google Scholar]
- 71.Lake BB et al. Integrative single-cell analysis of transcriptional and epigenetic states in the human adult brain. Nat Biotechnol 36, 70–80, doi: 10.1038/nbt.4038 (2018). [DOI] [PMC free article] [PubMed] [Google Scholar]
- 72.Mulqueen RM et al. High-content single-cell combinatorial indexing. Nat Biotechnol, doi: 10.1038/s41587-021-00962-z (2021). [DOI] [PMC free article] [PubMed] [Google Scholar]
- 73.Regev A. et al. The Human Cell Atlas. Elife 6, doi: 10.7554/eLife.27041 (2017). [DOI] [PMC free article] [PubMed] [Google Scholar]
- 74.Allis CD & Jenuwein T The molecular hallmarks of epigenetic control. Nat Rev Genet 17, 487–500, doi: 10.1038/nrg.2016.59 (2016). [DOI] [PubMed] [Google Scholar]
- 75.Heintzman ND et al. Distinct and predictive chromatin signatures of transcriptional promoters and enhancers in the human genome. Nat Genet 39, 311–318, doi: 10.1038/ng1966 (2007). [DOI] [PubMed] [Google Scholar]
- 76.Cenik BK & Shilatifard A COMPASS and SWI/SNF complexes in development and disease. Nat Rev Genet 22, 38–58, doi: 10.1038/s41576-020-0278-0 (2021). [DOI] [PubMed] [Google Scholar]
- 77.Calo E & Wysocka J Modification of enhancer chromatin: what, how, and why? Mol Cell 49, 825–837, doi: 10.1016/j.molcel.2013.01.038 (2013). [DOI] [PMC free article] [PubMed] [Google Scholar]
- 78.Rotem A. et al. Single-cell ChIP-seq reveals cell subpopulations defined by chromatin state. Nat Biotechnol 33, 1165–1172, doi: 10.1038/nbt.3383 (2015). [DOI] [PMC free article] [PubMed] [Google Scholar]
- 79.Grosselin K. et al. High-throughput single-cell ChIP-seq identifies heterogeneity of chromatin states in breast cancer. Nat Genet 51, 1060–1066, doi: 10.1038/s41588-019-0424-9 (2019). [DOI] [PubMed] [Google Scholar]
- 80.Ai S. et al. Profiling chromatin states using single-cell itChIP-seq. Nat Cell Biol 21, 1164–1172, doi: 10.1038/s41556-019-0383-5 (2019). [DOI] [PubMed] [Google Scholar]
- 81.Schmid M, Durussel T & Laemmli UK ChIC and ChEC; genomic mapping of chromatin proteins. Mol Cell 16, 147–157, doi: 10.1016/j.molcel.2004.09.007 (2004). [DOI] [PubMed] [Google Scholar]
- 82.Skene PJ & Henikoff S An efficient targeted nuclease strategy for high-resolution mapping of DNA binding sites. Elife 6, doi: 10.7554/eLife.21856 (2017). [DOI] [PMC free article] [PubMed] [Google Scholar]
- 83.Kaya-Okur HS et al. CUT&Tag for efficient epigenomic profiling of small samples and single cells. Nat Commun 10, 1930, doi: 10.1038/s41467-019-09982-5 (2019). [DOI] [PMC free article] [PubMed] [Google Scholar]
- 84.Ku WL et al. Single-cell chromatin immunocleavage sequencing (scChIC-seq) to profile histone modification. Nat Methods 16, 323–325, doi: 10.1038/s41592-019-0361-7 (2019). [DOI] [PMC free article] [PubMed] [Google Scholar]
- 85.Hainer SJ, Boskovic A, McCannell KN, Rando OJ & Fazzio TG Profiling of Pluripotency Factors in Single Cells and Early Embryos. Cell 177, 1319–1329 e1311, doi: 10.1016/j.cell.2019.03.014 (2019). [DOI] [PMC free article] [PubMed] [Google Scholar]
- 86.Ku WL, Pan L, Cao Y, Gao W & Zhao K Profiling single-cell histone modifications using indexing chromatin immunocleavage sequencing. Genome Res 31, 1831–1842, doi: 10.1101/gr.260893.120 (2021). [DOI] [PMC free article] [PubMed] [Google Scholar]
- 87.Carter B. et al. Mapping histone modifications in low cell number and single cells using antibody-guided chromatin tagmentation (ACT-seq). Nat Commun 10, 3747, doi: 10.1038/s41467-019-11559-1 (2019). [DOI] [PMC free article] [PubMed] [Google Scholar]
- 88.Wang Q. et al. CoBATCH for High-Throughput Single-Cell Epigenomic Profiling. Mol Cell 76, 206–216 e207, doi: 10.1016/j.molcel.2019.07.015 (2019). [DOI] [PubMed] [Google Scholar]
- 89.Wu SJ et al. Single-cell CUT&Tag analysis of chromatin modifications in differentiation and tumor progression. Nat Biotechnol 39, 819–824, doi: 10.1038/s41587-021-00865-z (2021). [DOI] [PMC free article] [PubMed] [Google Scholar]
- 90.Bartosovic M, Kabbe M & Castelo-Branco G Single-cell CUT&Tag profiles histone modifications and transcription factors in complex tissues. Nat Biotechnol 39, 825–835, doi: 10.1038/s41587-021-00869-9 (2021). [DOI] [PMC free article] [PubMed] [Google Scholar]
- 91.Bartlett DA et al. High-throughput single-cell epigenomic profiling by targeted insertion of promoters (TIP-seq). J Cell Biol 220, doi: 10.1083/jcb.202103078 (2021). [DOI] [PMC free article] [PubMed] [Google Scholar]
- 92.Gibcus JH et al. A pathway for mitotic chromosome formation. Science 359, doi: 10.1126/science.aao6135 (2018). [DOI] [PMC free article] [PubMed] [Google Scholar]
- 93.Zhang H. et al. Chromatin structure dynamics during the mitosis-to-G1 phase transition. Nature 576, 158–162, doi: 10.1038/s41586-019-1778-y (2019). [DOI] [PMC free article] [PubMed] [Google Scholar]
- 94.Davidson IF & Peters JM Genome folding through loop extrusion by SMC complexes. Nat Rev Mol Cell Biol 22, 445–464, doi: 10.1038/s41580-021-00349-7 (2021). [DOI] [PubMed] [Google Scholar]
- 95.Nagano T. et al. Single-cell Hi-C reveals cell-to-cell variability in chromosome structure. Nature 502, 59–64, doi: 10.1038/nature12593 (2013). [DOI] [PMC free article] [PubMed] [Google Scholar]
- 96.Stevens TJ et al. 3D structures of individual mammalian genomes studied by single-cell Hi-C. Nature 544, 59–64, doi: 10.1038/nature21429 (2017). [DOI] [PMC free article] [PubMed] [Google Scholar]
- 97.Flyamer IM et al. Single-nucleus Hi-C reveals unique chromatin reorganization at oocyte-to-zygote transition. Nature 544, 110–114, doi: 10.1038/nature21711 (2017). [DOI] [PMC free article] [PubMed] [Google Scholar]
- 98.Tan L, Xing D, Chang CH, Li H & Xie XS Three-dimensional genome structures of single diploid human cells. Science 361, 924–928, doi: 10.1126/science.aat5641 (2018). [DOI] [PMC free article] [PubMed] [Google Scholar]
- 99.Tan L. et al. Changes in genome architecture and transcriptional dynamics progress independently of sensory experience during post-natal brain development. Cell 184, 741–758 e717, doi: 10.1016/j.cell.2020.12.032 (2021). [DOI] [PubMed] [Google Scholar]
- 100.Nagano T. et al. Cell-cycle dynamics of chromosomal organization at single-cell resolution. Nature 547, 61–67, doi: 10.1038/nature23001 (2017). [DOI] [PMC free article] [PubMed] [Google Scholar]
- 101.Ramani V. et al. Massively multiplex single-cell Hi-C. Nat Methods 14, 263–266, doi: 10.1038/nmeth.4155 (2017). [DOI] [PMC free article] [PubMed] [Google Scholar]
- 102.Ramani V et al. Sci-Hi-C: A single-cell Hi-C method for mapping 3D genome organization in large number of single cells. Methods 170, 61–68, doi: 10.1016/j.ymeth.2019.09.012 (2020). [DOI] [PMC free article] [PubMed] [Google Scholar]
- 103.Arrastia MV et al. Single-cell measurement of higher-order 3D genome organization with scSPRITE. Nat Biotechnol 40, 64–73, doi: 10.1038/s41587-021-00998-1 (2022). [DOI] [PMC free article] [PubMed] [Google Scholar]
- 104.Zhu C, Preissl S & Ren B Single-cell multimodal omics: the power of many. Nat Methods 17, 11–14, doi: 10.1038/s41592-019-0691-5 (2020). [DOI] [PubMed] [Google Scholar]
- 105.Elmentaite R, Dominguez Conde C, Yang L & Teichmann SA Single-cell atlases: shared and tissue-specific cell types across human organs. Nat Rev Genet, doi: 10.1038/s41576-022-00449-w (2022). [DOI] [PubMed] [Google Scholar]
- 106.Hu Y. et al. Simultaneous profiling of transcriptome and DNA methylome from a single cell. Genome Biol 17, 88, doi: 10.1186/s13059-016-0950-z (2016). [DOI] [PMC free article] [PubMed] [Google Scholar]
- 107.Hou Y. et al. Single-cell triple omics sequencing reveals genetic, epigenetic, and transcriptomic heterogeneity in hepatocellular carcinomas. Cell Res 26, 304–319, doi: 10.1038/cr.2016.23 (2016). [DOI] [PMC free article] [PubMed] [Google Scholar]
- 108.Bian S. et al. Single-cell multiomics sequencing and analyses of human colorectal cancer. Science 362, 1060–1063, doi: 10.1126/science.aao3791 (2018). [DOI] [PubMed] [Google Scholar]
- 109.Cao J. et al. Joint profiling of chromatin accessibility and gene expression in thousands of single cells. Science 361, 1380–1385, doi: 10.1126/science.aau0730 (2018). [DOI] [PMC free article] [PubMed] [Google Scholar]
- 110.Chen S, Lake BB & Zhang K High-throughput sequencing of the transcriptome and chromatin accessibility in the same cell. Nat Biotechnol 37, 1452–1457, doi: 10.1038/s41587-019-0290-0 (2019). [DOI] [PMC free article] [PubMed] [Google Scholar]
- 111.Zhu C. et al. An ultra high-throughput method for single-cell joint analysis of open chromatin and transcriptome. Nat Struct Mol Biol 26, 1063–1070, doi: 10.1038/s41594-019-0323-x (2019). [DOI] [PMC free article] [PubMed] [Google Scholar]
- 112.Ma S. et al. Chromatin Potential Identified by Shared Single-Cell Profiling of RNA and Chromatin. Cell 183, 1103–1116 e1120, doi: 10.1016/j.cell.2020.09.056 (2020). [DOI] [PMC free article] [PubMed] [Google Scholar]
- 113.Xing QR et al. Parallel bimodal single-cell sequencing of transcriptome and chromatin accessibility. Genome Res 30, 1027–1039, doi: 10.1101/gr.257840.119 (2020). [DOI] [PMC free article] [PubMed] [Google Scholar]
- 114.Liu L. et al. Deconvolution of single-cell multi-omics layers reveals regulatory heterogeneity. Nat Commun 10, 470, doi: 10.1038/s41467-018-08205-7 (2019). [DOI] [PMC free article] [PubMed] [Google Scholar]
- 115.Plongthongkum N, Diep D, Chen S, Lake BB & Zhang K Scalable dual-omics profiling with single-nucleus chromatin accessibility and mRNA expression sequencing 2 (SNARE-seq2). Nat Protoc 16, 4992–5029, doi: 10.1038/s41596-021-00507-3 (2021). [DOI] [PubMed] [Google Scholar]
- 116.Xiong H, Luo Y, Wang Q, Yu X & He A Single-cell joint detection of chromatin occupancy and transcriptome enables higher-dimensional epigenomic reconstructions. Nat Methods 18, 652–660, doi: 10.1038/s41592-021-01129-z (2021). [DOI] [PubMed] [Google Scholar]
- 117.Zhu C. et al. Joint profiling of histone modifications and transcriptome in single cells from mouse brain. Nat Methods 18, 283–292, doi: 10.1038/s41592-021-01060-3 (2021). [DOI] [PMC free article] [PubMed] [Google Scholar]
- 118.Sun Z. et al. Joint single-cell multiomic analysis in Wnt3a induced asymmetric stem cell division. Nat Commun 12, 5941, doi: 10.1038/s41467-021-26203-0 (2021). [DOI] [PMC free article] [PubMed] [Google Scholar]
- 119.Stoeckius M. et al. Simultaneous epitope and transcriptome measurement in single cells. Nat Methods 14, 865–868, doi: 10.1038/nmeth.4380 (2017). [DOI] [PMC free article] [PubMed] [Google Scholar]
- 120.Mimitou EP et al. Scalable, multimodal profiling of chromatin accessibility, gene expression and protein levels in single cells. Nat Biotechnol, doi: 10.1038/s41587-021-00927-2 (2021). [DOI] [PMC free article] [PubMed] [Google Scholar]
- 121.Swanson E. et al. Simultaneous trimodal single-cell measurement of transcripts, epitopes, and chromatin accessibility using TEA-seq. Elife 10, doi: 10.7554/eLife.63632 (2021). [DOI] [PMC free article] [PubMed] [Google Scholar]
- 122.Chen X. et al. Joint single-cell DNA accessibility and protein epitope profiling reveals environmental regulation of epigenomic heterogeneity. Nat Commun 9, 4590, doi: 10.1038/s41467-018-07115-y (2018). [DOI] [PMC free article] [PubMed] [Google Scholar]
- 123.Fiskin E. et al. Single-cell profiling of proteins and chromatin accessibility using PHAGE-ATAC. Nat Biotechnol, doi: 10.1038/s41587-021-01065-5 (2021). [DOI] [PMC free article] [PubMed] [Google Scholar]
- 124.Zhang B. et al. Characterizing cellular heterogeneity in chromatin state with scCUT&Tag-pro. Nat Biotechnol, doi: 10.1038/s41587-022-01250-0 (2022). [DOI] [PMC free article] [PubMed] [Google Scholar]
- 125.Chen AF et al. NEAT-seq: simultaneous profiling of intra-nuclear proteins, chromatin accessibility and gene expression in single cells. Nat Methods, doi: 10.1038/s41592-022-01461-y (2022). [DOI] [PMC free article] [PubMed] [Google Scholar]
- 126.Guo F. et al. Single-cell multi-omics sequencing of mouse early embryos and embryonic stem cells. Cell Res 27, 967–988, doi: 10.1038/cr.2017.82 (2017). [DOI] [PMC free article] [PubMed] [Google Scholar]
- 127.Pott S. Simultaneous measurement of chromatin accessibility, DNA methylation, and nucleosome phasing in single cells. Elife 6, doi: 10.7554/eLife.23203 (2017). [DOI] [PMC free article] [PubMed] [Google Scholar]
- 128.Gu C, Liu S, Wu Q, Zhang L & Guo F Integrative single-cell analysis of transcriptome, DNA methylome and chromatin accessibility in mouse oocytes. Cell Res 29, 110–123, doi: 10.1038/s41422-018-0125-4 (2019). [DOI] [PMC free article] [PubMed] [Google Scholar]
- 129.Clark SJ et al. scNMT-seq enables joint profiling of chromatin accessibility DNA methylation and transcription in single cells. Nat Commun 9, 781, doi: 10.1038/s41467-018-03149-4 (2018). [DOI] [PMC free article] [PubMed] [Google Scholar]
- 130.Wang Y. et al. Single-cell multiomics sequencing reveals the functional regulatory landscape of early embryos. Nat Commun 12, 1247, doi: 10.1038/s41467-021-21409-8 (2021). [DOI] [PMC free article] [PubMed] [Google Scholar]
- 131.Tedesco M. et al. Chromatin Velocity reveals epigenetic dynamics by single-cell profiling of heterochromatin and euchromatin. Nat Biotechnol 40, 235–244, doi: 10.1038/s41587-021-01031-1 (2022). [DOI] [PubMed] [Google Scholar]
- 132.Gopalan S, Wang Y, Harper NW, Garber M & Fazzio TG Simultaneous profiling of multiple chromatin proteins in the same cells. Mol Cell 81, 4736–4746 e4735, doi: 10.1016/j.molcel.2021.09.019 (2021). [DOI] [PMC free article] [PubMed] [Google Scholar]
- 133.Li G. et al. Joint profiling of DNA methylation and chromatin architecture in single cells. Nat Methods 16, 991–993, doi: 10.1038/s41592-019-0502-z (2019). [DOI] [PMC free article] [PubMed] [Google Scholar]
- 134.Lee DS et al. Simultaneous profiling of 3D genome structure and DNA methylation in single human cells. Nat Methods 16, 999–1006, doi: 10.1038/s41592-019-0547-z (2019). [DOI] [PMC free article] [PubMed] [Google Scholar]
- 135.Stuart T, Srivastava A, Madad S, Lareau CA & Satija R Single-cell chromatin state analysis with Signac. Nat Methods 18,1333–1341, doi: 10.1038/s41592-021-01282-5 (2021). [DOI] [PMC free article] [PubMed] [Google Scholar]
- 136.Granja JM et al. ArchR is a scalable software package for integrative single-cell chromatin accessibility analysis. Nat Genet 53, 403–411, doi: 10.1038/s41588-021-00790-6 (2021). [DOI] [PMC free article] [PubMed] [Google Scholar]
- 137.Fang R. et al. Comprehensive analysis of single cell ATAC-seq data with SnapATAC. Nat Commun 12, 1337, doi: 10.1038/s41467-021-21583-9 (2021). [DOI] [PMC free article] [PubMed] [Google Scholar]
- 138.Bravo Gonzalez-Blas C et al. cisTopic: cis-regulatory topic modeling on single-cell ATAC-seq data. Nat Methods 16, 397–400, doi: 10.1038/s41592-019-0367-l (2019). [DOI] [PMC free article] [PubMed] [Google Scholar]
- 139.Xiong L. et al. SCALE method for single-cell ATAC-seq analysis via latent feature extraction. Nat Commun 10, 4576, doi: 10.1038/s41467-019-12630-7 (2019). [DOI] [PMC free article] [PubMed] [Google Scholar]
- 140.Forgy EW Cluster analysis of multivariate data: efficiency versus interpretability of classifications. Biometrics 21, 768–769 (1965). [Google Scholar]
- 141.Ester M, Kriegel H-P, Sander J & Xu X in Proceedings of the Second International Conference on Knowledge Discovery and Data Mining (KDD-96) 226–231 (AAAI Press, 1996). [Google Scholar]
- 142.Blondel VDJLGRL Fast Unfolding of Communities in Large Networks. Journal of Statistical Mechanics: Theory and Experiment 2008, P10008 (2008). [Google Scholar]
- 143.Traag VA Faster unfolding of communities: speeding up the Louvain algorithm. Phys Rev E Stat Nonlin Soft Matter Phys 92, 032801, doi: 10.1103/PhysRevE.92.032801 (2015). [DOI] [PubMed] [Google Scholar]
- 144.van der Maaten LJPH, Visualizing GE Data Using t-SNE. Journal of Machine Learning Research 9, 2579–2605 (2008). [Google Scholar]
- 145.McInnes LH, John; Melville James. UMAP: Uniform Manifold Approximation and Projection for Dimension Reduction. arXiv:1802.03426 doi: 10.48550/arXiv.1802.03426 (2018). [DOI] [Google Scholar]
- 146.Wolock SL, Lopez R & Klein AM Scrublet: Computational Identification of Cell Doublets in Single-Cell Transcriptomic Data. Cell Syst 8, 281–291 e289, doi: 10.1016/j.cels.2018.11.005 (2019). [DOI] [PMC free article] [PubMed] [Google Scholar]
- 147.Thibodeau A. et al. AMULET: a novel read count-based method for effective multiplet detection from single nucleus ATAC-seq data. Genome Biol 22, 252, doi: 10.1186/sl3059-021-02469-x (2021). [DOI] [PMC free article] [PubMed] [Google Scholar]
- 148.Pierce SE, Granja JM & Greenleaf WJ High-throughput single-cell chromatin accessibility CRISPR screens enable unbiased identification of regulatory networks in cancer. Nat Commun 12, 2969, doi: 10.1038/s41467-021-23213-w (2021). [DOI] [PMC free article] [PubMed] [Google Scholar]
- 149.Danese A. et al. EpiScanpy: integrated single-cell epigenomic analysis. Nat Commun 12, 5228, doi: 10.1038/s41467-021-25131-3 (2021). [DOI] [PMC free article] [PubMed] [Google Scholar]
- 150.Zhang H. et al. Fast alignment and preprocessing of chromatin profiles with Chromap. Nat Commun 12, 6566, doi: 10.1038/s41467-021-26865-w (2021). [DOI] [PMC free article] [PubMed] [Google Scholar]
- 151.de Boer CG & Regev A BROCKMAN: deciphering variance in epigenomic regulators by k-mer factorization. BMC Bioinformatics 19, 253, doi: 10.1186/sl2859-018-2255-6 (2018). [DOI] [PMC free article] [PubMed] [Google Scholar]
- 152.Zamanighomi M. et al. Unsupervised clustering and epigenetic classification of single cells. Nat Commun 9, 2410, doi: 10.1038/s41467-018-04629-3 (2018). [DOI] [PMC free article] [PubMed] [Google Scholar]
- 153.Baker SM, Rogerson C, Hayes A, Sharrocks AD & Rattray M Classifying cells with Scasat, a single-cell ATAC-seq analysis tool. Nucleic Acids Res 47, e10, doi: 10.1093/nar/gky950 (2019). [DOI] [PMC free article] [PubMed] [Google Scholar]
- 154.Ji Z, Zhou W & Ji H Single-cell regulome data analysis by SCRAT. Bioinformatics 33, 2930–2932, doi: 10.1093/bioinformatics/btx315 (2017). [DOI] [PMC free article] [PubMed] [Google Scholar]
- 155.Fowlkes C, Belongie S, Chung F & Malik J Spectral grouping using the Nystrom method. IEEE Trans Pattern Anal Mach Intell 26, 214–225, doi: 10.1109/TPAMI.2004.1262185 (2004). [DOI] [PubMed] [Google Scholar]
- 156.Stuart T et al. Comprehensive Integration of Single-Cell Data. Cell 177, 1888–1902 e1821, doi: 10.1016/j.cell.2019.05.031 (2019). [DOI] [PMC free article] [PubMed] [Google Scholar]
- 157.Korsunsky I. et al. Fast, sensitive and accurate integration of single-cell data with Harmony. Nat Methods 16, 1289–1296, doi: 10.1038/s41592-019-0619-0 (2019). [DOI] [PMC free article] [PubMed] [Google Scholar]
- 158.Haghverdi L, Lun ATL, Morgan MD & Marioni JC Batch effects in single-cell RNA-sequencing data are corrected by matching mutual nearest neighbors. Nat Biotechnol 36, 421–427, doi: 10.1038/nbt.4091 (2018). [DOI] [PMC free article] [PubMed] [Google Scholar]
- 159.Kang JB et al. Efficient and precise single-cell reference atlas mapping with Symphony. Nat Commun 12, 5890, doi: 10.1038/s41467-021-25957-x (2021). [DOI] [PMC free article] [PubMed] [Google Scholar]
- 160.Argelaguet R, Cuomo ASE, Stegle O & Marioni JC Computational principles and challenges in single-cell data integration. Nat Biotechnol 39, 1202–1215, doi: 10.1038/s41587-021-00895-7 (2021). [DOI] [PubMed] [Google Scholar]
- 161.Hao Y. et al. Integrated analysis of multimodal single-cell data. Cell 184, 3573–3587 e3529, doi: 10.1016/j.cell.2021.04.048 (2021). [DOI] [PMC free article] [PubMed] [Google Scholar]
- 162.Argelaguet R. et al. MOFA+: a statistical framework for comprehensive integration of multi-modal single-cell data. Genome Biol 21, 111, doi: 10.1186/s13059-020-02015-1 (2020). [DOI] [PMC free article] [PubMed] [Google Scholar]
- 163.Jin S, Zhang L & Nie Q scAI: an unsupervised approach for the integrative analysis of parallel single-cell transcriptomic and epigenomic profiles. Genome Biol 21, 25, doi: 10.1186/s13059-020-1932-8 (2020). [DOI] [PMC free article] [PubMed] [Google Scholar]
- 164.Kim HJ, Lin Y, Geddes TA, Yang JYH & Yang P CiteFuse enables multi-modal analysis of CITE-seq data. Bioinformatics 36, 4137–4143, doi: 10.1093/bioinformatics/btaa282 (2020). [DOI] [PubMed] [Google Scholar]
- 165.Gayoso A. et al. Joint probabilistic modeling of single-cell multi-omic data with totalVI. Nat Methods 18, 272–282, doi: 10.1038/s41592-020-01050-x (2021). [DOI] [PMC free article] [PubMed] [Google Scholar]
- 166.Welch JD et al. Single-Cell Multi-omic Integration Compares and Contrasts Features of Brain Cell Identity. Cell 177, 1873–1887 e1817, doi: 10.1016/j.cell.2019.05.006 (2019). [DOI] [PMC free article] [PubMed] [Google Scholar]
- 167.Barkas N. et al. Joint analysis of heterogeneous single-cell RNA-seq dataset collections. Nat Methods 16, 695–698, doi: 10.1038/s41592-019-0466-z (2019). [DOI] [PMC free article] [PubMed] [Google Scholar]
- 168.Jansen C. et al. Building gene regulatory networks from scATAC-seq and scRNA-seq using Linked Self Organizing Maps. PLoS Comput Biol 15, e1006555, doi: 10.1371/journal.pcbi.1006555 (2019). [DOI] [PMC free article] [PubMed] [Google Scholar]
- 169.Welch JD, Hartemink AJ & Prins JF MATCHER: manifold alignment reveals correspondence between single cell transcriptome and epigenome dynamics. Genome Biol 18, 138, doi: 10.1186/s13059-017-1269-0 (2017). [DOI] [PMC free article] [PubMed] [Google Scholar]
- 170.Zhang Y. et al. Model-based analysis of ChIP-Seq (MACS). Genome Biol 9, R137, doi: 10.1186/gb-2008-9-9-r137 (2008). [DOI] [PMC free article] [PubMed] [Google Scholar]
- 171.Haeussler M. et al. The UCSC Genome Browser database: 2019 update. Nucleic Acids Res 47, D853–D858, doi: 10.1093/nar/gky1095 (2019). [DOI] [PMC free article] [PubMed] [Google Scholar]
- 172.Robinson JT et al. Integrative genomics viewer. Nat Biotechnol 29, 24–26, doi: 10.1038/nbt.1754 (2011). [DOI] [PMC free article] [PubMed] [Google Scholar]
- 173.Li D, Hsu S, Purushotham D, Sears RL & Wang T WashU Epigenome Browser update 2019. Nucleic Acids Res 47, W158–W165, doi: 10.1093/nar/gkz348 (2019). [DOI] [PMC free article] [PubMed] [Google Scholar]
- 174.Schep AN, Wu B, Buenrostro JD & Greenleaf WJ chromVAR: inferring transcription-factor-associated accessibility from single-cell epigenomic data. Nat Methods 14, 975–978, doi: 10.1038/nmeth.4401 (2017). [DOI] [PMC free article] [PubMed] [Google Scholar]
- 175.Pliner HA et al. Cicero Predicts cis-Regulatory DNA Interactions from Single-Cell Chromatin Accessibility Data. Mol Cell 71, 858–871 e858, doi: 10.1016/j.molcel.2018.06.044 (2018). [DOI] [PMC free article] [PubMed] [Google Scholar]
- 176.Yu M. et al. SnapHiC: a computational pipeline to identify chromatin loops from single-cell Hi-C data. Nat Methods, doi: 10.1038/s41592-021-01231-2 (2021). [DOI] [PMC free article] [PubMed] [Google Scholar]
- 177.Qiu X. et al. Reversed graph embedding resolves complex single-cell trajectories. Nat Methods 14, 979–982, doi: 10.1038/nmeth.4402 (2017). [DOI] [PMC free article] [PubMed] [Google Scholar]
- 178.Cao J et al. The single-cell transcriptional landscape of mammalian organogenesis. Nature 566, 496–502, doi: 10.1038/s41586-019-0969-x (2019). [DOI] [PMC free article] [PubMed] [Google Scholar]
- 179.Street K. et al. Slingshot: cell lineage and pseudotime inference for single-cell transcriptomics. BMC Genomics 19, 477, doi: 10.1186/s12864-018-4772-0 (2018). [DOI] [PMC free article] [PubMed] [Google Scholar]
- 180.Angerer P. et al. destiny: diffusion maps for large-scale single-cell data in R. Bioinformatics 32, 1241–1243, doi: 10.1093/bioinformatics/btv715 (2016). [DOI] [PubMed] [Google Scholar]
- 181.Corces MR et al. Single-cell epigenomic analyses implicate candidate causal variants at inherited risk loci for Alzheimer’s and Parkinson’s diseases. Nat Genet 52, 1158–1168, doi: 10.1038/s41588-020-00721-x (2020). [DOI] [PMC free article] [PubMed] [Google Scholar]
- 182.Bakken TE et al. Comparative cellular analysis of motor cortex in human, marmoset and mouse. Nature 598, 111–119, doi: 10.1038/s41586-021-03465-8 (2021). [DOI] [PMC free article] [PubMed] [Google Scholar]
- 183.Buenrostro JD et al. Integrated Single-Cell Analysis Maps the Continuous Regulatory Landscape of Human Hematopoietic Differentiation. Cell 173, 1535–1548 e1516, doi: 10.1016/j.cell.2018.03.074 (2018). [DOI] [PMC free article] [PubMed] [Google Scholar]
- 184.Muto Y. et al. Single cell transcriptional and chromatin accessibility profiling redefine cellular heterogeneity in the adult human kidney. Nat Commun 12, 2190, doi: 10.1038/s41467-021-22368-w (2021). [DOI] [PMC free article] [PubMed] [Google Scholar]
- 185.Duong TE et al. A single-cell regulatory map of postnatal lung alveologenesis in humans and mice. Cell Genom 2, doi: 10.1016/j.xgen.2022.100108 (2022). [DOI] [PMC free article] [PubMed] [Google Scholar]
- 186.Zhang Z. et al. Single nucleus transcriptome and chromatin accessibility of postmortem human pituitaries reveal diverse stem cell regulatory mechanisms. Cell Rep 38, 110467, doi: 10.1016/j.celrep.2022.110467 (2022). [DOI] [PMC free article] [PubMed] [Google Scholar]
- 187.Rai V. et al. Single-cell ATAC-Seq in human pancreatic islets and deep learning upscaling of rare cells reveals cell-specific type 2 diabetes regulatory signatures. Mol Metab 32, 109–121, doi: 10.1016/j.molmet.2019.12.006 (2020). [DOI] [PMC free article] [PubMed] [Google Scholar]
- 188.Wang A. et al. Single-cell multiomic profiling of human lungs reveals cell-type-specific and age-dynamic control of SARS-CoV2 host genes. Elife 9, doi: 10.7554/eLife.62522 (2020). [DOI] [PMC free article] [PubMed] [Google Scholar]
- 189.Ziffra RS et al. Single-cell epigenomics reveals mechanisms of human cortical development. Nature 598, 205–213, doi: 10.1038/s41586-021-03209-8 (2021). [DOI] [PMC free article] [PubMed] [Google Scholar]
- 190.Trevino AE et al. Chromatin and gene-regulatory dynamics of the developing human cerebral cortex at single-cell resolution. Cell, doi: 10.1016/j.cell.2021.07.039 (2021). [DOI] [PubMed] [Google Scholar]
- 191.Trevino AE et al. Chromatin and gene-regulatory dynamics of the developing human cerebral cortex at single-cell resolution. Cell 184, 5053–5069 e5023, doi: 10.1016/j.cell.2021.07.039 (2021). [DOI] [PubMed] [Google Scholar]
- 192.Morabito S. et al. Single-nucleus chromatin accessibility and transcriptomic characterization of Alzheimer’s disease. Nat Genet 53, 1143–1155, doi: 10.1038/s41588-021-00894-z (2021). [DOI] [PMC free article] [PubMed] [Google Scholar]
- 193.Fasolino M. et al. Single-cell multi-omics analysis of human pancreatic islets reveals novel cellular states in type 1 diabetes. Nat Metab 4, 284–299, doi: 10.1038/s42255-022-00531-x (2022). [DOI] [PMC free article] [PubMed] [Google Scholar]
- 194.Granja JM et al. Single-cell multiomic analysis identifies regulatory programs in mixed-phenotype acute leukemia. Nat Biotechnol 37, 1458–1465, doi: 10.1038/s41587-019-0332-7 (2019). [DOI] [PMC free article] [PubMed] [Google Scholar]
- 195.Hocker JD et al. Cardiac cell type-specific gene regulatory programs and disease risk association. Sci Adv 7, doi: 10.1126/sciadv.abf1444 (2021). [DOI] [PMC free article] [PubMed] [Google Scholar]
- 196.Chiou J. et al. Interpreting type 1 diabetes risk with genetics and single-cell epigenomics. Nature 594, 398–402, doi: 10.1038/s41586-021-03552-w (2021). [DOI] [PMC free article] [PubMed] [Google Scholar]
- 197.Ord T. et al. Single-Cell Epigenomics and Functional Fine-Mapping of Atherosclerosis GWAS Loci. Circ Res 129, 240–258, doi: 10.1161/CIRCRESAHA.121.318971 (2021). [DOI] [PMC free article] [PubMed] [Google Scholar]
- 198.Sheng X. et al. Mapping the genetic architecture of human traits to cell types in the kidney identifies mechanisms of disease and potential treatments. Nat Genet 53, 1322–1333, doi: 10.1038/s41588-021-00909-9 (2021). [DOI] [PMC free article] [PubMed] [Google Scholar]
- 199.Chiou J. et al. Single-cell chromatin accessibility identifies pancreatic islet cell type- and state-specific regulatory programs of diabetes risk. Nat Genet 53, 455–466, doi: 10.1038/s41588-021-00823-0 (2021). [DOI] [PMC free article] [PubMed] [Google Scholar]
- 200.Orchard P. et al. Human and rat skeletal muscle single-nuclei multi-omic integrative analyses nominate causal cell types, regulatory elements, and SNPs for complex traits. Genome Res, doi: 10.1101/gr.268482.120 (2021). [DOI] [PMC free article] [PubMed] [Google Scholar]
- 201.Deng Y. et al. Spatial-CUT&Tag: Spatially resolved chromatin modification profiling at the cellular level. Science 375, 681–686, doi: 10.1126/science.abg7216 (2022). [DOI] [PMC free article] [PubMed] [Google Scholar]
- 202.Wolf FA, Angerer P & Theis FJ SCANPY: large-scale single-cell gene expression data analysis. Genome Biol 19, 15, doi: 10.1186/s13059-017-1382-0 (2018). [DOI] [PMC free article] [PubMed] [Google Scholar]