

Abstract
Purpose:
Experiences of sexuality-based discrimination (ie, minority stressors) against youth who identify as nonheterosexual (ie, sexual minority) have been associated with increased symptoms of anxiety, depression, and post-traumatic stress disorder (PTSD) for sexual minority adolescents (SMA; ages 14–17). However, little is known about the experiences of SMA living in rural communities across the United States. Thus, the present study sought to examine differences in mental health patterns between urban and rural dwelling SMA, and to see whether these differences are, at least in part, explained by experiences of lifetime minority stress.
Methods:
A nationwide sample of SMA residing in the United States (N = 2,558; aged 14–17, M = 15.90 years, SD = 0.98) was recruited through purposive social media and respondent-driven sampling methods to complete a cross-sectional survey online. Measures included those of minority stress, urbanicity, and symptoms of anxiety, depression, and PTSD. Parallel multiple mediation (PMM) analysis was employed to test whether urbanicity was associated with anxiety, depressive, and PTSD symptoms through reported lifetime minority stress.
Findings:
On average, SMA living in rural areas significantly reported more lifetime minority stress, depressive, and PTSD symptoms than SMA living in urban settings. Results from our PMM analysis indicated that heightened experiences of lifetime minority stress indirectly linked the effects of living in rural areas on anxiety (b = −0.288, 95% CI = [−0.491, −0.085]), depressive (b = −0.158, 95% CI = [−0.270, −0.047), and PTSD symptoms PTSD (b = −0.349, 95% CI = [−0.596, −0.105]). The model accounted for 16.8%, 18%, and 24.1% of the variability in anxiety symptoms, depressive symptoms, and PTSD symptoms, respectively.
Conclusions:
SMA in our study who reside in rural areas reported elevated minority stress, depressive, and PTSD symptoms as compared to their urban dwelling peers. Our study found that lifetime experiences of minority stress fully mediated the relationship between urbanicity and both depressive and PTSD symptoms, and partially mediated the relationship between urbanicity and anxiety. These findings highlight the need to increase support for rural youth who are growing into adulthood and may find continuing challenges in their family, peer, and community relationships.
Keywords: adolescent, behavioral health, LGBT, urbanicity
Numerous behavioral health disparities exist for sexual minority adolescents (SMA; ie, youth who identify as something other than heterosexual) compared to their heterosexual peers. SMA experience higher rates of internalizing psychopathology, including depression, anxiety, self-harm, and post-traumatic stress disorder (PTSD) symptomology,1–5 and externalizing behaviors, such as substance use6–8 and suicide attempt.9–11
In the general literature on SMA health, poorer behavioral health outcomes are generally attributed to exposure to both distal (experienced) and proximal (internalized) experiences rooted in stigma and discrimination (ie, minority stress).12 Numerous cross-sectional studies have built an evidence base for a link between minority stress and health, which includes experiences of victimization and family rejection2,13,14 and behavioral health.2,13,15 Similarly, studies have identified that sexual minority-specific victimization and stress experiences mediate the relationships between sexual identity status and depression, PTSD, and suicidality.16–20 That is, the extant literature is in relative agreement on the notion that minority stress is the most likely driver of disparities between SMA and their heterosexual peers.
There is reason to believe minority stress may be different between rural adolescents and their urban peers, but this has only been examined indirectly. In their National School Climate Surveys, GLSEN has repeatedly found that rural SMA are less likely than urban and suburban youth to report access to a Gender and Sexuality Alliance student group, positive LGBTQ inclusion in curriculum, access to supportive educators, or antibullying policies in schools.21–23 Additionally, largely qualitative and geographically limited studies have found that SMA commonly report social and geographic isolation, exposure to restrictive social policies,24–31 high levels of anti-LGBTQ religiosity,32–34 and lower access to SMA peers, community spaces, and affirming services,25,31,35–38 which may set the stage for higher exposure to minority stress experiences. Taking this 1 step further, Hatzenbuehler and colleagues39,40 found that SMA living in areas of a state with less protective school policies and climates were associated with higher rates of mental health concerns, including suicidal ideation and behaviors.
The behavioral health concerns burdening SMA may be worse in rural communities across the United States for various reasons; however, our understanding of these youth is quite limited. Numerous reviews continue to highlight that most studies of sexual minorities involve urban-dwelling populations, making applicability to rural settings uncertain.41,42 Further, despite numerous population-based surveys now including measures of sexual identity,43,44 a recent systematic review found no published studies using national datasets to distinguish between rural and urban sexual minority people.45 Of the sparse studies available, most reported on the experiences of adults or neglected to specify age. In this limited field of research, rural sexual minority youth appear to be at higher risk of suicide compared to their rural heterosexual peers46 and other urban sexual minority youth.47 Given that 19% of the total population resides in rural areas48 (and between 2.9 and 3.8 million of these individuals are sexual and gender minority),49 the general lack of attention to this population is notable.
Given the extant literature, it is not difficult to draw the conclusion that living in rural areas may lead to higher rates of minority stress and thus drive behavioral health patterns for SMA. Yet, to our knowledge, no national US studies have directly examined this phenomenon. With a large purposive national sample of US-based SMA, this study aimed to address this gap by examining: (1) whether there are differences in behavioral health patterns (ie, depression, anxiety, and PTSD symptoms) between urban and rural SMA and (2) whether these differences are mediated by the reporting of minority stress experiences, using a comprehensive 54-item measure of minority stress designed for use with adolescents.50
METHODS
Participants
A nationwide sample of SMA residing in the United States (N = 2,558; aged 14–17, M = 15.90 years, SD = 0.98) responded to an online baseline survey of the longitudinal [name of parent study redacted for blind review]. A majority of the sample was assigned female at birth (64.3%) and identified as white or Caucasian (60.4%). Bisexual and pansexual respondents were the largest sexual orientation group (48.3%), followed by gay and lesbian (43.1%), queer (2.7%), and another sexual orientation (5.9%; see Table 1 for additional demographics).
TABLE 1.
Sample demographics (N = 2,558)
| n | % | |
|---|---|---|
| Urbanicity (RUCA Categorization A) | ||
| Urban | 504 | 19.7 |
| Rural | 2,054 | 80.3 |
| RUCA Categorization E | ||
| Urban | 2,054 | 80.3 |
| Large rural city/town | 317 | 12.4 |
| Small rural town | 117 | 4.6 |
| Isolated small rural town | 70 | 2.7 |
| Region | ||
| West | 630 | 24.6 |
| Southwest | 336 | 13.1 |
| Midwest | 448 | 17.5 |
| Southeast | 592 | 23.1 |
| Northeast | 552 | 21.6 |
| Sexual orientation | ||
| Gay/lesbian | 1,078 | 42.1 |
| Bisexual/pansexual | 1,198 | 46.8 |
| Queer | 52 | 2.0 |
| Complex/multiple identities | 81 | 3.2 |
| Another identity | 150 | 5.9 |
| Race/ethnicity | ||
| White | 1,549 | 60.6 |
| Asian/Pacific Islander | 164 | 6.4 |
| Black or African American | 199 | 7.8 |
| Native American, American | 59 | 2.3 |
| Indian, or Alaskan Native | ||
| Latino/Hispanic | 370 | 14.5 |
| Multiracial | 217 | 8.5 |
| Free or reduced-price lunch | ||
| Yes | 991 | 39.5 |
| No | 1,519 | 60.5 |
| Out to family | ||
| Yes | 1,968 | 76.9 |
| No | 590 | 23.1 |
Note: Participants who indicated they were “Unsure” when asked about free or reduced price lunch eligibility (n=302) were coded as “No.”
Procedure
Recruitment, eligibility, and data collection
Nationwide targeted paid advertisements through varying social media platforms were used to screen, invite, and enroll SMA into the current study. SMA were eligible to participate in the study if they were between 14 and 17 years old; were cisgender male or female (ie, reported a current gender identity consistent with their sex assigned at birth); resided in the United States; and identified as not 100% heterosexual as operationalized by Add Health guidelines.51,52 All participants in the study had to identify as cisgender at baseline because the primary aim of the parent study was to understand sexual minority stress over time using a novel measure, the Sexual Minority Adolescent Stress Inventory (SMASI). Although subsequent research with the SMASI has reported its utility with sexual and gender minority youth,53 at the time, the SMASI had only been validated with cisgender SMA. Thus, lacking a strong measure that could disaggregate sexual and gender minority-related stress among adolescents who are both sexual and gender minorities, we restricted participation to youth with cisgender identities for the baseline survey.
Survey responses were collected online via Qualtrics survey software.54 Institutional review board approval was obtained at the host university. Participants gave informed assent online prior to completing the online questionnaires and received $15 via e-gift card for their time and efforts. The recruitment also included respondent-driven sampling, wherein participants had the opportunity to earn up to 3 additional $10 gift cards if they successfully referred eligible participants to the study.
Measures
Urbanicity
ZIP code of residence was collected and recoded into a dichotomous indicator of urbanicity (0 = rural, 1 = urban) based on recommended guidelines, for adapting Rural-Urban Commuting Area (RUCA) codes.55 Specifically, “urban” was defined as a ZIP code with a corresponding RUCA version 3.1 code of 1.0, 1.1, 2.0, 2.1, 4.1, 5.1, 7.1, 8.1, and 10.1; “rural” was defined as all other valid RUCA v. 3.1 codes. For ZIP codes that were not assigned a RUCA 3.1 score due to changes in the classification system between RUCA versions 2 and 3, we used the RUCA version 2.0 code.
Lifetime experiences of adolescent minority stress
Lifetime experiences of adolescent minority stress were assessed with 10 subscales of the SMASI.56 Subscales included items like “I have been physically assaulted in the neighborhood where I live because I am LGBTQ,” “A religious leader tried to change my sexual orientation,” and “My parents are uncomfortable with LGBTQ people,” with binary response options (0 = no, 1 = yes). Higher percentages reflected more lifetime experiences of minority stress. The internal consistency of the binary response options was assessed with the ordinal omega coefficient, which was ω = 0.92.
Anxiety symptoms
The Generalized Anxiety Disorder 7-item asked participants to rate the severity of anxiety-related symptoms.58 Participants rated these items (eg, “feeling nervous, anxious, or on edge” and “trouble relaxing”) on a 4-point Likert scale (0 = not at all to 3 = nearly every day). Higher summed scores suggested elevated severity of anxiety symptoms. Cronbach’s alpha for the scale was α = 0.90.
Depressive symptoms
The 4-item Center for Epidemiological Studies Depression Scale was used to assess depressive symptoms.59 This measure assessed the number of days in the past week that participants experienced depressive symptoms with statements (eg, “I felt depressed,” “I felt lonely,” and “I had crying spells”) scored on a 4-point Likert scale (0 = rarely or none of the time, 3 = most or all of the time). Higher summed response scores are indicative of more depression symptomology. Cronbach’s alpha for the scale was α = 0.84.
PTSD symptoms
The 6-item Abbreviated PTSD Checklist – Civilian Version was used to assess PTSD symptoms.60 This measure assessed how much participants have been bothered by PTSD symptoms (eg, “Repeated, disturbing memories, thoughts, or images of a stressful experience from the past” and “Feeling distant or cut off from other people”) rated on a 5-point Likert scale (1 = not at all to 5 = extremely). Higher summed scores were indicative of more PTSD symptoms. Cronbach’s alpha for the scale was α = 0.84.
Covariates
Sociodemographic characteristics
Participants’ age, race and ethnicity (0 = White and 1 = people of color), sex assigned at birth (0 = female, 1 = male), sexual orientation disclosure to at least 1 family member (0 = no, 1 = yes), and current eligibility for free or reduced-price lunch (as a proxy for socioeconomic status [SES]; 0 = no, 1 = yes) were included as covariates in the main analyses. These covariates were included in the main analyses because younger,10,61 sex-designated female at birth,62,63 non-White,64,65 plurisexual (eg, bisexual, pansexual, and queer),66 nondisclosed,67 and low SES sexual minority persons report worse health than their older, male, White, monosexual (ie, gay/lesbian), disclosed, and high SES counterparts.68,69
Analytic plan
First, we conducted correlations and t-tests to confirm associations between urbanicity, lifetime adolescent minority stress, and mental health. Then, we conducted a parallel multiple mediation (PMM) analysis to test whether urbanicity was indirectly associated with anxiety, depressive, and PTSD symptoms through lifetime adolescent minority stress (paths a1b1, a1b2, and a1b3, respectively). Indirect effects were derived from multiplying the effect of urbanicity on lifetime adolescent minority stress (a1) by the effect of lifetime minority stress on anxiety (a1*b1), depressive (a1*b2), and PTSD symptoms (a1*b3). The indirect associations of urbanicity with anxiety, depressive, and PTSD symptoms through lifetime adolescent minority stress met mediation criteria if the bias-corrected accelerated confidence intervals (BCa CIs) of the tested indirect effect did not include zero.70
All models were fitted as path models with the lavaan package version 0.6–5 in R Version 3.6.2,71,72 adjusting for all associated covariates in the model. We obtained 95%BCa CIs for the model estimates using bootstrapping.70,73 The degree of model fit was assessed with the comparative fit index (CFI), Tucker-Lewis index (TLI), normed fit index (NFI), root mean square error of approximation (RMSEA), and standardized root mean square residual (SRMR). Model fit was considered acceptable if the CFI, TLI, and NFI values were > 0.95 and RMSEA and SRMR values were < 0.06 and < 0.08, respectively.74 Full information maximum likelihood was used to estimate missing data.
RESULTS
Descriptive analyses
Table 2 displays the means (M), standard deviations (SD), and zero-order correlations for all continuous variables in the study. The majority of SMA (80.3%) dwelled in an urban setting, with the rest living in rural areas (19.7%). Regionally, larger proportions of SMA resided in the West (24.6%), Southeast (23.1%), Northeast (21.6%), and Midwest (17.5%), and fewer SMA resided in the Southwest (13.1%).
TABLE 2.
Descriptive statistics, zero-order correlations among main predictor, outcome, and control variables
| M | SD | Min | Max | Skewness | 1 | 2 | 3 | 4 | 5 | |
|---|---|---|---|---|---|---|---|---|---|---|
| 1SMASI Lifetime | 20.13 | 9.88 | 0.00 | 54.00 | 0.310 | - | 0.348** | 0.335** | 0.425** | 0.026 |
| 2 Anxiety symptoms | 11.79 | 5.96 | 0.00 | 21.00 | −0.158 | - | 0.624** | 0.682** | −0.066** | |
| 3 Depressive symptoms | 6.32 | 3.41 | 0.00 | 12.00 | −0.046 | - | 0.646** | −0.060** | ||
| 4 PTSD symptoms | 17.42 | 5.99 | 6.00 | 30.00 | 0.145 | - | −0.051** | |||
| 5 Age | 15.90 | 0.98 | 14.00 | 17.00 | −0.465 | - |
Note: N = 2,558
p < .01 (all tests were 2 tailed).
SMA living in rural areas reported more lifetime minority stress (M = 21.04, SD = 9.60), anxiety (M = 12.57, SD = 6.07), depressive (M = 6.83, SD = 3.37), and PTSD symptoms (M = 18.17, SD = 6.15) than SMA living in urban settings (Ms = 19.91, 11.61, 6.20, 17.23; SDs = 9.94, 5.92, 3.41, 5.94; all t’s > |2.47|, P’s < .05). Anxiety, depressive, and PTSD symptoms were positively intercorrelated and covaried in the main analyses. Other demographic differences in mental health outcomes included that White SMA reported less lifetime minority stress (M = 19.73, SD = 9.79) and more anxiety symptoms (M = 12.07, SD = 6.00) than SMA of color (Ms = 20.73, 11.34; SDs = 9.99, 5.87; all t’s > |2.27|, P’s < .05). SMA assigned female at birth reported more anxiety (M = 12.60, SD = 5.73), depressive (M = 6.89, SD = 3.23), and PTSD symptoms (M = 18.32, SD = 5.72) than SMA assigned male at birth (Ms = 10.34, 5.31, 15.79; SDs = 6.08, 3.42, 6.11; all t’s > 9.37, P’s < .001). SMA who received free- or reduced-price lunch reported more anxiety (M = 12.34, SD = 5.94), depressive (M = 6.80, SD = 3.47), and PTSD symptoms (M = 18.37, SD = 6.19) than SMA who did not receive free or reduced-price lunch (Ms = 11.44, 6.01, 16.76; SDs = 5.95, 3.34, 5.75; all t’s > |3.73|, P’s < .001). SMA who were out to at least 1 family member had elevated PTSD symptoms (M = 17.57, SD = 6.08) compared to SMA not out to their families (M = 16.91, SD = 5.64, t = −2.37, P < .05l; see Supplementary Results for complete bivariate results).
Associations between urbanicity and mental health through lifetime adolescent minority stress
We used PMM analysis to test whether associations between urbanicity and mental health indexes were linked through lifetime adolescent sexual minority stress. These associations were tested while adjusting for participants’ age, race and ethnicity, sex assigned at birth, sexual orientation disclosure to at least 1 family member, and eligibility for free or reduced-price lunch. Both standardized and unstandardized linear regression coefficients for total, direct, and indirect effects are reported in Table 3 and standardized coefficients are provided in path diagram form in Figure 1 to facilitate interpretation.
TABLE 3.
Parallel multiple mediation results
| Outcome | Predictor | Label | B | Est(b) | SE | 95%LCI | 95% UCI |
|---|---|---|---|---|---|---|---|
| a paths | |||||||
| SMASI Lifetime | |||||||
| Urbanicity (rural=0, urban=1) | a 1 | −0.055 | −0.137 | 0.050 | −0.234 | −0.041 | |
| Age | 0.025 | 0.026 | 0.020 | −0.014 | 0.065 | ||
| Race/ethnicity (White=0, POC=1) | 0.053 | 0.106 | 0.042 | 0.023 | 0.189 | ||
| Sex designated at birth (0=F/1=M) | 0.002 | 0.004 | 0.042 | −0.079 | 0.087 | ||
| Free or fee-reduced lunch (0=N/1=Y) | 0.014 | 0.029 | 0.043 | −0.054 | 0.113 | ||
| Out to family (Not out=0, Out=1) | 0.039 | 0.092 | 0.045 | 0.004 | 0.179 | ||
| a and c’ paths | |||||||
| Anxiety symptoms | |||||||
| Urbanicity | c’1 | −0.036 | −0.545 | 0.281 | −1.086 | 0.014 | |
| SMASI Lifetime | b 1 | 0.349 | 2.101 | 0.116 | 1.866 | 2.323 | |
| Age | −0.061 | −0.374 | 0.111 | −0.589 | −0.152 | ||
| Race/ethnicity | −0.052 | −0.629 | 0.172 | −0.979 | −0.294 | ||
| Sex designated at birth | −0.180 | −2.241 | 0.230 | −2.683 | −1.781 | ||
| Free or fee-reduced lunch | 0.068 | 0.832 | 0.228 | 0.390 | 1.293 | ||
| Out to family | −0.011 | −0.152 | 0.256 | −0.648 | 0.358 | ||
| Depressive symptoms | |||||||
| Urbanicity | c’2 | −0.055 | −0.471 | 0.154 | −0.772 | −0.170 | |
| SMASI Lifetime | b 2 | 0.333 | 1.152 | 0.065 | 1.024 | 1.276 | |
| Age | −0.056 | −0.196 | 0.064 | −0.323 | −0.070 | ||
| Sex designated at birth | −0.222 | −1.580 | 0.130 | −1.830 | −1.323 | ||
| Free or fee-reduced lunch | 0.093 | 0.651 | 0.129 | 0.398 | 0.903 | ||
| Out to family | 0.002 | 0.015 | 0.144 | −0.277 | 0.293 | ||
| PTSD symptoms | |||||||
| Urbanicity | c’3 | −0.038 | −0.570 | 0.275 | −1.121 | −0.046 | |
| SMASI Lifetime | b 3 | 0.421 | 2.551 | 0.112 | 2.330 | 2.769 | |
| Age | −0.053 | −0.327 | 0.109 | −0.546 | −0.110 | ||
| Sex designated at birth | −0.202 | −2.522 | 0.218 | −2.949 | −2.100 | ||
| Free or fee-reduced lunch | 0.110 | 1.344 | 0.220 | 0.909 | 1.772 | ||
| Out to family | 0.026 | 0.376 | 0.238 | −0.097 | 0.838 | ||
| Covariances | |||||||
| Urbanicity | |||||||
| Race/ethnicity | 0.180 | 0.035 | 0.004 | 0.028 | 0.042 | ||
| Free or fee-reduced lunch | −0.084 | −0.016 | 0.004 | −0.024 | −0.009 | ||
| Out to family | 0.004 | 0.001 | 0.003 | −0.006 | 0.007 | ||
| Anxiety symptoms | |||||||
| Depressive symptoms | 0.546 | 9.166 | 0.354 | 8.513 | 9.895 | ||
| PTSD symptoms | 0.608 | 17.242 | 0.611 | 16.119 | 18.482 | ||
| Depressive symptoms | |||||||
| PTSD symptoms | 0.558 | 8.999 | 0.347 | 8.346 | 9.718 | ||
| Indirect and Total effects for Anxiety symptoms | |||||||
| Indirect effect | (a1 *b1) | −0.019 | −0.288 | 0.105 | −0.491 | −0.085 | |
| Total effect | c’1 + (a1 *b1) | −0.056 | −0.833 | 0.294 | −1.411 | −0.262 | |
| Indirect and Total effects for Depressive symptoms | |||||||
| Indirect effect | (a1 *b2) | −0.018 | −0.158 | 0.058 | −0.270 | −0.047 | |
| Total effect | c’2 + (a1 *b2) | −0.073 | −0.629 | 0.161 | −0.941 | −0.314 | |
| Indirect and Total effects for PTSD symptoms | |||||||
| Indirect effect | (a1 *b3) | −0.023 | −0.349 | 0.127 | −0.596 | −0.105 | |
| Total effect | c’3 + (a1 *b3) | −0.061 | −0.919 | 0.295 | −1.509 | −0.340 | |
Note. B, standardized regression parameter estimates; b, unstandardized regression parameter estimates; LCI and UCI, lower confidence interval and upper confidence interval (bias-corrected accelerated 95%); 10,000 bootstrap samples. Significant BCa CIs are presented in bold font.
FIGURE 1.
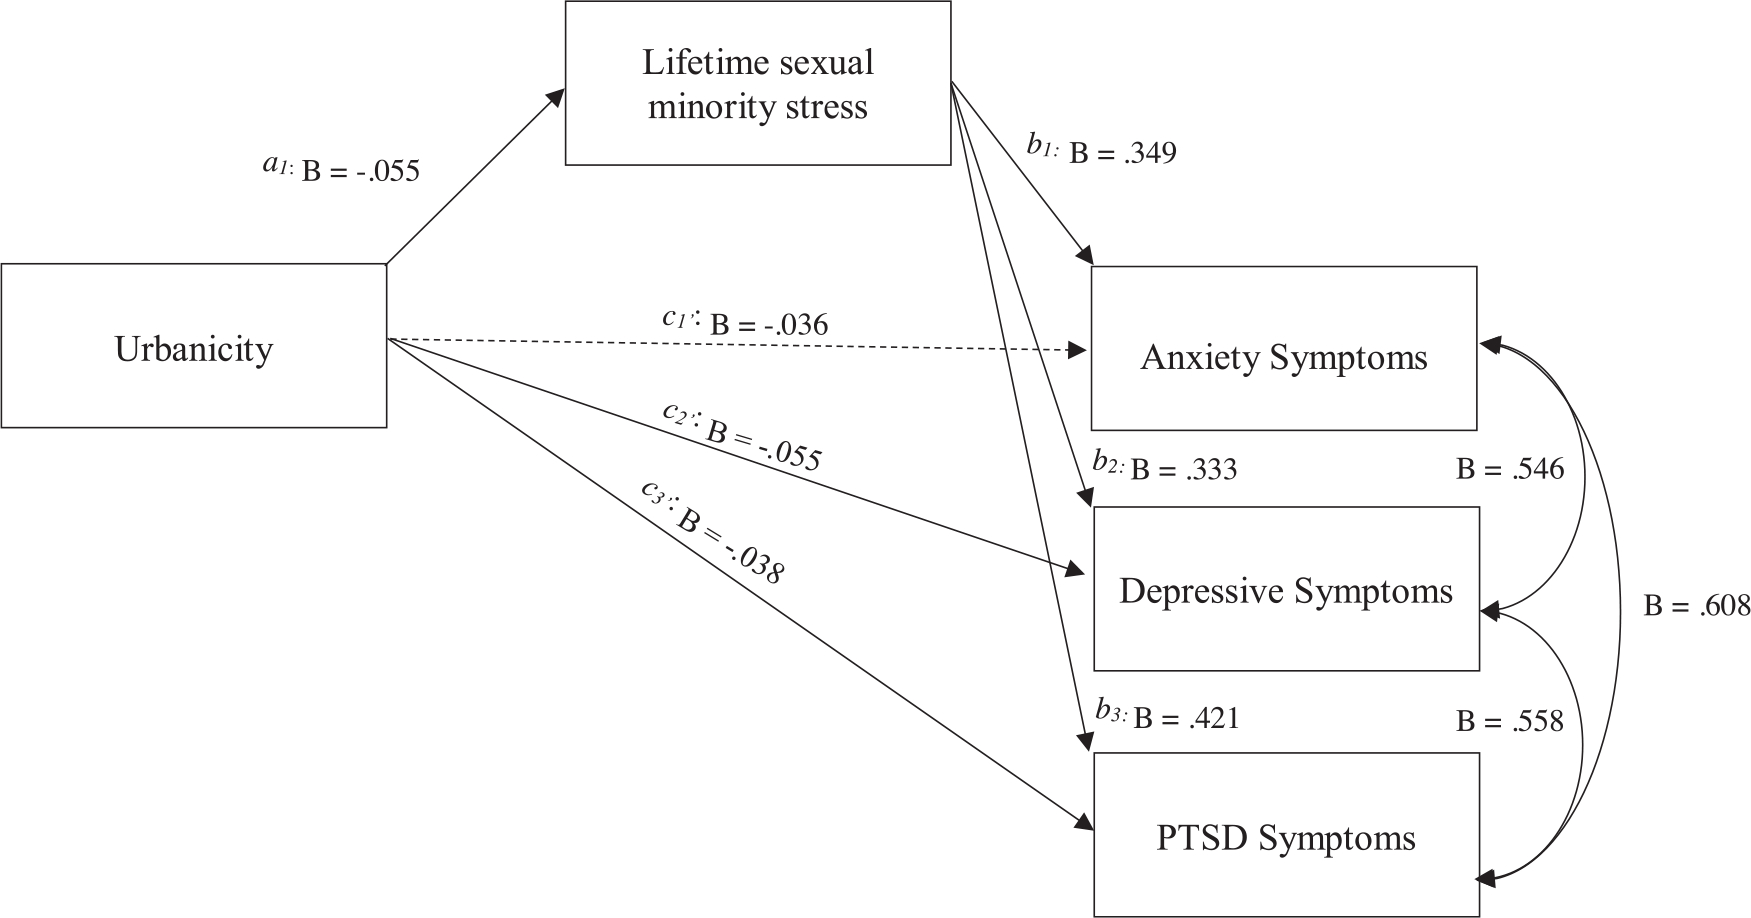
Statistical diagram of mediation with main predictor and outcome variables. Notes. Figure 1 represents the statistical model testing direct (c1’, c2’, and c3’), indirect (a1*b1, a1*b2, and a1*b3), and total (c1, c2, and c3) effects linking the association between urbanicity and mental health indices indirectly through lifetime adolescent sexual minority stress. Solid arrows represent statistically significant pathways. The betas (B) are standardized regression parameter estimates. For simplicity, covariates and covariances are not shown in diagram form and are presented in Table 3.
Overall, the model showed an excellent fit to the data (χ2 = 7.36, df = 4, P = .118; CFI = 0.999; TLI = 0.991; NFI = 0.998; RMSEA = 0.018, 90% BCa CIs [0.000, 0.038]; SRMR = 0.007), accounting for 16.8%, 18%, and 24.1% of the variability in anxiety symptoms, depressive symptoms, and PTSD symptoms, respectively.
The total effects of urbanicity on anxiety (c1: b = −0.833, 95%BCa CI = [−1.411, −0.262]), depressive (c2: b = −0.629, 95%BCa CI = [− 0.941, −0.314]), and PTSD symptoms (c3: b = −0.919, 95%BCa CI = [−1.509, −0.340]) were significant. The direct effects of urbanicity on depressive (c’2: b = −0.471, 95%BCa CI = [−0.772, −0.170]) and PTSD symptoms (c’3: b = −0.570, 95%BCa CI = [−1.121, −0.046]) were significant and the direct effect of urbanicity on anxiety symptoms (c’1) was not significant. Living in an urban environment (a1: b = −0.137, 95%BCa CI = [−0.234, −0.041]) was negatively associated with lifetime adolescent minority stress, such that SMA living in rural areas in the United States reported elevated lifetime minority stress. Lifetime adolescent minority stress, in turn, was positively associated with anxiety (b1: b = 2.101, 95%BCa CI = [1.866, 2.323]), depressive (b2: b = 1.152, 95%BCa CI = [1.024, 1.276]), and PTSD symptoms (b3: b = 2.551, 95%BCa CI = [2.330, 2.769]). Lifetime adolescent minority stress indirectly linked urbanicity to anxiety (a1b1: b = −0.288, 95%BCa CI = [−0.491, −0.085]), depressive (a1b2: b = −0.158, 95%BCa CI = [−0.270, −0.047), and PTSD (a1b3: b = −0.349, 95%BCa CI = [−0.596, −0.105]) symptoms. Urbanicity was associated with anxiety, depressive, and PTSD symptoms through lifetime minority stress among SMA in the United States.
DISCUSSION
The current study examined the association of living in an urban versus rural area of the United States on mental health symptoms in a nationwide sample of SMA. Moreover, we tested whether the relationships between urbanicity and anxiety, depressive, and PTSD symptoms were indirectly linked through lifetime adolescent minority stress experiences. As we expected, SMA in our study who reside in rural areas reported elevated depressive and PTSD symptoms as compared to their urban peers. These findings build on the existing literature suggesting behavioral health disparities between urban and rural sexual minority persons and extend our knowledge regarding adolescents living in these areas of the United States.47 They further highlight the need to increase support for rural youth who are growing into adulthood and may find continuing challenges in their family, peer, and community relationships.75
A second component of our study explored whether rural SMA reported more experiences of minority stress than urban SMA. This set of findings expands on the limited research available that indicates that rural SMA may indeed not only be exposed to environments that tend to be less supportive but that these environments may also result in increased rates of victimization and social isolation. To that end, more research is needed to understand the link between environmental characteristics (eg, local and state policy, access to services), experiences of minority stress, and behavioral health. Whereas prior studies have examined the relationship between environment and health and our study described the relationship between minority stress and health, future research should interrogate the relationships between all these components in tandem.
Perhaps most notably, our study found that lifetime experiences of minority stress fully mediated the relationship between urban or rural residence and both depressive and PTSD symptoms and partially mediated the relationship with anxiety symptoms. Thus, reducing both the experience of minority stressors and the impact that they may have on health after being experienced is paramount. This can likely be addressed through both preventive individual and policy interventions and separately through better access to affirming behavioral health providers.
Regarding the former, programs at the individual and structural levels may be warranted. Research has suggested that reducing minority-related stressors may improve mental health outcomes,76,77 and more research on school-based interventions for SMA coping with minority stressors is warranted. Similarly, interventions to increase protections in schools and community settings that can be employed in rural locations are needed. For example, Day and associates identified 5 key features of LGBT-inclusive schools, including policies, active Gender and Sexuality Alliances, safe spaces, professional development, and access to other community resources.78 Barriers and strategies to implementing these changes in rural settings may be a key aspect to preventing poor health patterns before they start.
Regarding the latter, unfortunately, evidence suggests that the negative experiences of rural SMA may be further exacerbated by a lack of access to sexual minority-affirming services and other providers in rural communities, which has been previously highlighted by the National Academies of Sciences, Engineering, and Medicine (previously the Institute of Medicine).79,80 Indeed, multiple studies reported that LGBT people in rural areas experience limited access to LGBT support systems, affirming care, and providers and report a higher incidence of stigma and rejection.37,81 Even when providers suggest they serve LGBT patients equally, rural providers commonly report discomfort with LGBT patients.82 Further, although studies have found that involvement in the LGBT community can be protective against behavioral health concerns,83 sexual minorities in rural areas may be unable to access these resources, exacerbating social isolation.28,30,84 Indeed, promoting awareness of LGBT services in rural areas is seen as so difficult, it has led to research on how to overcome obstacles in outreach in these “daunting” settings.85 More research on how to best support providers in rural settings is needed to reduce the health gap.
Although our study addressed a notable gap in the literature on rural SMA health and minority stress, it is not without limitations. We relied on cross-sectional data, and although both theoretical and other longitudinal work has supported the prospective relation in the population and our modeling strategy,86 associations reported should not be interpreted as causal. Second, the mental health measures employed in the study were designed for use as screeners, not as diagnostic tools. Thus, although we used reliable and valid measures of symptomology, future studies may seek to use more specific diagnostic measurements or link with clinical records when assessing mental health disparities. Finally, although our study had a broad representation across the United States, our sampling method relied on purposive strategies and thus generated a nonprobability sample. One way this may manifest is through technology access, whereby youth in rural communities who already experience lower internet connectivity might have been less likely to participate. Given the positive role that many SMA indicate that internet access plays in their life (eg, access to support systems, medically accurate knowledge about sexual and gender identity, positive messages of optimism),87–89 it is possible that those who were unable to participate have heightened experiences of discrimination and/or less access to social support. Thus, although we do not believe the relation between urbanicity, minority stress, and mental health symptoms would be lessened with their inclusion, it may be that the disparities are much greater if these more isolated, less connected youth had the opportunity to participate.
Despite these limitations, the current study adds novel insights into the health of a relatively unstudied population in the rural United States. Although living in rural settings may come with increased stressors for SMA, there are many advantages of rural community living, including the cost of living, space, a stronger sense of local community, and access to amenities not often found in urban centers. Thus, we assert that if more attention is paid to addressing the needs of SMA living in these communities, we can effectively address these critical health disparities and ensure equal access to health and wellness for youth no matter where they choose to live in the United States.
ACKNOWLEDGMENTS AND DISCLOSURES
Research reported in this publication was supported by the National Institute on Minority Health and Health Disparities of the National Institutes of Health under award number R01MD012252. The content is solely the responsibility of the authors and does not necessarily represent the official views of the National Institutes of Health.
Funding information
National Institute of Minority Health and Health Disparities, Grant/Award Number: 5R01MD012252
Footnotes
CONFLICTS OF INTEREST
The authors report no conflicts of interest.
REFERENCES
- 1.Berghe WV, Dewaele A, Cox N, Vincke J. Minority-specific determinants of mental well-being among lesbian, gay, and bisexual youth. J Appl Soc Psychol. 2010;40(1):153–166. [Google Scholar]
- 2.Goldbach JT, Schrager SM, Dunlap SL, Holloway IW. The application of minority stress theory to marijuana use among sexual minority adolescents. Subst Use Misuse. 2015;50(3):366–375. [DOI] [PubMed] [Google Scholar]
- 3.Hendricks M, Testa RJ. Model for understanding risk and resiliency in transgender and gender-nonconforming individuals. Prof Psychol Res Pract. 2012;43(5):460–467. [Google Scholar]
- 4.Kaufman TM, Baams L, Veenstra R. Disparities in persistent victimization and associated internalizing symptoms for heterosexual versus sexual minority youth. J Res Adolesc. 2020;30:516–531. [DOI] [PMC free article] [PubMed] [Google Scholar]
- 5.Whitbeck LB, Chen X, Hoyt DR, Tyler KA, Johnson KD. Mental disorder, subsistence strategies, and victimization among gay, lesbian, and bisexual homeless and runaway adolescents. J Sex Res. 2004;41(4):329–342. [DOI] [PubMed] [Google Scholar]
- 6.Goldbach JT, Mereish EH, Burgess C. Sexual orientation disparities in the use of emerging drugs. Subst Use Misuse. 2017;52(2):265–271. [DOI] [PubMed] [Google Scholar]
- 7.Marshal MP, Friedman MS, Stall R. Sexual orientation and adolescent substance use: a meta-analysis and methodological review. Addiction. 2008;103(4):546–556. [DOI] [PMC free article] [PubMed] [Google Scholar]
- 8.Moon MW, Fornili K, O’Briant AL. Risk comparison among youth who report sex with same-sex versus both-sex partners. Youth Soc. 2007;38(3):267–284. [Google Scholar]
- 9.Coker TR, Austin SB, Schuster MA. The health and health care of lesbian, gay, and bisexual adolescents. Annu Rev Public Health. 2010;31:457–477. [DOI] [PubMed] [Google Scholar]
- 10.Marshal MP, Dietz LJ, Friedman MS. Suicidality and depression disparities between sexual minority and heterosexual youth: a meta-analytic review. J Adolesc Health. 2011;49(2):115–123. [DOI] [PMC free article] [PubMed] [Google Scholar]
- 11.Haas APEM, Mays VM, Mathy RM. Suicide and suicide risk in lesbian, gay, bisexual, and transgender populations: review and recommendations. J Homosex. 2011;58(1):10–51. [DOI] [PMC free article] [PubMed] [Google Scholar]
- 12.Meyer IH. Prejudice, social stress, and mental health in lesbian, gay, and bisexual populations: conceptual issues and research evidence. Psychol Bull. 2003;129(5):674. [DOI] [PMC free article] [PubMed] [Google Scholar]
- 13.Alessi EJ, Martin JI, Gyamerah A, Meyer IH. Prejudice events and traumatic stress among heterosexuals and lesbians, gay men, and bisexuals. J Aggress Maltreatment Trauma. 2013;22(5):510–526. [PMC free article] [PubMed] [Google Scholar]
- 14.Goldbach JT, Tanner-Smith EE, Bagwell M, Dunlap S. Minority stress and substance use in sexual minority adolescents: a meta-analysis. Prev Sci. 2014;15(3):350–363. [DOI] [PubMed] [Google Scholar]
- 15.Gamarel KE, Reisner SL, Laurenceau JP, Nemoto T, Operario D. Gender minority stress, mental health, and relationship quality: a dyadic investigation of transgender women and their cisgender male partners. J Fam Psychol. 2014;28(4):437. [DOI] [PMC free article] [PubMed] [Google Scholar]
- 16.Reisner SL, Greytak EA, Parsons JT, Ybarra ML. Gender minority social stress in adolescence: disparities in adolescent bullying and substance use by gender identity. J Sex Res. 2015;52(3):243–256. [DOI] [PMC free article] [PubMed] [Google Scholar]
- 17.Chodzen G, Hidalgo MA, Chen D, Garofalo R. Minority stress factors associated with depression and anxiety among transgender and gender-nonconforming youth. J Adolesc Health. 2019;64(4):467–471. [DOI] [PMC free article] [PubMed] [Google Scholar]
- 18.Katz-Wise SL, Rosario M, Calzo JP, Scherer EA, Sarda V, Austin SB. Associations of timing of sexual orientation developmental milestones and other sexual minority stressors with internalizing mental health symptoms among sexual minority young adults. Arch Sex Behav. 2017;46(5):1441–1452. [DOI] [PMC free article] [PubMed] [Google Scholar]
- 19.Mustanski B, Andrews R, Puckett JA. The effects of cumulative victimization on mental health among lesbian, gay, bisexual, and transgender adolescents and young adults. Am J Public Health. 2016;106(3):527–533. [DOI] [PMC free article] [PubMed] [Google Scholar]
- 20.Teasdale B, Bradley-Engen MS. Adolescent same-sex attraction and mental health: the role of stress and support. J Homosex. 2010;57(2):287–309. [DOI] [PubMed] [Google Scholar]
- 21.Palmer N, Kosciw J, Bartkiewicz M. Strengths and Silences: The Experiences of Lesbian, Gay, Bisexual and Transgender Students in Rural and Small Town Schools. GLSEN; 2012. [Google Scholar]
- 22.Kosciw JG, Greytak EA, Zongrone AD, Clark CM, Truong NL. The 2017 National School Climate Survey: the Experiences of Lesbian, Gay, Bisexual, Transgender, and Queer Youth in Our Nation’s Schools. A Report from GLSEN. 2018. [Google Scholar]
- 23.Kosciw JG, Clark CM, Truong NL, Zongrone AD. The 2019 National School Climate Survey: the Experiences of Lesbian, Gay, Bisexual, Transgender, and Queer Youth in Our Nation’s Schools. A Report from GLSEN. 2020. [Google Scholar]
- 24.Barefoot KN, Rickard A, Smalley KB, Warren JC. Rural lesbians: unique challenges and implications for mental health providers. J Rural Ment Health. 2015;39(1):22. [Google Scholar]
- 25.Kennedy M Rural men, sexual identity and community. J Homosex. 2010;57(8):1051–1091. [DOI] [PubMed] [Google Scholar]
- 26.King S, Dabelko-Schoeny H. “Quite frankly, I have doubts about remaining”: aging-in-place and health care access for rural midlife and older lesbian, gay, and bisexual individuals. J LGBT Health Res. 2009;5(1–2):10–21. [Google Scholar]
- 27.Leedy G, Connolly C. Out in the cowboy state: a look at lesbian and gay lives in Wyoming. J Gay Lesbian Soc Serv. 2007;19(1):17–34. [Google Scholar]
- 28.Lyons A, Hosking W, Rozbroj T. Rural-urban differences in mental health, resilience, stigma, and social support among young Australian gay men. J Rural Health. 2015;31(1):89–97. [DOI] [PubMed] [Google Scholar]
- 29.Preston DB, D’augelli AR, Kassab CD, Starks MT. The relationship of stigma to the sexual risk behavior of rural men who have sex with men. AIDS Educ Prev. 2007;19(3):218–230. [DOI] [PubMed] [Google Scholar]
- 30.Smalley KB, Warren JC, Rickard A, Barefoot KN. Rural gender and sexual minority health. In: Smalley KB, Warren JC, Barefoot KN, eds. LGBT Health: Meeting the Needs of Gender and Sexual Minorities. Springer Publishing Company; 2018:327–343. [Google Scholar]
- 31.Willging CE, Salvador M, Kano M. Unequal treatment: mental health care for sexual and gender minority groups in a rural state. Psychiatr Serv. 2006;57(6):867–870. [DOI] [PubMed] [Google Scholar]
- 32.Dillon M, Savage S. Values and Religion in Rural America: Attitudes toward Abortion and Same-Sex Relations. The Carsey School of Public Policy at the Scholars’ Repository. 2006. https://scholars.unh.edu/cgi/viewcontent.cgi. Last accessed February 19, 2022. [Google Scholar]
- 33.Rickard A, Yancey CT. Rural/non-rural differences in psychosocial risk factors among sexual minorities. J Gay Lesbian Soc Serv. 2018;30(2):154–171. [Google Scholar]
- 34.Whitley jr BE. Religiosity and attitudes toward lesbians and gay men: a meta-analysis. Int J Psychol Relig. 2009;19(1):21–38. [Google Scholar]
- 35.Boulden WT. Gay men living in a rural environment [Special issue]. J Gay Lesbian Soc Serv Issues Pract Policy Res. 2001;12(3–4):63–75. [Google Scholar]
- 36.Choi SK, Baams L, Wilson BD. LGBTQ Youth in California’s Public Schools: Differences Across the State. UCLA School of Law; 2017. [Google Scholar]
- 37.Fisher CM, Irwin JA, Coleman JD. LGBT health in the midlands: a rural/urban comparison of basic health indicators. J Homosex. 2014;61(8):1062–1090. [DOI] [PubMed] [Google Scholar]
- 38.McCarthy L Poppies in a wheat field: exploring the lives of rural lesbians. J Homosex. 2000;39(1):75–94. [DOI] [PubMed] [Google Scholar]
- 39.Hatzenbuehler ML, Keyes KM. Inclusive anti-bullying policies and reduced risk of suicide attempts in lesbian and gay youth. J Adolesc Health. 2013;53(1):S21–S26. [DOI] [PMC free article] [PubMed] [Google Scholar]
- 40.Hatzenbuehler ML, Birkett M, Van Wagenen A, Meyer IH. Protective school climates and reduced risk for suicide ideation in sexual minority youths. Am J Public Health. 2014;104(2):279–286. [DOI] [PMC free article] [PubMed] [Google Scholar]
- 41.Addis S, Davies M, Greene G, MacBride-Stewart S, Shepherd M. The health, social care and housing needs of lesbian, gay, bisexual and transgender older people: a review of the literature. Health Soc Care Community. 2009;17(6):647–658. [DOI] [PubMed] [Google Scholar]
- 42.Boehmer U, Miao X, Linkletter C, Clark MA. Adult health behaviors over the life course by sexual orientation. Am J Public Health. 2012;102(2):292–300. [DOI] [PMC free article] [PubMed] [Google Scholar]
- 43.National Center for Health Statistics. National Health Interview Survey. 2019. [Google Scholar]
- 44.Ward BW, Dahlhamer JM, Galinsky Adena M, Joestl SS. Sexual orientation and health among US adults. Natl Health Stat Report. 2014. [PubMed] [Google Scholar]
- 45.Rosenkrantz DE, Black WW, Abreu RL, Aleshire ME, Fallin-Bennett K. Health and health care of rural sexual and gender minorities: a systematic review. Stigma and Health. 2017;2(3):229–243. 10.1037/sah0000055 [DOI] [Google Scholar]
- 46.Ballard ME, Jameson JP, Martz DM. Sexual identity and risk behaviors among adolescents in rural Appalachia. J Rural Ment Health. 2017;41(1):17–29. [Google Scholar]
- 47.Poon CS, EM S. Out yonder: sexual-minority adolescents in rural communities in British Columbia. Am J Public Health. 2007;99:118–124. [DOI] [PMC free article] [PubMed] [Google Scholar]
- 48.US Census Bureau. Understanding and Using ACS Data: What All Data Users Need to Know. US Census Bureau; 2020. [Google Scholar]
- 49.Movement Advancement Project. 2019. www.lgbtmap.org/rural-lgbt. Last accessed February 19, 2022.
- 50.Schrager SM, Goldbach JT, Mamey MR. Development of the sexual minority adolescent stress inventory. Front Psychol. 2018;9(319):1–16. [DOI] [PMC free article] [PubMed] [Google Scholar]
- 51.Harris KM. Design Features of Add Health. University of North Carolina; at Chapel Hill; 2011. [Google Scholar]
- 52.Harris KM. The Add Health Study: Design and Accomplishments. Carolina Population Center, University of North Carolina; at Chapel Hill; 2013. [Google Scholar]
- 53.Fulginiti A, Goldbach JT, Mamey MR, et al. Integrating minority stress theory and the interpersonal theory of suicide among sexual minority youth who engage crisis services. Suicide Life-Threatening Behav. 2020;50(3):601–616. [DOI] [PubMed] [Google Scholar]
- 54.Qualtrics. Qualtrics Survey Software. 2020.
- 55.US Department of Agriculture. Rural-Urban Commuting Area Codes. 2020. https://www.ers.usda.gov/data-products/rural-urban-commuting-area-codes/. Last accessed February 19, 2022.
- 56.Goldbach JT, Schrager S, Mamey MR, Rhoades H. Confirming the reliability and validity of the Sexual Minority Adolescent Stress Inventory in a national sample of sexual minority adolescents. Frontiers in Psychology. 2021;3457. 10.3389/fpsyg.2021.720199 [DOI] [PMC free article] [PubMed] [Google Scholar]
- 57.Spitzer RL, Kroenke K, Williams JB, Löwe B. A brief measure for assessing generalized anxiety disorder: the GAD-7. Arch Intern Med. 2006;166(10):1092–1097. [DOI] [PubMed] [Google Scholar]
- 58.Melchior LA, Huba G, Brown VB, Reback CJ. A short depression index for women. Educ Psychol Meas. 1993;53(4):1117–1125. [Google Scholar]
- 59.Lang AJ, Wilkins K, Roy-Byrne PP. An Abbreviated PTSD Checklist (PCL) as a guide to clinical response. Gen Hosp Psychiatry. 2012;34(4):332–338. [DOI] [PMC free article] [PubMed] [Google Scholar]
- 60.Wise AE, Smith BC, Armelie AP, Boarts JM, Delahanty DL. Age moderates the relationship between source of social support and mental health in racial minority lesbian, gay, and bisexual youth. J Health Psychol. 2019;24(7):888–897. [DOI] [PubMed] [Google Scholar]
- 61.La Roi C, Kretschmer T, Dijkstra JK, Veenstra R, Oldehinkel AJ. Disparities in depressive symptoms between heterosexual and lesbian, gay, and bisexual youth in a Dutch cohort: the TRAILS study. J Youth Adolesc. 2016;45(3):440–456. [DOI] [PMC free article] [PubMed] [Google Scholar]
- 62.Liu RT, Mustanski B. Suicidal ideation and self-harm in lesbian, gay, bisexual, and transgender youth. Am J Prev Med. 2012;42(3):221–228. [DOI] [PubMed] [Google Scholar]
- 63.Balsam KF, Lehavot K, Beadnell B, Circo E. Childhood abuse and mental health indicators among ethnically diverse lesbian, gay, and bisexual adults. J Consult Clin Psychol. 2010;78(4):459. [DOI] [PMC free article] [PubMed] [Google Scholar]
- 64.Consolacion TB, Russell ST, Sue S. Sex, race/ethnicity, and romantic attractions: multiple minority status adolescents and mental health. Cultur Divers Ethnic Minor Psychol. 2004;10(3):200. [DOI] [PMC free article] [PubMed] [Google Scholar]
- 65.Ramirez JL, Paz Galupo M. Multiple minority stress: the role of proximal and distal stress on mental health outcomes among lesbian, gay, and bisexual people of color. J Gay Lesbian Ment Health. 2019;23(2):145–167. [Google Scholar]
- 66.Pachankis JE. The psychological implications of concealing a stigma: a cognitive-affective-behavioral model. Psychol Bull. 2007;133(133):328. [DOI] [PubMed] [Google Scholar]
- 67.Diaz RM, Ayala G, Bein E, Henne J, Marin BV. The impact of homophobia, poverty, and racism on the mental health of gay and bisexual Latino men: findings from 3 US cities. Am J Public Health. 2001;6(91):927. [DOI] [PMC free article] [PubMed] [Google Scholar]
- 68.McGarrity LA. Socioeconomic status as context for minority stress and health disparities among lesbian, gay, and bisexual individuals. Psychol Sex Orientat Gend Divers. 2014;1(4):383. [Google Scholar]
- 69.Preacher KJ, Hayes AF. Asymptotic and resampling strategies for assessing and comparing indirect effects in multiple mediator models. Behav Res Methods. 2008;40(3):879–891. [DOI] [PubMed] [Google Scholar]
- 70.Lavaan RY. An R package for structural equation modeling and more. Version 0.5–12 (BETA). J Stat Softw. 2012;48(2):1–36. [Google Scholar]
- 71.R Core Team. R: A Language and Environment for Statistical Computing (Version 3.6.0). Computer Software. R Foundation for Statistical Computing; 2019. [Google Scholar]
- 72.Montoya AK, Hayes AF. Two-condition within-participant statistical mediation analysis: a path-analytic framework. Psychol Methods. 2017;22(1):6. [DOI] [PubMed] [Google Scholar]
- 73.Hu L, Bentler PM. Cutoff criteria for fit indexes in covariance structure analysis: conventional criteria versus new alternatives. Struct Equ Model Multidiscip J. 1999;6(1):1–55. [Google Scholar]
- 74.Lee MG, Quam JK. Comparing supports for LGBT aging in rural versus urban areas. J Gerontol Soc Work. 2013;56(2):112–126. [DOI] [PubMed] [Google Scholar]
- 75.Goldbach JT, Rhoades H, Mamey MR, Senese J, Karys P, Marsiglia F. Reducing behavioral health symptoms by addressing minority stressors in LGBTQ adolescents: a randomized controlled trial of Proud & Empowered. BMC Public Health. 2021;21(2311):1–10. [DOI] [PMC free article] [PubMed] [Google Scholar]
- 76.Goldbach JT, Rhoades H, Rusow J, Karys P. The development of Proud & Empowered: an intervention for promoting LGBTQ adolescent mental health. Child Psychiatry Hum Dev. 2021. 10.1007/s10578-021-01250-2.pdf [DOI] [PubMed] [Google Scholar]
- 77.Day J, Ioverno S, Russell S. Safe and supportive schools for LGBT youth: addressing educational inequities through inclusive policies and practices. J Sch Psychol. 2019;74:29–43. [DOI] [PMC free article] [PubMed] [Google Scholar]
- 78.National Academies of Sciences, Engineering, and Medicine. Understanding the Well-Being of LGBTQI+ Population. 2020.
- 79.Institute of Medicine. The Health of Lesbian, Gay, Bisexual, and Transgender People: Building a Foundation for Better Understanding. National Academies Press; 2011. [PubMed] [Google Scholar]
- 80.Whitehead J, Shaver J, Stephenson R. Outness, stigma, and primary health care utilization among rural LGBT populations. PLoS One. 2016;11(1):e0146139. [DOI] [PMC free article] [PubMed] [Google Scholar]
- 81.Patterson JG, Jabson Tree JM, Kamen C. Cultural competency and microaggressions in the provision of care to LGBT patients in rural and Appalachian Tennessee. Patient Educ Couns. 2019;102(11):2081–2090. [DOI] [PubMed] [Google Scholar]
- 82.Li MJ, Hubach RD, Dodge B. Social milieu and mediators of loneliness among gay and bisexual men in rural Indiana. J Gay Lesbian Ment Health. 2015;19(4):331–346. [Google Scholar]
- 83.Swank E, Frost DM, Fahs B. Rural location and exposure to minority stress among sexual minorities in the United States. Psychol Sex. 2012;3(3):226–243. [Google Scholar]
- 84.Drumheller K, McQuay B. Living in the buckle: promoting LGBT outreach services in conservative urban/rural centers. Commun Stud. 2010;61(1):70–86. [Google Scholar]
- 85.Mustanski B, Whitton SW, Newcomb ME, Clifford A, Ryan DT, Gibbons RD. Predicting suicidality using a computer adaptive test: two longitudinal studies of sexual and gender minority youth. J Consult Clin Psychol. 2021;89(3):166–175. [DOI] [PMC free article] [PubMed] [Google Scholar]
- 86.Drushel BE. Virtually supportive: self-disclosure of minority sexualities through online social networking sites. In: Pullen C, Cooper M, eds. LGBT Identity and Online New Media. Routledge; 2010:6272. [Google Scholar]
- 87.Gray ML. Out in the County: Youth, Media, and Queer Visibility in Rural America. 2009. [Google Scholar]
- 88.Pullen C, Cooper M. LGBT Identity and Online New Media. Routledge; 2010. [Google Scholar]