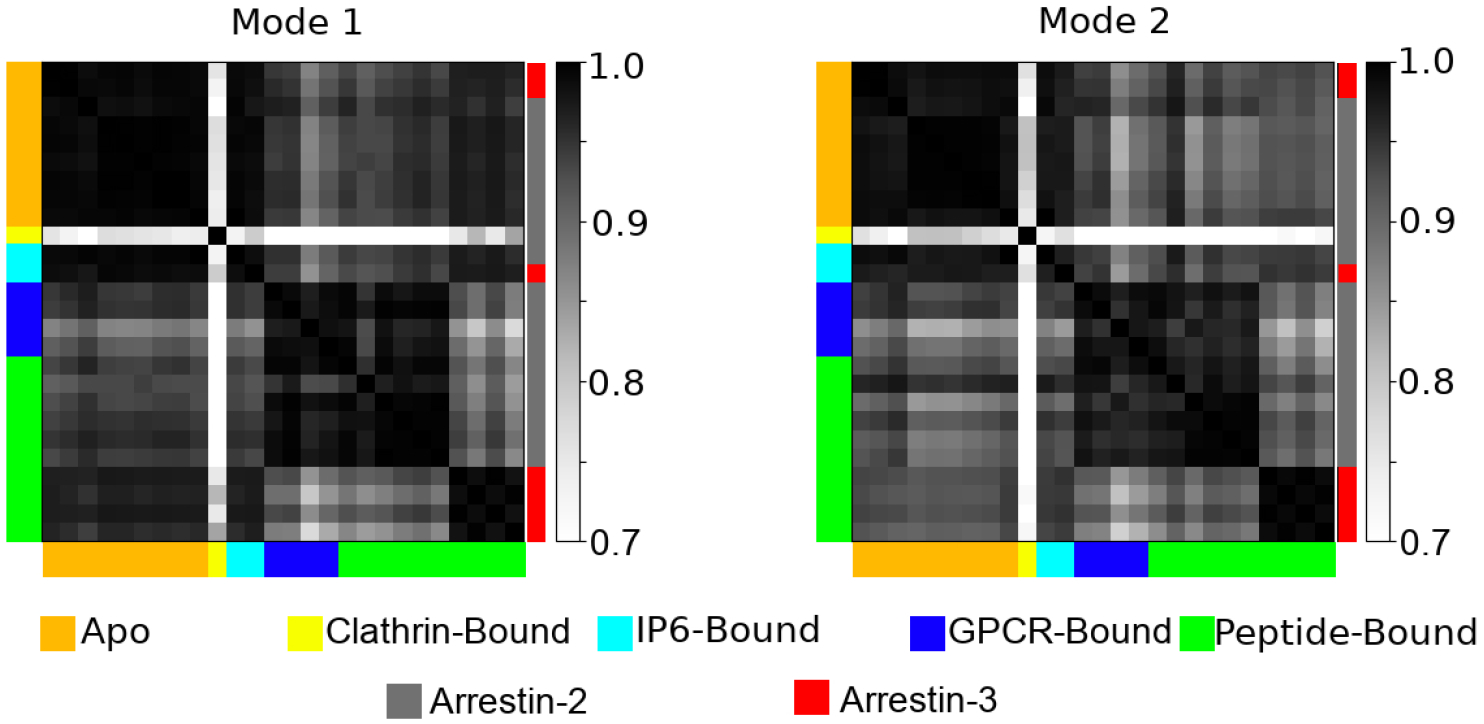
Figure 4:

A pairwise dot product of the first and second modes of motion as computed by ANM for all 26 structures analyzed. Structures are color coded both by their ligands (left and bottom of graph), or whether they are arrestin-2 (gray) or arrestin-3 (red) (right of graph).
