

Abstract
Hypoxia inducible factors (HIFs) are critical to the development and homeostasis of hypoxic tissues. While HIF-2α, one of the main HIF-α isoforms is expressed in nucleus pulposus (NP) cells, its functions remain unknown. We deleted HIF-2α in the NP tissue using a notochord specific FoxA2Cre allele to study HIF-2α function in the adult intervertebral disc. Unlike observations in HIF-1αcKO mice, fate mapping studies using Rosa26-mTmG reporter showed that HIF-2α loss in NP did not negatively impact cell survival or affect compartment development. Rather, loss of HIF-2α resulted in slightly better attributes of NP morphology in 14-month-old HIF-2αcKO mice as evident from lower scores of degeneration. These 14-month-old HIF-2αcKO mice also evidenced significant reduction in NP tissue fibrosis and lower collagen turnover in the AF compartment. Imaging-FTIR analyses showed decreased collagen and protein content in the NP and maintained chondroitin sulfate levels in 14-month-old HIF-2αcKO. Mechanistically, global transcriptomic analysis showed enrichment of differentially expressed genes with GO terms related to metabolic processes and cell development, molecular functions concerned with histone and protein binding, and associated pathways including oxidative stress. Noteworthy, these morphological differences were not apparent in 24-month-old HIF-2αcKO indicating that aging is the dominant factor in governing disc health. Together these data suggest that loss of HIF-2α in the NP compartment is not detrimental to the intervertebral disc development, but rather mitigates NP tissue fibrosis and offers mild but transient protection from age-dependent early degenerative changes.
Keywords: Chondrocyte and cartilage biology, Genetic animal models, Collagen, Aging, Transcription factors, Intervertebral disc
Introduction
Low back pain is the leading global cause of disability and a huge economic burden to society. Intervertebral disc degeneration is one of the major causes of chronic low back pain (1). The disc is avascular imposing a hypoxic character to the tissue niche (2). Cell adaptation and survival under hypoxia is primarily governed by the activity of HIFs. Expression of two prominent isoforms HIF-1α and HIF-2α is reported in the disc (3,4). Although HIF-1α and HIF-2α bind to the identical hypoxia response element motif, several studies have shown that they regulate distinct transcriptional targets and are functionally non-redundant (5–8). HIF-2α shows robust expression in nucleus pulposus (NP) and is activated in a similar fashion as HIF-1α where transactivation of HIF-2 target genes occurs when HIF-2α and HIF-1β/ARNT dimerize and bind to the hypoxia response element within the promoter and enhancer elements (2). While HIF-1α primarily controls cell metabolism, HIF-2α is known to regulate functions related to oxidative defense, cell proliferation and survival, and extracellular matrix homeostasis (9–11). In the context of intervertebral disc, HIF-1α is critical in controlling glycolysis, its interactions with TCA cycle and the overall energetics of the NP cell (12–16). Noteworthy, the conditional deletion of HIF-1α in the NP is detrimental to disc development and homeostasis (17). HIF-1αcKO mice show perinatal NP cell apoptosis driven in part by the metabolic failure and eventual replacement of the NP by cartilage-like tissue (17). HIF-2α function in the disc however has not been delineated in vivo.
NP cells show normoxic stabilization of HIF-2α levels which are insensitive to further induction under hypoxia (4). Fujita et al. reported that in NP cells HIF-2α is resilient to PHD-dependent degradation but is turned over through an autophagic pathway (18,19). While these investigations addressed HIF-2α dynamics, its function in the disc was not elucidated (4,11). In bone, HIF-2α has been implicated as a catabolic regulator of remodeling and inhibits bone mass accrual and osteoblastogenesis (20,21). Studies in cartilage however have reported conflicting roles of HIF-2α (22). In the growth plate, HIF-2α is associated with chondrocyte differentiation program and shows elevated levels in the hypertrophic zone where it is thought to control angiogenesis and the metabolic shift required for bone formation (23). Supporting these observations, conditional ablation of HIF-2α in Prx1 expressing limb bud mesenchyme showed only a transient impediment in endochondral bone development resulting from a minor delay of differentiation of hypertrophic cells into late hypertrophic chondrocytes (24). HIF-2α is similarly important in controlling human articular chondrocyte phenotype under hypoxia through Sox9-dependent and independent mechanisms; HIF-2α controls Sox9 expression through direct binding to a regulatory site (25–27). Interestingly, while HIF-2α polymorphisms (which decrease HIF-2α activity) in Tibetan population has allowed adaptation to low oxygen environment, they also have increased incidence of osteoarthritis and lower back pain (28,29). In contrast, studies of mouse models of knee joint injury showed that HIF-2α promotes articular cartilage degeneration and osteoarthritis development suggesting that HIF-2α function in cartilages is context dependent (30–32).
Since the paucity of information on HIF-2α function in the disc stems from lack of a disc specific conditional mouse model, we generated NP-specific HIF-2α conditional knockout (HIF-2αcKO) mice using a constitutively active notochord-specific FoxA2Cre. We provide the first evidence that HIF-2α loss in the NP provides mild and transient protection, and unlike HIF-1α, HIF-2α is not essential for the early development of the NP compartment. The results of this study provide understanding into the role of HIF-2α in the disc and support the idea that HIF-2α function is cell type and context specific.
Materials and Methods
Mice
All mouse experiments were performed under protocols approved by the Institutional Animal Care and Use Committee (IACUC) of Thomas Jefferson University in accordance with the IACUC’s relevant guidelines and regulations. FoxA2Cre, developed by Dr. Michael Kuehn, drives robust expression specifically in the notochord and floorplate using combination of 5’ notochord and 3’ floorplate enhancers under the control of Hspa1 promoter (33). HIF-2αf/f and FoxA2Cre on C57BL6/J background were provided Dr. Ernestina Schipani (17,30–32). HIF-2αf/f mice have loxP sites which flank exon 2 of the HIF-2α/Epas1 gene which encodes basic helix-loop-helix (bHLH) domain and following Cre expression there is a recombination between the 2-loxP sites producing the 1-loxP allele lacking exon 2. The mutant mRNA transcript contains multiple in-frame stop codons downstream of exon 1 resulting in premature termination of the protein producing a functionally null allele (30). Littermate conditional knockout (cKO: FoxA2Cre; HIF-2αf/f), heterozygous (Het: FoxA2Cre; HIF-2αf/+) and control mice (CT: HIF-2αf/f) of both sexes were generated as reported previously and used for the studies at 1-, 6-, 14- and 24-months (34). Except for grading analyses, other phenotypic studies were performed using 6- and 14-month old mice. It has been shown that FoxA2Cre is expressed in the robustly expressed in the notochord as early as E8.5 (35). To perform fate-mapping, mTmG (Gt(ROSA)26Sortm4(ACTB-tdTomato,-EGFP) Luo/J, strain 007576, Jackson Laboratories) reporter mice were crossed with mice with (FoxA2Cre; HIF-2αfl/fl), and EGFP+ cells were followed over time. Based on a previous fate-mapping study showing similar cell viability between FoxA2Cre; HIF-1α+/+ and FoxA2Cre; HIF-1α+/f mice (17), we used FoxA2Cre; HIF-2α+/f animals as fate mapping controls.
Tissue RNA isolation and RT-PCR analysis
NP tissue was micro-dissected from 6M and 14M HIF-2αCT and HIF-2αcKO mice. Tissues from L1/2-L6/S1 and Ca1/2-Ca12/13 of same mouse were pooled and served as a single sample stored into RNAlater® Reagent (Invitrogen, Carlsbad, CA) for minimum 2 days at −80°C (n = 7–8 mice/genotype). Samples were homogenized with a Pellet Pestle Motor (Sigma Aldrich, Z359971), and RNA was extracted using RNeasy® Mini kit (Qiagen). RNA was quantified on a Nanodrop ND-100 spectrophotometer (Thermo Fisher Scientific). Purified RNA was then converted to cDNA using EcoDry™ Premix (Clonetech). Gene specific primers (IDT, IN) and the template cDNA were added to Power SYBR Green master mix (Applied Biosystems). Primer sets were designed and synthesized for HIF-2α to detect the presence of exon 2 (Fwd: 5’ GGGGTTAAGGAACCCAGGTG 3’; Rev: 5’ GGCATCACGGGATTTCTCCT 3’) (IDT, Inc.). Quantification of HIF-2α expression was done by the StepOnePlus Realtime PCR system (Applied Biosystem) using ΔΔCT method and HPRT to normalize gene expression.
Western blot analysis
NP tissue was isolated from HIF-2αf/f (CT) and FoxA2Cre; HIF-2αf/f (cKO) mice. RCC4 cells which have inactivating mutation in Vhl were used as HIF-2α positive control. Following extraction, mouse NP or RCC4 cells were washed in ice-cold 1× PBS with protease inhibitor cocktail (Thermo Scientific). Cell were then lysed with lysis buffer containing 1× protease inhibitor cocktail (Thermo Scientific), NaF (4 mM), Na3VO4 (20 mM), NaCl (150 mM), β-glycerophosphate (50 mM), and DTT (0.2 mM). Total protein was resolved on 10% SDS-polyacrylamide gels and transferred to PVDF membranes (Fisher Scientific). Membranes were then stained with Ponceau Red (Sigma), imaged, and then washed 4× 5 minutes in 1x TBS before blocking. Membranes were blocked with 5% nonfat dry milk in TBST (50 mM Tris pH 7.6, 150 mM NaCl, 0.1% Tween 20) and incubated overnight at 4 °C in 5% nonfat dry milk in TBST with anti-HIF-2α (1:500, Novus Biologicals, NB100–122), anti-HIF-1β (1:500, Novus Biologicals, NB100–124), anti-β-tubulin (1:2000; DSHB; E7-C), or anti-GAPDH (1:3000; Cell Signaling Technologies, 14C10) antibodies. Membranes were stripped using Restore Western Blot Stripping Buffer (Fisher Scientific) and re-probed where required. Specificity of all antibodies has been validated by the manufacturer using siRNA or negative control IgG. Immunolabeling was detected using ECL reagent and imaged on LAS4000 imager (GE Life Sciences).
Histological analysis
Spines for paraffin embedding were fixed in 4% PFA for 48 hours at 4°C while spines for frozen sectioning were fixed in 4% PFA for 4 hours at 4°C. Spines were decalcified in 20% EDTA at 4°C for 21 days, washed with 1x PBS and then placed in 70% EtOH before paraffin embedding. Spine used for fate-mapping studies were placed into 30% sucrose solution before OCT embedding and were sectioned at 7 μm thickness. Imaging of EGFP labelled cells was performed on a Zeiss LSM 800 Confocal microscope, with 20x/0.8 Plan-Apochromat objective. Paraffin embedded lumbar discs were sectioned in coronal plane at 7 μm and then stained with 1% Safranin O, 0.05% Fast Green, and 1% Hematoxylin. The sections were visualized with Axio Imager 2 microscope (Carl Zeiss) using a 5x/0.15 N-Achroplan or 20 × /0.5 EC Plan-Neofluar (Carl Zeiss) objectives. Images were captured with Axiocam 105 color camera (Carl Zeiss) using Zen2™ software (Carl Zeiss). Disc grading of CT and cKO mice at 1-month (n = 5 CT, 5 cKO mice, 6 discs/mouse, 30 discs/genotype), 6-month (n = 11 CT, 5 Het, 9 cKO mice, 6 discs/mouse, 29–66 discs/genotype),14-month (n =8 CT, 7 Het, 7 cKO mice, 6 discs/mouse, 42–48 discs/genotype) and 24-month (n =9 CT, 10 cKO mice, 4–5 discs/mouse, 45–47 discs/genotype) was performed by 4 ≥ blinded graders using modified Thompson grading scale (36–40). Since the unique interactions between genetic, biological, and biomechanical factors at individual spinal levels have been shown to produce different phenotypic outcomes, each disc was considered as an independent sample (40–43).
Micro-computed tomography (μCT) analysis
μCT imaging was performed on lumbar spines of 6 and 14-month-old (n = 6M: 11 CT, 10 cKO mice; 14M: 8 CT, 10 cKO mice; 6 lumbar discs and 7 vertebrae/mouse were analyzed) using the high-resolution μCT scanner (Skyscan 1272, Bruker, Belgium). Samples were placed in 1x PBS and scanned with an energy of 50 kV and current of 200 μA resulting in 15 μm3 voxel size resolution. Intervertebral disc height and the length of the vertebral bones were measured and averaged along the dorsal, midline, and ventral regions in the sagittal plane. Disc height index (DHI) was calculated as previously described (44).
TUNEL assay
TUNEL assay was performed on 14-month-old (n = 7–8 mice/genotype, 2–3 discs/mouse, 21–22 total discs/genotype) disc tissue sections using an “in situ cell death detection” kit (Roche Diagnostic) per the manufacturer’s protocol. Briefly, sections were deparaffinized and permeabilized with Proteinase K (20 μg/mL) for 15 min at room temperature. The sections were washed and mounted with ProLong® Gold Antifade Mountant with DAPI (Thermo Fisher Scientific, P36934). The mounted slides were imaged with an Axio Imager 2 microscope using 5 × /0.15 N- Achroplan or 10 × /0.3 EC Plan-Neofluar objectives (Carl Zeiss), X-Cite® 120Q Excitation Light Source (Excelitas), AxioCam MRm camera (Carl Zeiss), and Zen2™ software (Carl Zeiss).
Picrosirius red staining and polarized imaging
Picrosirius Red staining and analysis were performed on 7 μm mid-coronal disc sections from 6-, 14- and 24-month-old animals as described before (45). The stained sections were imaged using Eclipse LV100 POL (Nikon, Tokyo, Japan) with a 10x/0.25 Pol/WD 7.0 objective Nikon’s Digital Sight DS-Fi2 camera. Images were analyzed in the NIS Elements Viewer software (Nikon, Tokyo, Japan). Under polarized light, stained collagen bundles appear as either green, yellow, or red pixels that correlate to fiber thickness indicating thin, intermediate, or thick fiber thickness respectively which can be quantified (46). In NIS Elements Viewer software fibers were quantified by thresholding for green, yellow, and red pixels over the selected region of interest (ROI). The ROIs were determined by selecting for NP or AF area using the ROI selection tool. ROIs were then thresholded for green, yellow, and red separately and the percentage area of staining was used to quantify the results for each compartment.
Immunohistochemistry and digital image analysis
7 μm mid-coronal disc sections were deparaffinized in histoclear and rehydrated in ethanol solutions (100–95%), water, and 1xPBS. Antigen retrieval was done using either citrate-buffer, proteinase-K, or MOM kit (Vector laboratories, BMK-2202) depending on the antibody. Sections were blocked 1 hour in 5–10% normal goat or donkey serum as appropriate in PBS-T (0.4% Triton X-100 in PBS) or using the reagent from the MOM kit. They were then incubated at 4 °C overnight in primary antibodies against COMP (1:200; Abcam, ab231977), collagen 1 (1:100; Abcam, ab34710), collagen II (1:400; Fitzgerald, 70R-CR008), collagen X (1:500; Abcam, ab58632), ARGxx (1:200; Abcam, ab3773), CA3 (1:150; Santa Cruz Biotechnology Inc., sc-50715), ACAN (1:50; Millipore, ab1031), CS (1:300; Abcam, ab11570), MMP13 (1:200; Abcam, ab39012), MCP1 (1:150; Abcam, ab25124), IL-1β (1:100; Novus, NB600–633), IL-6 (1:50; Novus, NB600–1131), TGF-β1 (1:100; Abcam, ab92486), SOD2 (1:600; Abcam, ab13533), and catalase (1:200; Abcam, ab16731). After incubation with primary antibody, tissues were washed and reacted with Alexa Fluro-594 (Ex: 591 nm, Em: 614 nm) conjugated secondary antibody (Jackson ImmunoResearch Laboratories, Inc.) at a 1:700 dilution in blocking buffer for 1 hour at room temperature. The sections were then washed and mounted with ProLong Gold Antifade Mountant with DAPI (Thermo Fisher Scientific, P36934). Slides were visualized with the Axio Imager 2 (Carl Zeiss Microscopy) using 5×/0.15 N-Achroplan (Carl Zeiss Microscopy) or 10×/0.3 EC Plan-Neofluar (Carl Zeiss Microscopy) or 20 ×/0.5 EC Plan-Neofluar objectives, X-Cite® 120Q Excitation Light Source (Excelitas Technologies), AxioCam MRm camera (Carl Zeiss Microscopy), and Zen2TM software (Carl Zeiss Microscopy). DAPI-positive cells were analyzed to assess cell number in disc compartments, while CA3 staining was used to assess cell band size. All quantifications were conducted in 8-bit greyscale using the Fiji package of ImageJ (47). Images were thresholded to create binary images, and NP and AF compartments were manually segmented using the Freehand Tool. These defined regions of interest were analyzed either using the Analyze Particles (cell number quantification) function or the Area Fraction measurement.
FTIR Imaging Spectroscopy and spectral clustering analysis
FTIR and analysis was done as described previously (48,49). 7 μm deparaffinized sections of decalcified mouse lumbar disc tissues were collected from control and mutant animals at the 6-month (n = 6 mice/genotype, 1 disc/mouse, 6 total discs/genotype) and 14-month (n = 6 mice/genotype, 2 disc/mouse, 12 total discs/genotype) time points and used to acquire FTIR spectral imaging data using methods previously described. Spatial resolution images were acquired on the Spectrum Spotlight 400 FT-IR Imaging system in the mid-IR region from 4000–800 cm−1 (Perkin Elmer, CT). Briefly, spectra were collected across the mid-IR region of three consecutive sections/disc to minimize section-based variation. Using the ISys Chemical Imaging Analysis software (v. 5.0.0.14) mean second-derivative absorbances were quantified and compared in control and mutant NP and AF disc compartments at both time points. Additional absorbance included: chondroitin sulfate at 1064 cm−1 (50). Significant differences in parameters were assessed by t-test or Mann-Whitney test, where relevant; p < 0.05 was considered significant.
Collected spectra were analyzed using K-means clustering analysis in the Eigenvector Solo+MIA software (v. 8.8) to agnostically delineate anatomical regions within the disc. Briefly, regions of IR images are separated into two or more classes, or “clusters,” according to spectral similarity. The K-means in our analyses was K = 7. During each iteration, the remaining objects (pixels of the spectral image) are assigned to one of these clusters based on the distance from each of the K targets. New cluster targets are then calculated as the means of the objects in each cluster, and the procedure is repeated until no objects are reassigned after the updated mean calculations.
Microarray Analysis
Purified RNA was quantified and quality was assessed using a Nanodrop ND‐100 spectrophotometer (Thermo Fisher Scientific) and Agilent 2200 TapeStation (Agilent Technologies, Palo Alto, CA, USA) respectively. Using GeneChip WT Plus kit, the fragmented biotin-labeled cDNA was synthesized from the extracted RNA according to ABI protocol (Thermo Fisher). The biotin-labeled cDNA was hybridized to Gene chips (Mouse Clariom S). After washing and staining with GeneChip hybridization wash & stain kit, the chips were scanned on the Affymetrix Gene Chip Scanner 3000 7G using Command Console Software. Expression Console Software v 1.4.1 was used to preform quality control and to generate CHP files by sst-rma normalization from Affymetrix CEL file. For the analysis, only protein coding genes were included that had a p-value ≤ 0.05 and Fold Change of ≥ ±2. PANTHER was used to perform biological process enrichment analysis using the Overrepresentation Test, GO Ontology database annotations, and Fisher’s exact statistical test with FDR ≤ 0.05. Affymetrix Transcriptome array console 4.0 software was used for data analysis. The array data is deposited in publicly accessible GEO database (GSE184424).
Statistical Analysis
Statistical analysis was performed using Prism 9 (GraphPad, La Jolla, CA, USA) with data presented as whisker box plots showing all data points with median and interquartile range and maximum and minimum values.. Differences between distributions were checked for normality using Shapiro-Wilk tests and further analyzed using an unpaired t-test for normally distributed data and the Mann-Whitney U test for non-normally distributed data. Comparison of multiple groups of normally distributed data used one-way ANOVA whereas non-normally distributed data was analyzed using Kruskal-Wallis and Dunn’s or Welch’s multiple comparison tests. Analyses of Modified Thompson Grading data distributions and fiber thickness distributions were performed using a χ2 test at a 0.05 level of significance.
Results
HIF-2α expression is prominent in the NP and conditional deletion does not compromise NP cell survival with aging
We first assessed whether the expression and localization of HIF-2α in disc changes with age. Immunohistological staining of control C57BL6/J mice showed a robust expression of HIF-2α in the NP but not in AF cells (Fig. 1A), as expected a positive staining in the hypertrophic zone of the growth plate was noted. Additionally, Western blot (Fig. 1B, Suppl. Fig. 1A–A”) was performed from NP and AF tissues at different stages of skeletal maturity. Noteworthy, HIF-2α levels in NP were appreciably higher than AF and showed comparable levels across ages (Fig. 1B, Suppl. Fig. 1B–B”). To conditionally delete HIF-2α, HIF-2αf/f mice were crossed with FoxA2Cre driver which is robustly active in the notochord starting at E8.5 (17,33,35,51). The resultant FoxA2Cre; HIF2αf/f (HIF-2αcKO) mice harboring deletion of exon 2 in the basic-Helix-Loop-Helix domain of HIF-2α/Epas1 gene (Fig. 1C) and littermate HIF-2αf/f (HIF-2αCT) were aged up to 24-months (24M). The mRNA (Fig. 1D) and protein (Fig. 1E, Suppl. Fig. 2A–B”) assessment of HIF-2α in NP tissue from 1M mice confirmed a significant decrease in the levels in HIF-2αcKO. Some increase in HIF-1β/ARNT in NP of HIF-2αcKO was also observed. We delineated the presence of HIF-2α null NP cells in 6M and 14M mice using Rosa26mTmG (mTmG) reporter line that marked Cre-recombinase activity in FoxA2-expressing cells (FoxA2Cre; HIF-2αf/f; R26mTmG/+). Confocal imaging showed that FoxA2Cre targets cells in the NP compartment as evident from EGFP labeling and that NP cells with homozygous embryonic loss of HIF-2α were healthy and exhibited similar morphology to controls (Fig. 1F). These results suggested that the NP cells with homozygous HIF-2α deletion persisted through adulthood. To further investigate changes in cell survival, TUNEL assay was performed at 14M and showed no evidence of elevated cell death in NP and AF (Fig. 1G). There were also no differences in the NP cell number and cell band area between the genotypes (Fig. 1H). Together, these findings indicate that HIF-2α loss does not adversely affect the development of the NP compartment.
Fig. 1. HIF-2α expression is prominent in the NP compartment and conditional deletion does not compromise NP cell survival with aging.
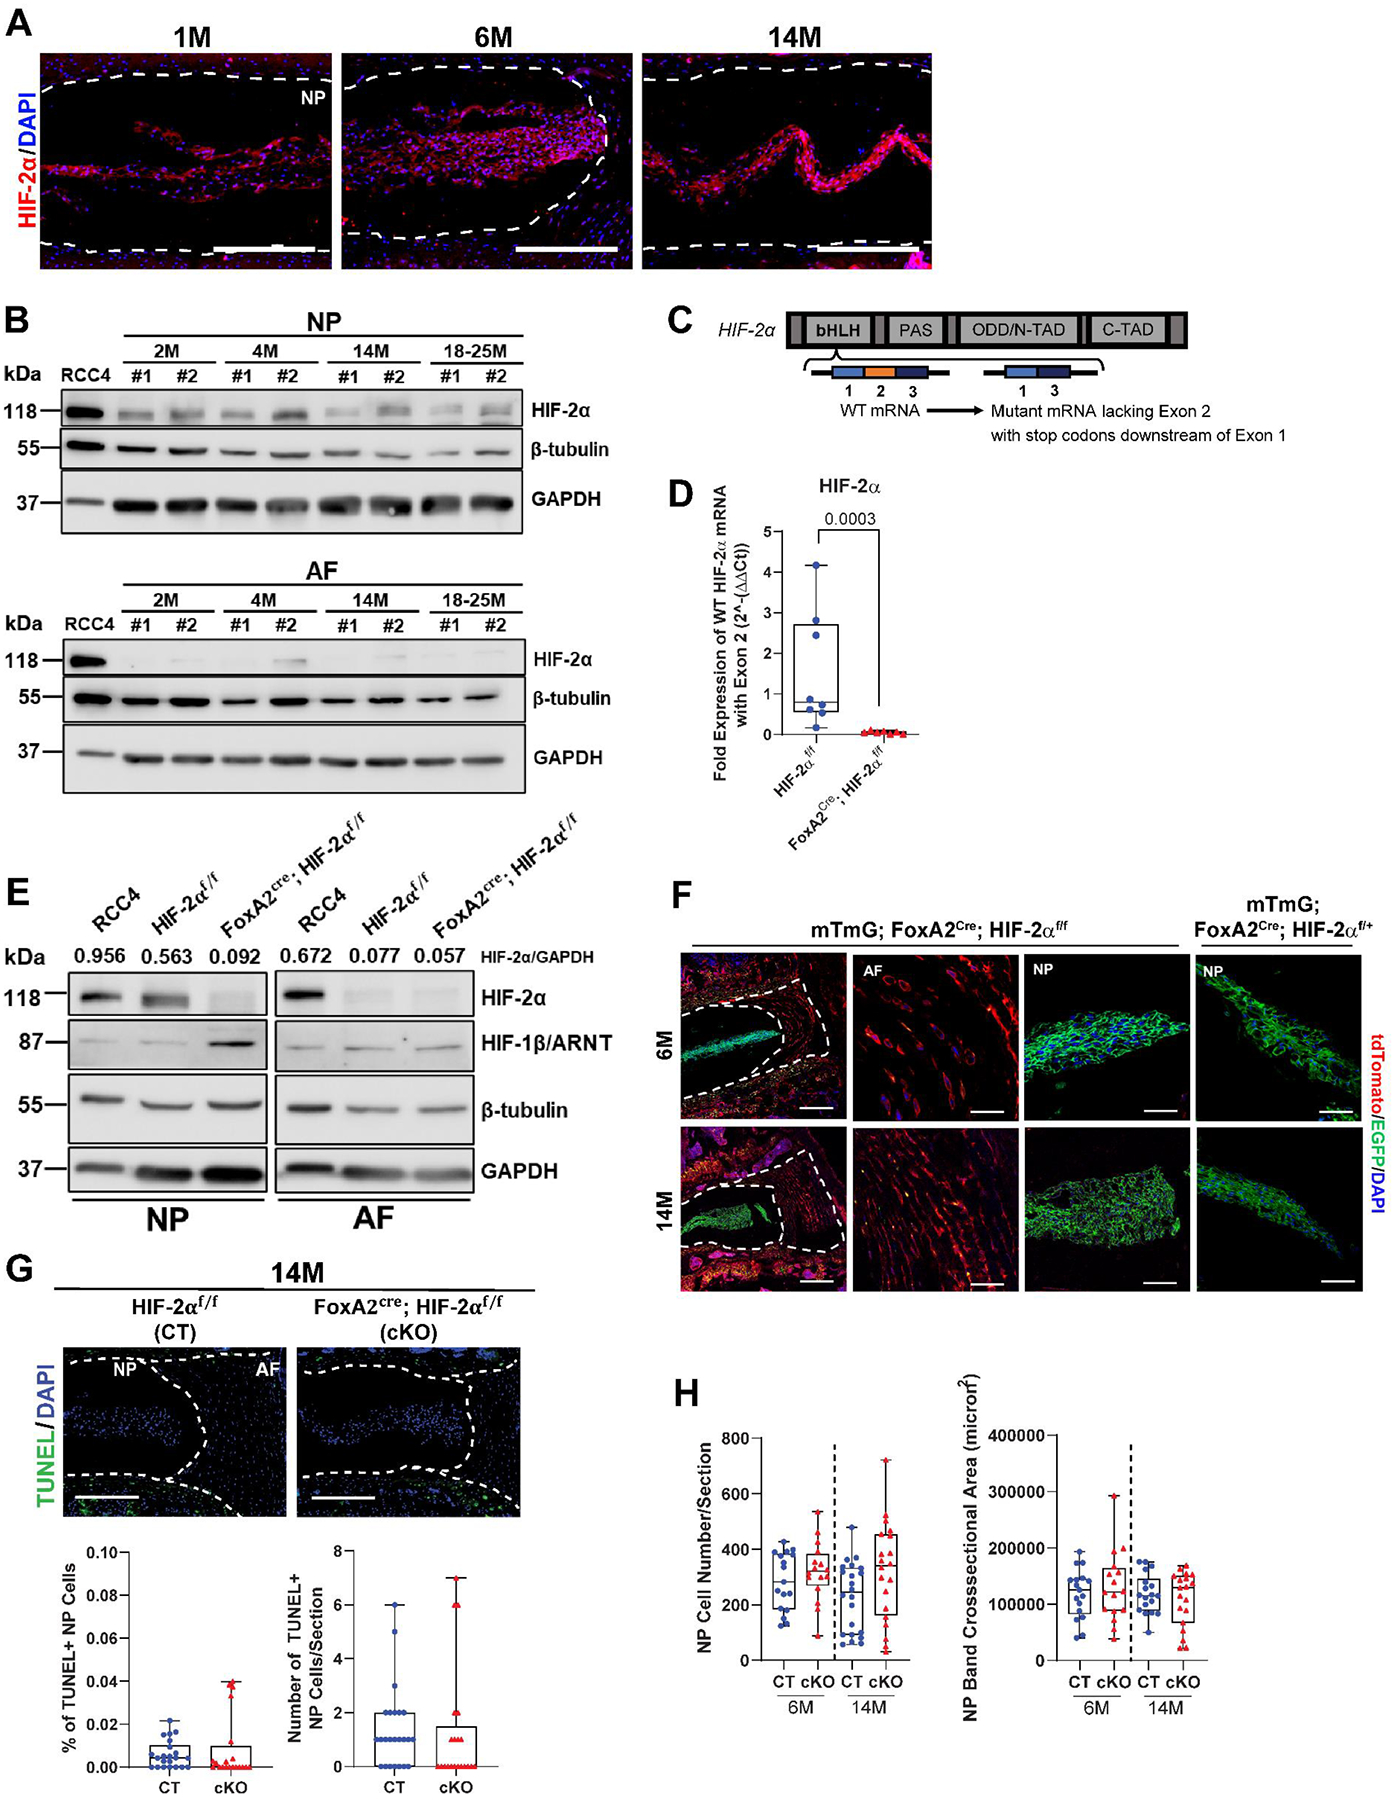
(A) Representative images of immunohistological staining of HIF-2α in intervertebral disc from 1M, 6M, and 14M old mice (scale bar = 200 μm). (B) Western blot detection of HIF-2α in NP and AF tissues of 2M, 4M, 14M and 18–25M old mice (n = 2 mice/age group, 20 discs/mouse were pooled). RCC4 cells were used as positive control for HIF-2α expression (C) Schematic of exon 2 targeting in the HIF-2α gene and the resultant mutant mRNA product. (D) RT-PCR analysis to detect exon2 deletion in HIF-2α mRNA in the NP of HIF-2αCT and HIF-2αcKO mice at 6M (n = 8 CT and 7 cKO mice, 6 discs/animal). (E) Western Blot assay to measure HIF-2α and HIF-1β levels in NP and AF tissues from HIF-2αCT and HIF-2αcKO mice. (F) Fate mapping of HIF-2α null cells in 6- and 14-month FoxA2cre; HIF-2αf/f; mTmG mice (scale bar = 200 μm, NP/AF scale bar = 50 μm). (G) TUNEL staining shows apoptotic cells in the NP and AF regions of disc sections from 14M mice (scale bar = 200 μm), percentage of TUNEL+ NP cells in 14M discs, and number of TUNEL+ NP cells per section (n = 8 CT, 7 cKO mice, 2–3 discs/animal, 21–22 discs/genotype). (H) Number of DAPI-stained nuclei/section and NP cell band cross sectional area (n = 8 CT, 7 cKO mice, 1–3 discs/animal, 16–19 discs/genotype). Significance for quantitative measures was determined by using an unpaired t-test or Mann-Whitney test, or Kruskal Wallis with Dunn’s post hoc test, as appropriate. Quantitative measurements represent whisker box plots showing all data points with median and interquartile range and maximum and minimum values.
HIF-2αcKO mice show healthier disc morphology at 14-months
The histological assessment up to 6M showed that HIF-2αcKO mice had no notable changes in NP and AF cell morphology and maintained overall disc integrity (Suppl. Fig 3A, Fig. 2A–F). In both the genotypes, NP cell band surrounded by proteoglycan rich matrix contained cells with cytoplasmic vacuoles. Similarly, HIF-2αcKO mice showed fibroblastic AF cells present in concentric lamellae and endplates with a normal appearance. Interestingly, compared to HIF-2αcKO, HIF-2αCT mice evidenced a mild loss of demarcation between NP and AF compartments at 14M (Fig. 2B). At 24M, regardless of the genotype mice showed signs of enhanced disc degeneration with few discs evidencing herniation (Suppl. Fig 3D). Histological changes in disc morphology of HIF-2αcKO (cKO) mice were scored at 1M (Suppl. Fig. 3A–C), 6M (Fig. 2A, C, D), 14M (Fig. 2B, E, F) and 24M (Suppl. Fig 3D–F); littermate HIF-2αf/f (HIF-2αCT, CT), and FoxA2cre; HIF-2αf/+ (HIF-2αHet, Het) mice were used for comparisons. At 1M distribution of grades and average grades of degeneration of NP and AF between HIF-2αCT and HIF-2αcKO were comparable (Suppl. Fig. 3B, C), whereas at 6M a small difference in distribution of NP grades was noted without any changes in average NP and AF grades (Fig. 2C, D). At 14M however, there was a small but significant improvement in grading distribution with HIF-2αcKO exhibiting overall lower grades of degeneration (Fig. 2E). Likewise, average grading scores in HIF-2αcKO were lower in the NP compartment compared to HIF-2αCT mice (Fig. 2F). Interestingly, unlike the mild protective effect seen at 14M, when mice were aged to 24M, grade distribution and average grades of NP and AF were comparable between the genotypes suggesting that aging was a dominant factor governing disc health (Suppl. Fig 3E, F). We compared grading data at 1, 6, 14 and 24M to take into account how age affects the progression of degeneration within each genotype. As expected, grading scores increased with age in both genotypes. Independent of genotype, NP compartment showed significant increase in grades from 1M to 14M with no further increase in scores to 24M (Suppl. Fig. 3G). However, in AF, while HIF-2αCT mice showed a progressive increase in grades from 1M to 24M, HIF-2αcKO evidenced comparable scores between 6M to 14M (Suppl. Fig. 3H). We also measured disc height and disc height index (DHI) using μCT (Fig. 2G). The 6M and 14M HIF-2αcKO mice showed no differences in DHI, disc height, and vertebral length compared to HIF-2αCT (Fig. 2H). Notably, vertebral length showed significant increase from 6M to 14M in both genotypes, whereas disc height showed an age-dependent increase only in HIF-2αCT (Fig. 2H). These analyses show HIF-2αcKO has moderately healthier NP tissue morphology at 14M but this effect is transient.
Fig. 2. Loss of HIF-2α improves attributes of disc morphology in 14-month-old mice.
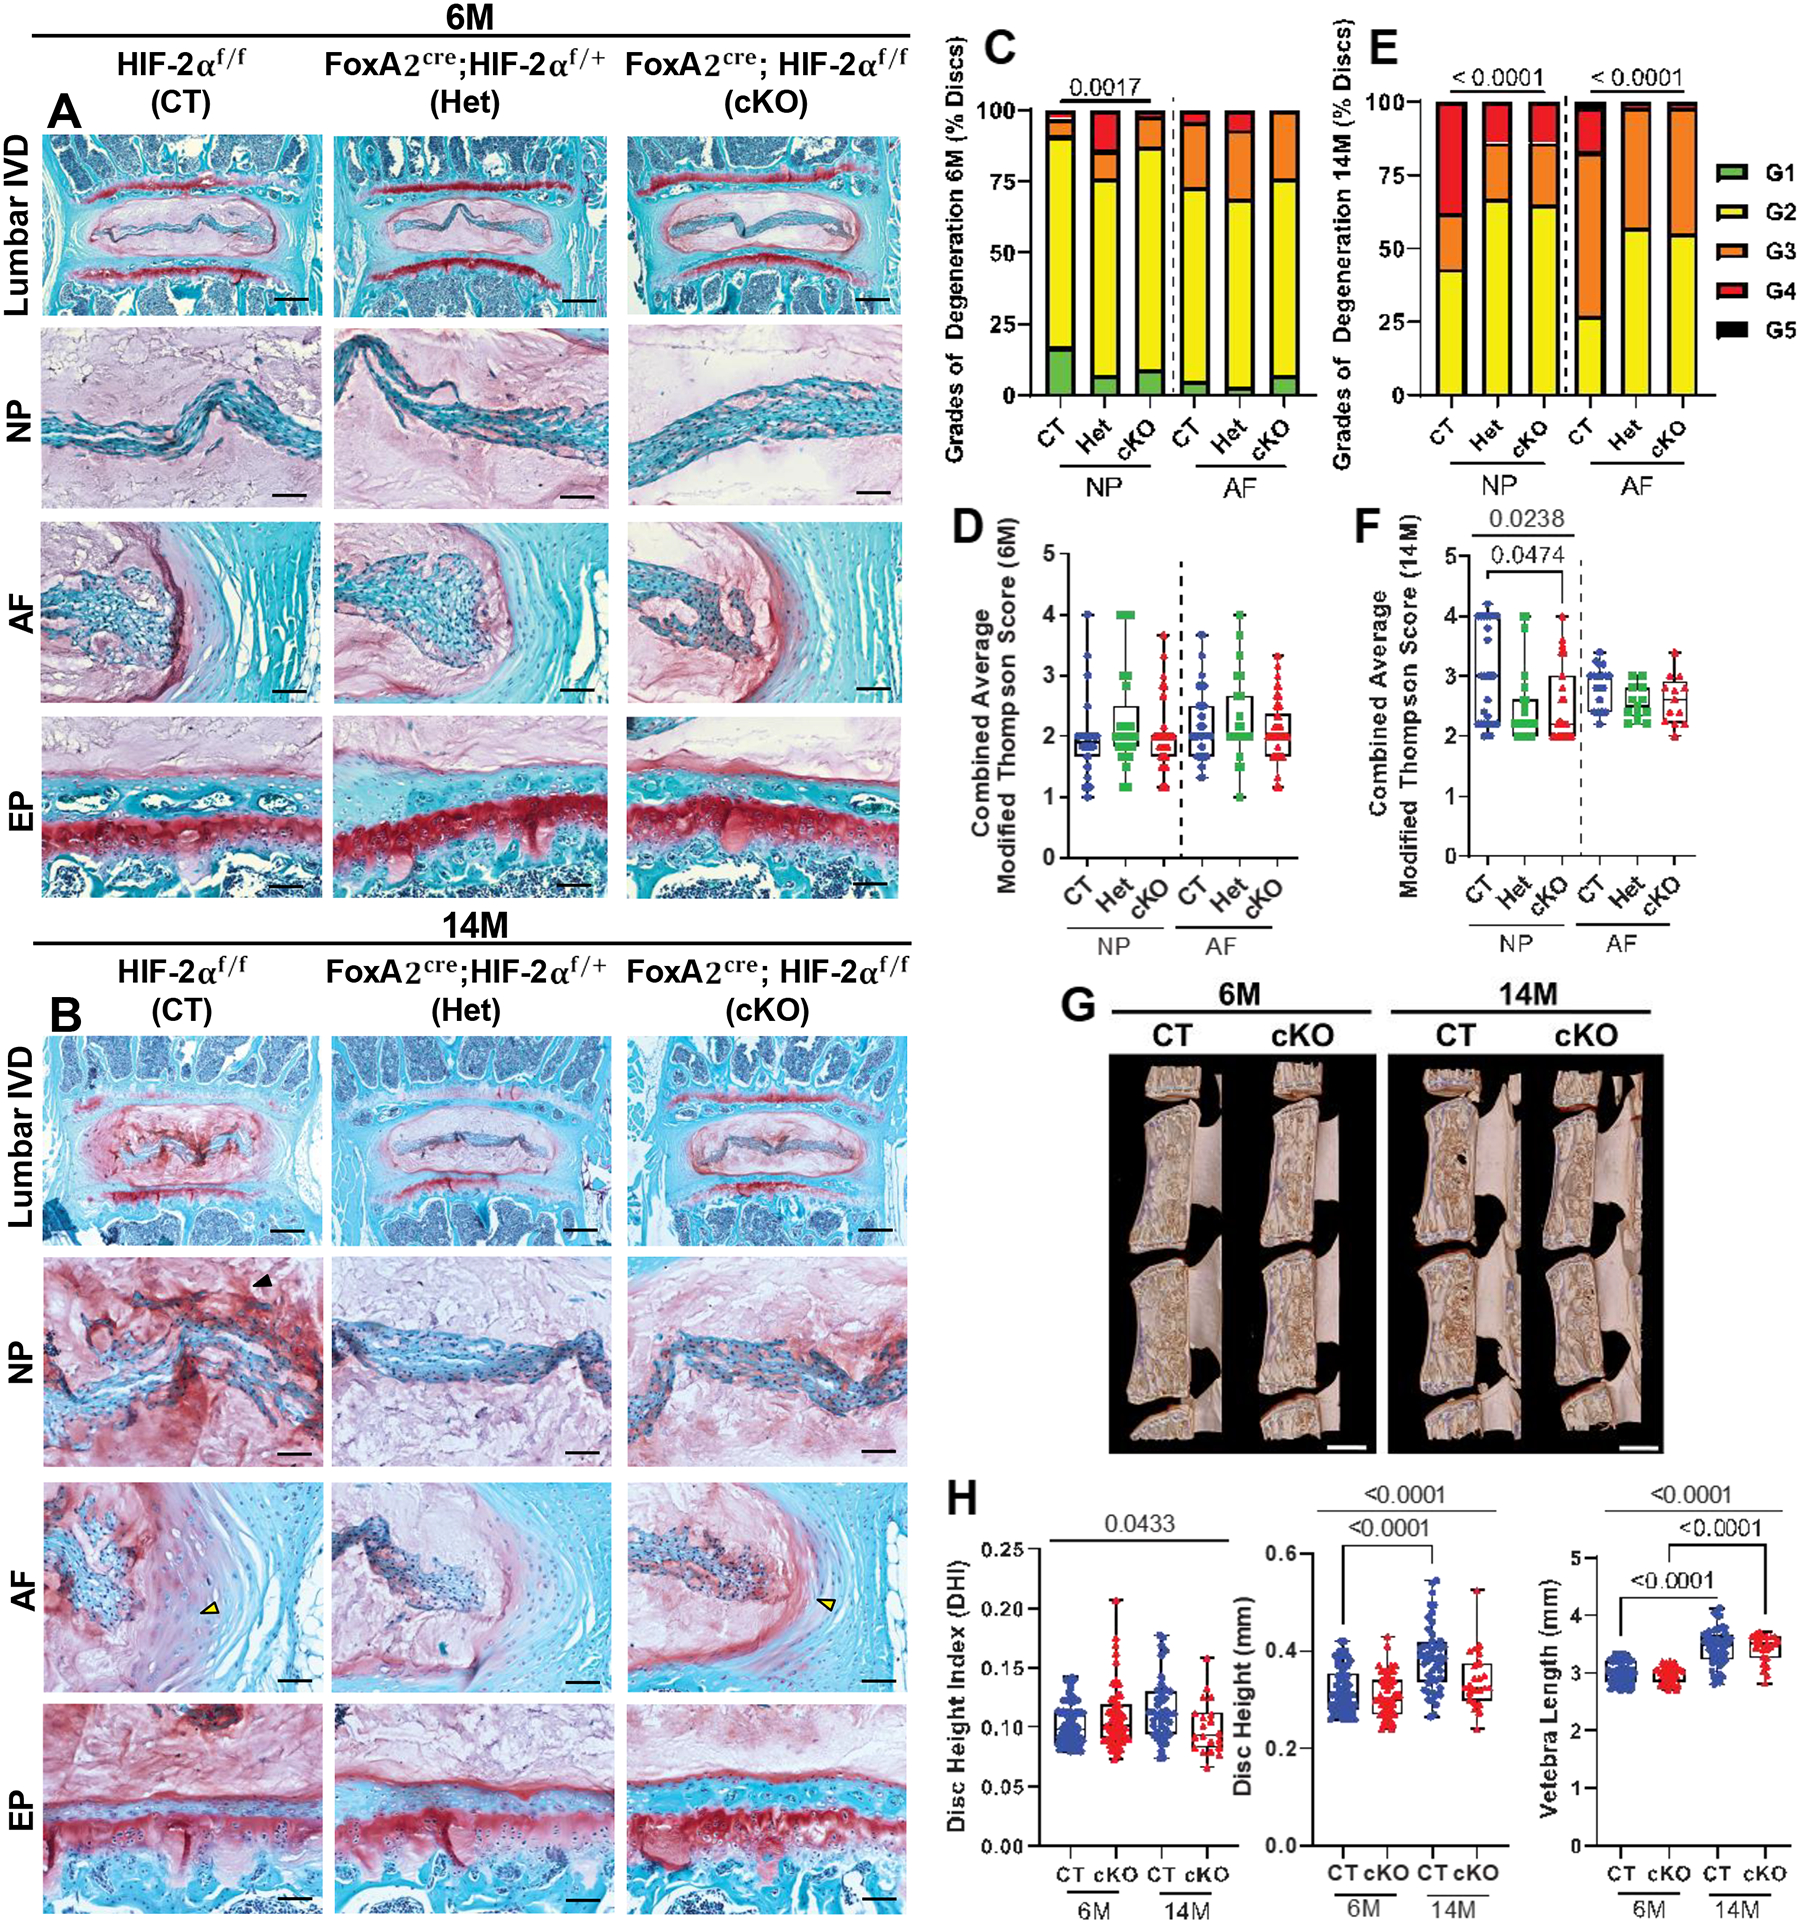
(A-B) Safranin O/Fast Green staining of lumbar discs showing disc morphology and overall proteoglycan content in the intervertebral disc in 6-month (6M) and 14-month (14M) control: CT (HIF-2αf/f), heterozygous: Het (FoxA2Cre, HIF-2αf/+), and conditional knockout: cKO (FoxA2Cre, HIF-2αf/f) animals (scale bar = 200 μm), fibrous tissue (black arrowhead), and reduced demarcation (yellow arrowhead) between NP and AF compartments is shown. (C-F) Histological grading assessment of 6M and 14M lumbar discs using the modified Thompson scale (n = 6M: 11 CT, 5 Het, 9 cKO mice; 14M: 8 CT, 7 Het, 7 cKO mice; 6 discs/mouse, 29–66 discs/genotype). (G) Representative μCT reconstructions of the hemi-section of a lumbar motion segment in 6M and 14M mice (scale bar = 1mm). (H) Disc height index (DHI), disc height (DH), and vertebral length are shown for lumbar vertebrae (n = 6M: 11 CT and 10 cKO mice; 14M: 8 CT and 4 cKO mice; 6 lumbar discs and 7 vertebrae/mouse were analyzed). Significance for grading distribution was determined using a χ2 test. Significance of differences between 3 or more groups was determined using one way ANOVA or Kruskal Wallis with Dunn’s test. Quantitative measurements represent median with interquartile range.
HIF-2α deletion prevents NP fibrosis and lowers AF collagen turnover at 14-months
Picrosirius Red staining in conjunction with polarized light imaging was used to assess disc collagen matrix organization. At 14M, HIF-2αCT mice showed a higher incidence of collagen fibers indicative of tissue fibrosis in the NP of lumbar discs compared to HIF-2αcKO (Fig. 3A–B). However, at 24M, HIF-2αcKO mice showed comparable NP fibrosis to HIF-2αCT (Suppl. Fig 4A, B). Quantification of polarized images (Fig. 3C–D) showed that there was a gradual decrease in thin collagen fibers from HIF-2αCT, HIF-2αHet, to HIF-2αcKO and a concordant increase in thick fibers in the AF at 6M (Fig. 3E), implying diminished collagen turnover in adult HIF-2αcKO mice. At 14M and 24M, the HIF-2αcKO AF showed similar trends to 6M with a statistically significant decrease in thin collagen fibers without alterations in thick collagen fibers (Fig. 3F, Suppl. Fig 4C–D). These analyses showed that HIF-2α loss mitigates NP tissue fibrosis in middle-aged mice and alters collagen fiber thickness.
Fig. 3. Conditional deletion of HIF-2α ameliorates NP tissue fibrosis and reduces collagen turnover in the AF.
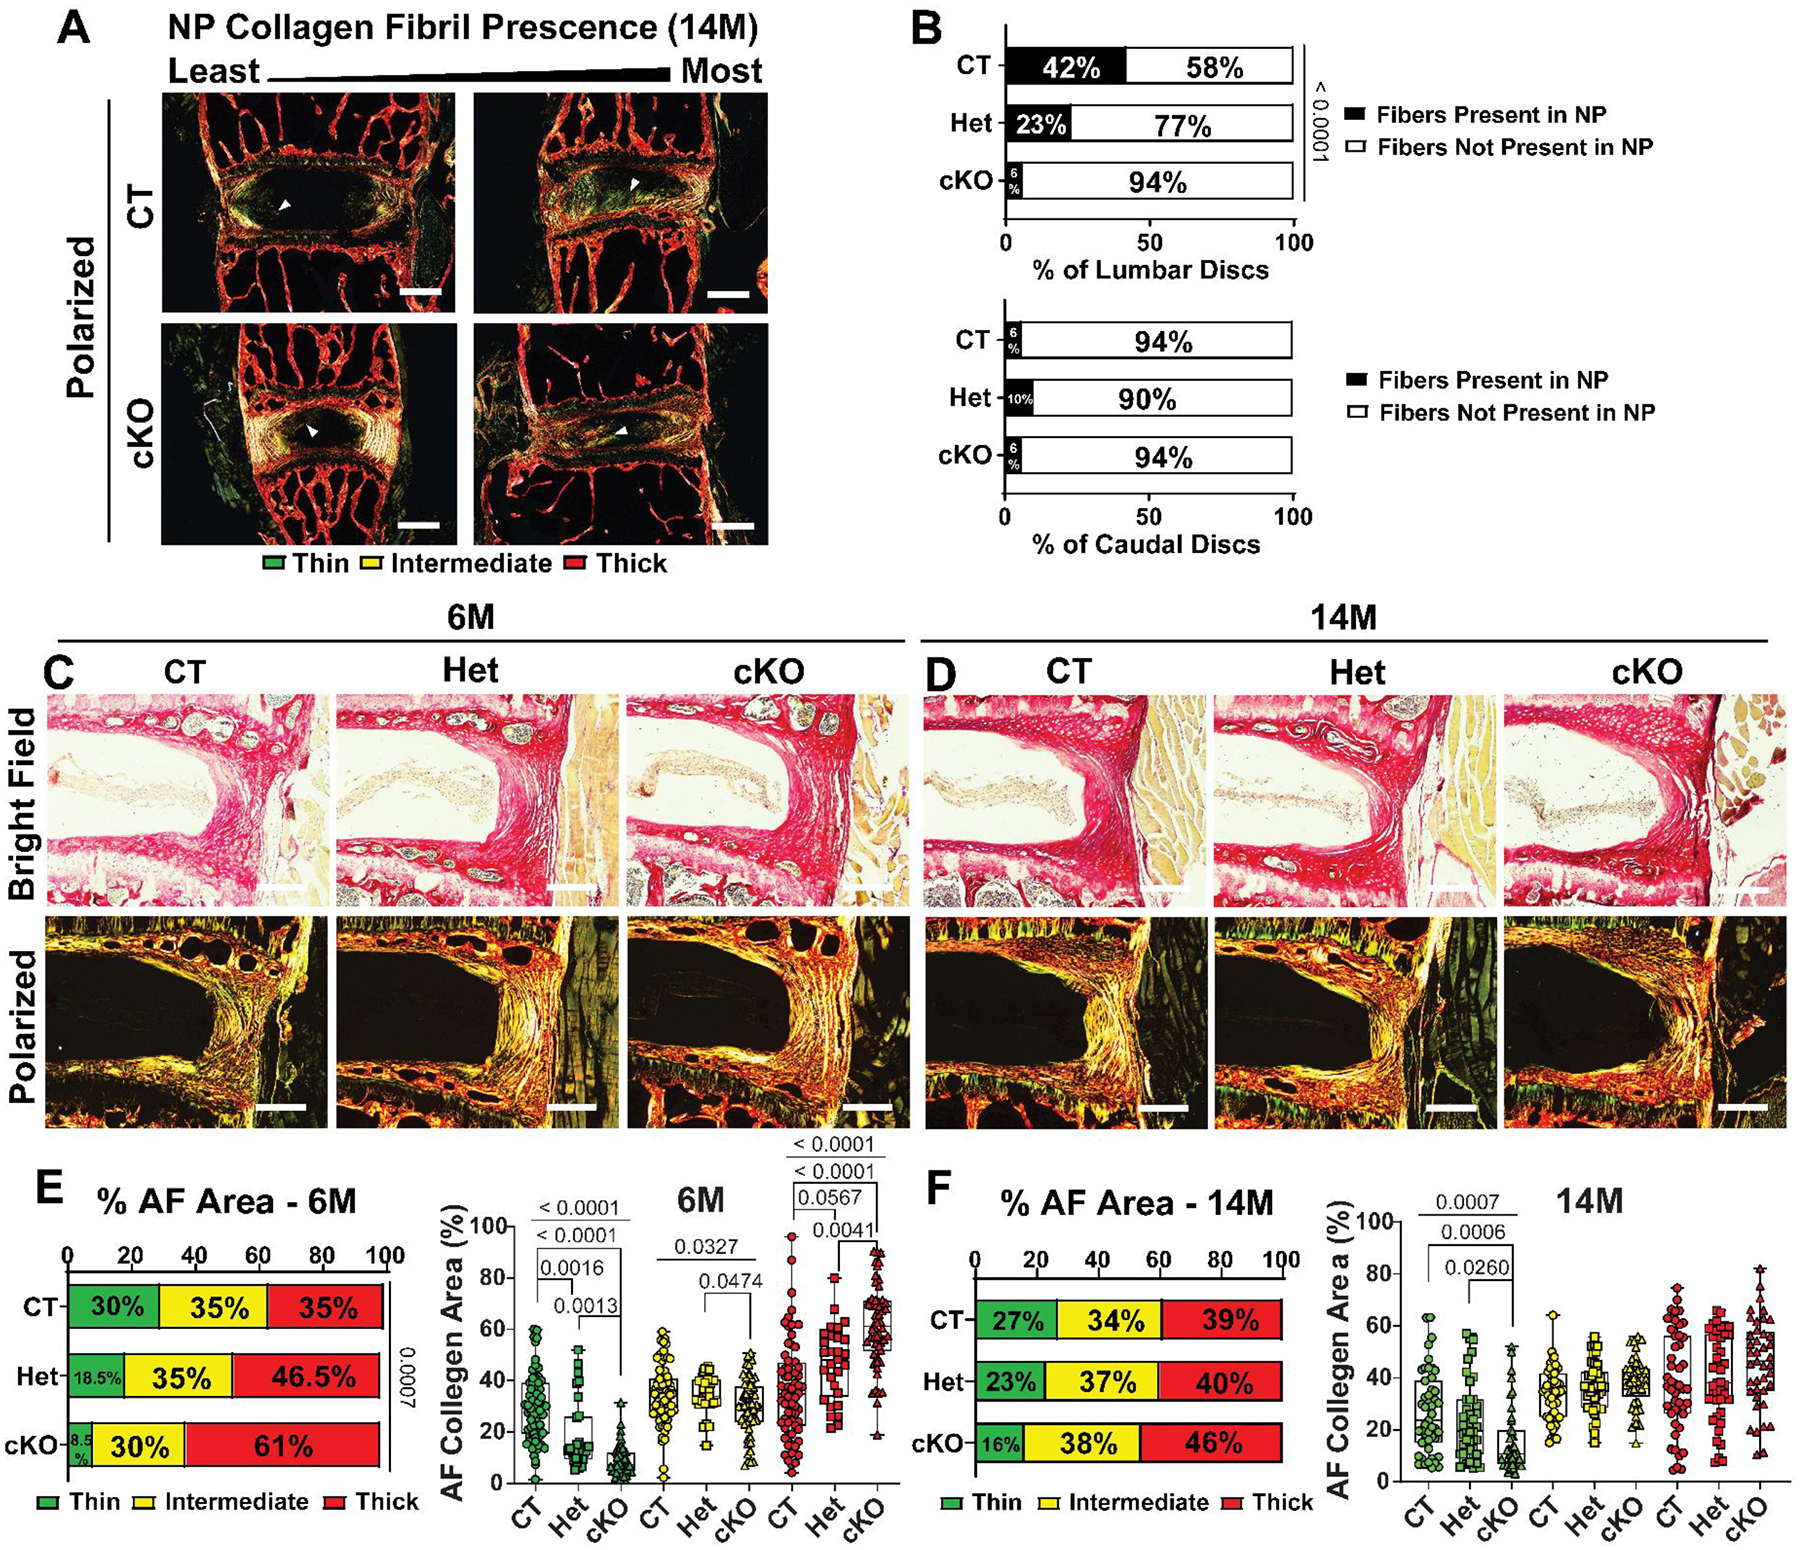
(A) Representative Picrosirius Red staining of 14M lumbar discs showing NP collagen fibers under polarized light (scale bar = 200 μm). White arrow heads indicate fiber formation in the NP compartment. (B) Proportion of 14M discs with collagen fiber formation in the NP, as indicated by Picrosirius Red staining. Representative bright field and polarized images of 6M (C) and 14M (D) AF with Picrosirius Red staining (scale bar = 200 μm). Collagen fiber thickness distribution with corresponding quantification of collagen fiber thicknesses at 6M (E) and 14M (F). (n = 6M: 11 CT, 5 Het, 9 cKO mice, 1–3 discs/mice, 15–33 discs/genotype; n = 14M: 8 CT, 7 Het, 7 cKO mice, 6 discs/mice, 30–54 discs/genotype). Significance for fiber present (B) and distribution (E, F) was determined using a χ2 test. Significance between fiber percentage of AF collagen area (E, F) was determined using Kruskal Wallis with Dunn’s or Welch’s test, as appropriate. Quantitative measurements represent median with interquartile range.
HIF-2αcKO mice demonstrate altered NP matrix composition
To further assess matrix compositional changes, we used imaging-Fourier transform infrared (FTIR) spectroscopy. FTIR clustering was performed using K-Means to define broader anatomical regions of the disc based on chemical composition which showed similarly defined regions between HIF-2αCT and HIF-2αcKO at both 6M and 14M (Fig. 4A). However, when spectra were overlapped clear differences were apparent in NP absorbance peaks between HIF-2αCT (CT) and HIF-2αcKO (cKO) at 6M and 14M (Fig. 4B, 4C, Suppl. Fig. 5A–A”, C–C”). On the contrary, less pronounced changes were seen in the AF absorbance peaks between the genotypes at both ages (Fig. 4B’, 4C’, Suppl. Fig. 5B–B”, D–D”). We analyzed peaks at 1338 cm−1, 1660 cm−1, and 1156 cm−1; corresponding to collagen, total protein (amide I), and cell associated proteoglycans, respectively (Fig. 4D–E”‘). At 6M, both NP and AF of HIF-2αcKO showed decreased collagen content (Fig. 4D–D’). Likewise, HIF-2αcKO showed lower total protein content in NP whereas AF showed a slight increase (Fig. 4D, 4D”). At 14M, analysis revealed significantly less mapped protein and a trend of decrease in collagen in the NP of HIF-2αcKO; and, no notable differences in the AF (Fig. 4E–E”). No differences in cell associated proteoglycan content were seen between the genotypes (Fig. 4D, 4D”‘, 4E, 4E”‘). Additionally, chemical maps of chondroitin sulfate (CS) peak (Fig. 4F) were assessed (50). CS peaks (1064 cm−1) showed decrease in AF of the 6M HIF-2αcKO (Fig. 4F’), and a trend of increased levels at 14M in the NP (Fig. 4F”). Together, results showed that the loss of HIF-2α in the NP decreases the collagen and protein content in the NP and AF at 6M, suggesting a negative role of HIF-2α in homeostatic maintenance of these matrix components.
Fig. 4. Loss of HIF-2α results in changes in chemical composition of the NP compartment.
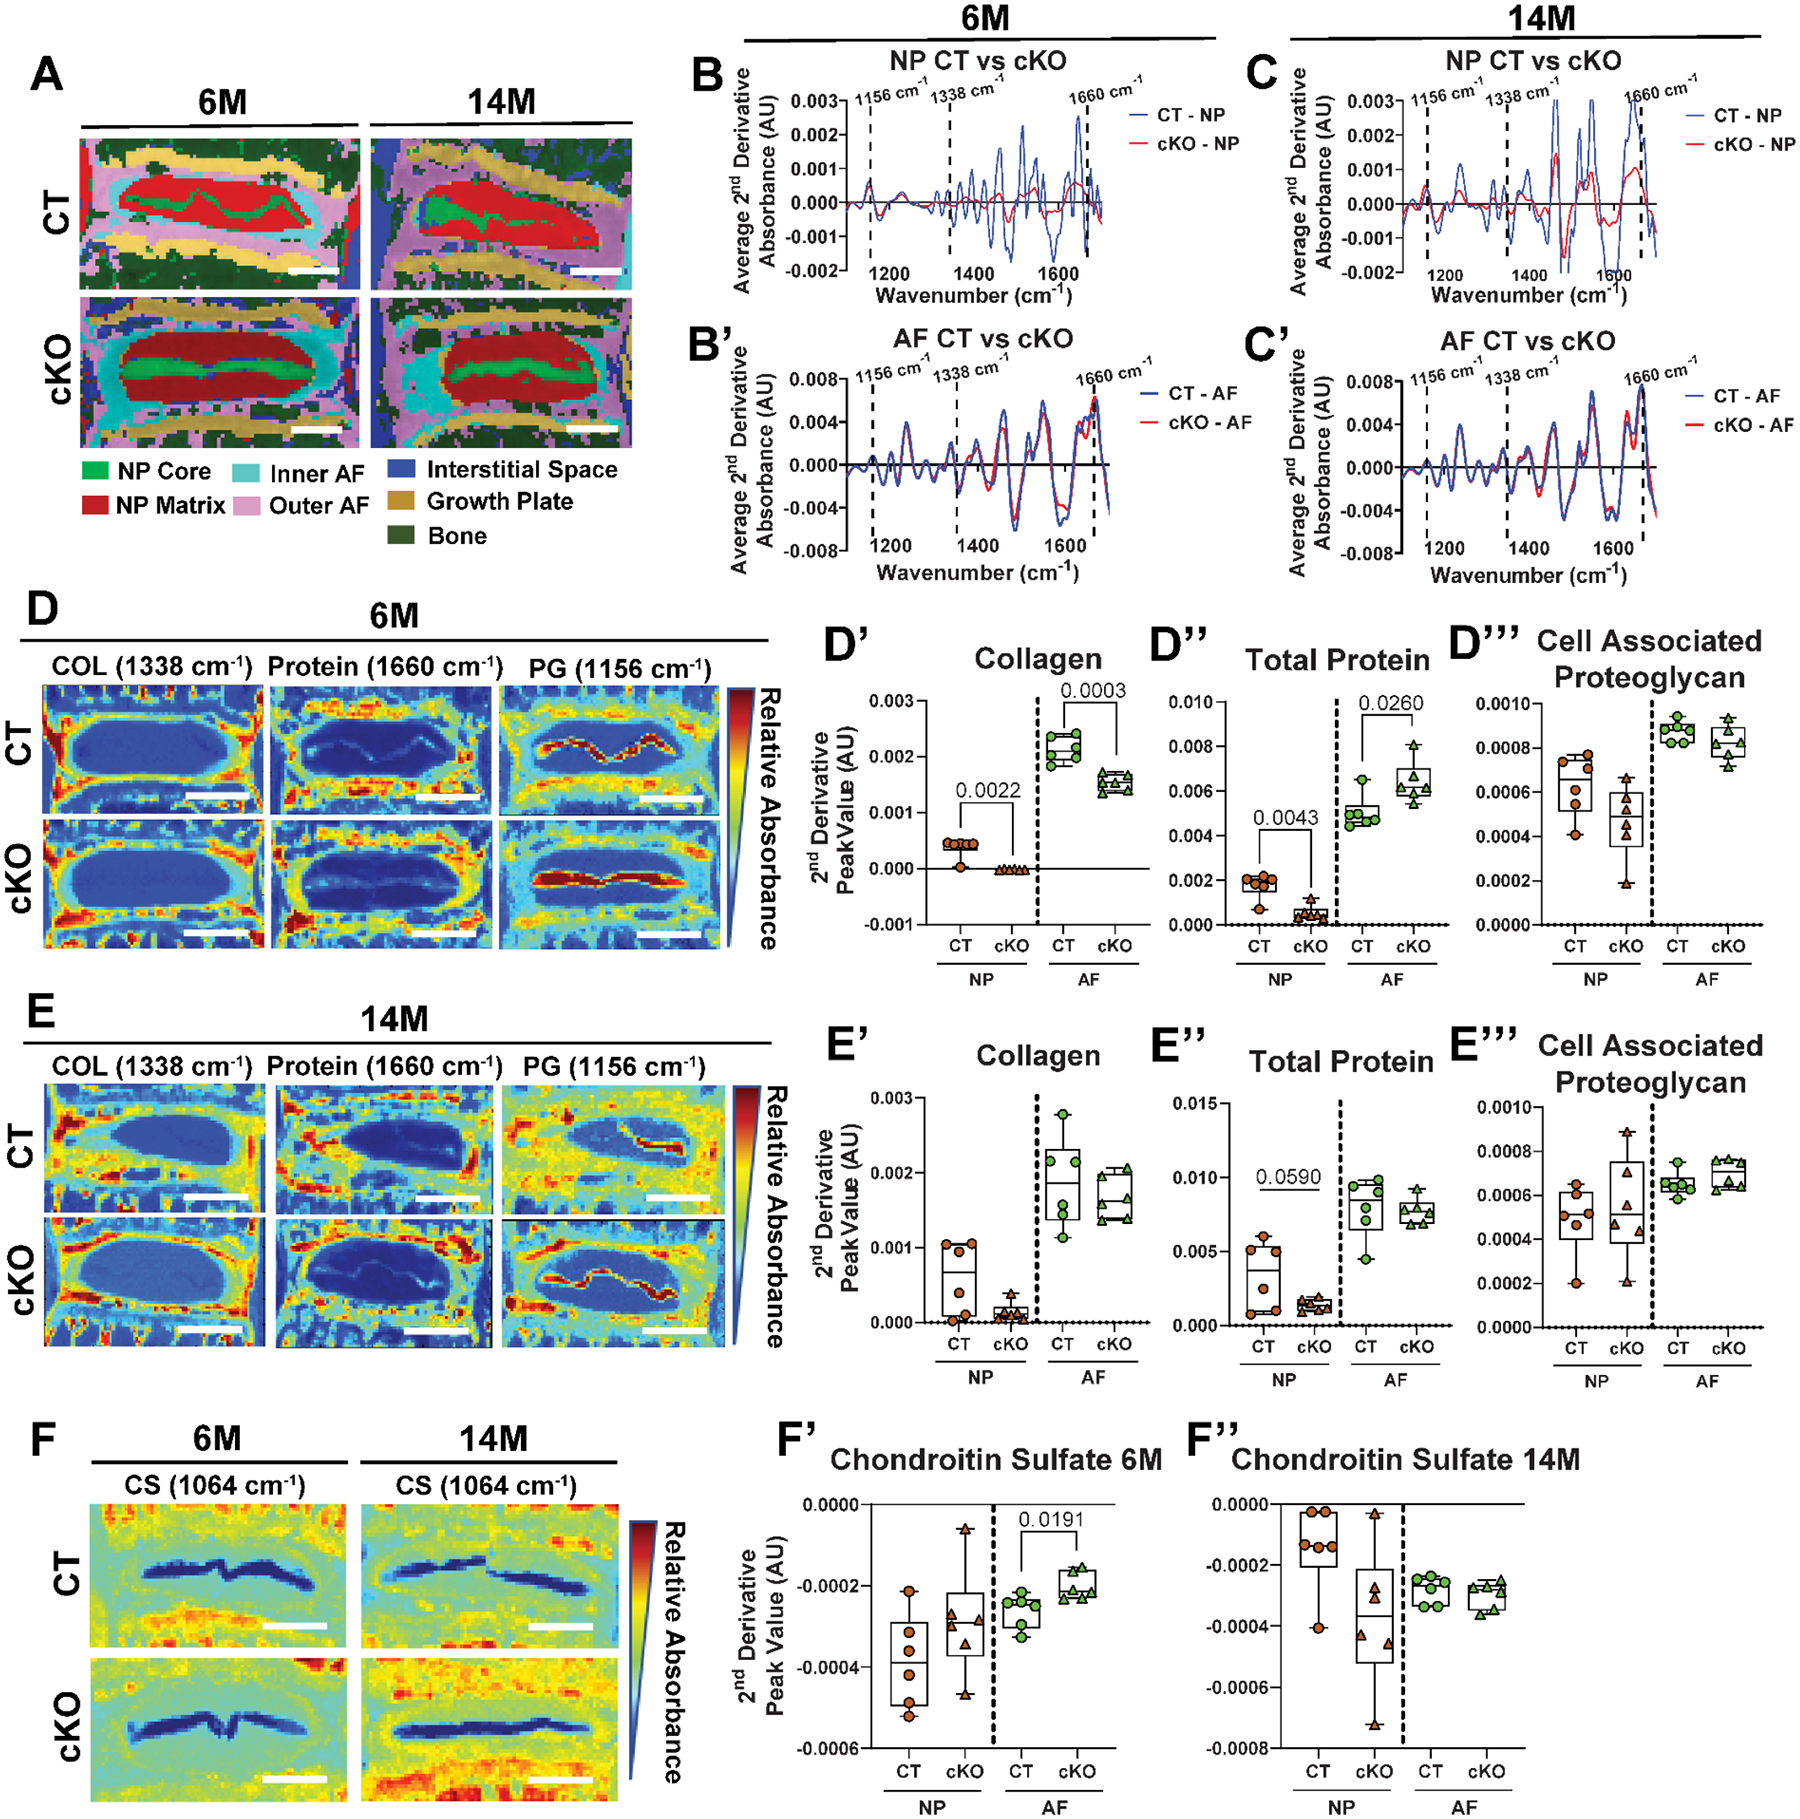
(A) Spectral cluster analysis images of 6M and 14M discs (scale bar = 200 μm). Average second derivative spectra, inverted for positive visualization of the NP and AF of 6M (n = 6 mice/genotype, 1 disc/mouse, 6 total discs/genotype) (B, B’), and 14M discs (6 mice/genotype, n = 2 discs/mouse; 12 total discs/genotype) (C, C’). (D-D”’, E-E”’) Chemical maps (scale bar = 400 μm) and quantification of mean second derivative peaks for collagen (1338 cm−1), total protein (1660 cm−1), and cell-associated proteoglycan (1156 cm−1). (F-F”) Chemical maps (scale bar = 400 μm) and quantification of mean second derivative peak for chondroitin sulfate (1064 cm−1). AU: arbitrary units. Quantitative measurements represent median with interquartile range. Significance of chemical components was determined using an unpaired t-test or Mann-Whitney test, as appropriate.
Loss of HIF-2α does not affect NP cell phenotype, aggrecan functionality, and overall extracellular matrix composition with aging
Further evaluation of the NP cell phenotype and aggrecan functionality was performed using quantitative immunohistochemical staining on 6M and 14M HIF-2αCT and HIF-2αcKO discs. CA3, a NP phenotypic marker showed robust staining in both HIF-2αCT and HIF-2αcKO suggesting maintenance of cell phenotype in HIF-2αcKO discs (Fig. 5A–A’). Aggrecan, a CS substituted proteoglycan, was predominantly localized in the NP and inner AF and showed similar staining between genotypes at 6M and 14M. Quantification of the aggrecan showed a small reduction in staining area in the HIF-2αcKO at 6M but not at 14M (Fig. 5B–B’). When stained for ARGxx, a neopeptide generated by aggrecanase-dependent aggrecan cleavage and degradation, signal was predominantly localized to the inner AF and evidenced a slight increase in the HIF-2αcKO. However, at 14M there was no difference in ARGxx abundance between the genotypes suggesting comparable aggrecan turnover in the AF (Fig. 5C–C’). CS also showed a similar pattern of staining to aggrecan indicating functional aggrecan molecules were present in the HIF-2αcKO discs (Fig. 5D); a slight increase in CS staining area was noted in the inner AF of HIF-2αcKO only at 14M (Fig. 5D’). These results showed that loss of HIF-2α in the NP does not adversely affect NP cell phenotype nor the proteoglycan integrity.
Fig. 5. Loss of HIF-2α does not alter NP cell phenotype and overall extracellular matrix composition with age.
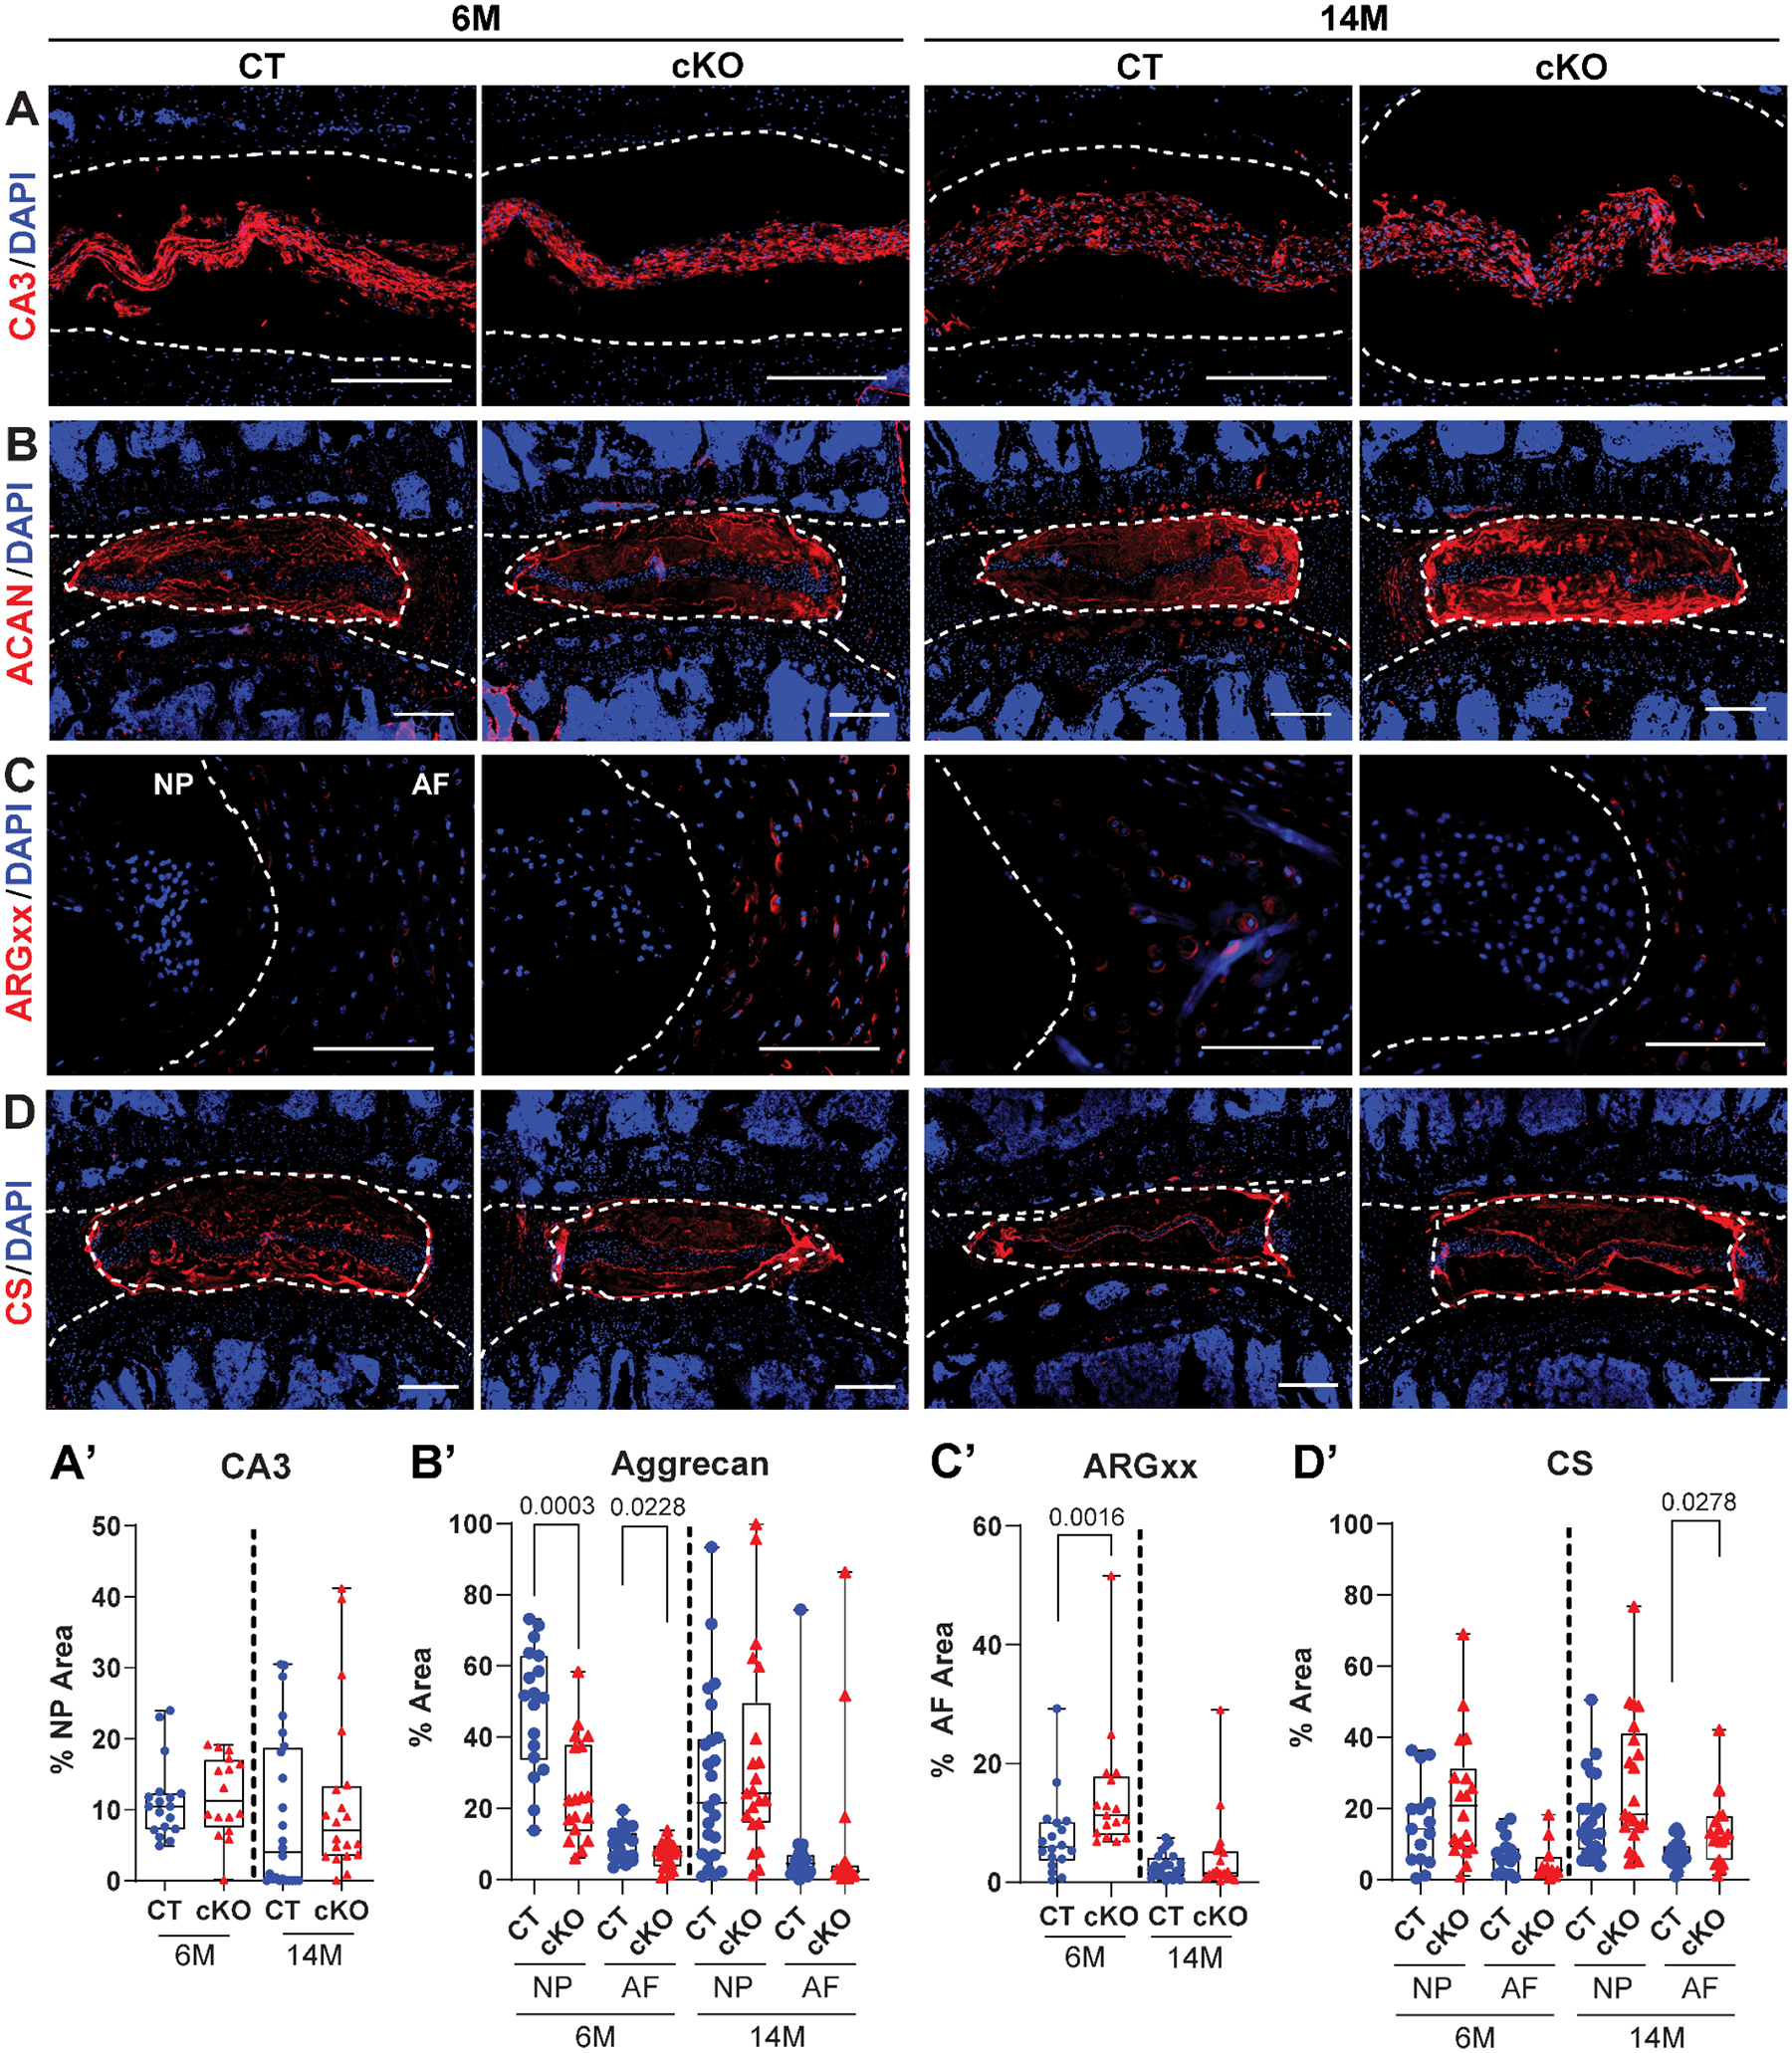
Quantitative immunohistological staining of 6M and 14M HIF-2αCT and HIF-2αcKO lumbar discs for: (A, A’) Carbonic Anhydrase 3 (CA3); (B, B’) Aggrecan (ACAN); (C, C’) aggrecan G1 neoepitope (ARGxx) a marker of aggrecan degradation; (D, D’) chondroitin sulfate (CS). A-D: scale bar = 200 μm. (n = 6–8 mice/genotype/timepoint, 1–3 discs/mouse, 11–24 discs/genotype/marker). White dotted lines demarcate disc compartments. Quantitative measurements represent median with interquartile range. Significance was determined using an unpaired t-test or Mann-Whitney test, as appropriate.
We then stained discs of HIF-2αCT and HIF-2αcKO for the major components of the healthy AF extracellular matrix (ECM) and those associated with matrix degeneration. COMP showed a prominent staining in the AF that was comparable between genotypes at 6M. At 14M however, there was a small but significant increase of COMP in the NP (Fig. 6A–A’). COL 1 (Fig. 6B–B’) and COL2 (Fig. 6C–C’) showed robust and comparable staining in the AF and revealed no difference between the genotypes. COLX, a marker of chondrocyte hypertrophy and associated with disc degeneration showed relatively low staining in discs and there were no changes between the genotypes (Fig. 6D–D’). However, MMP13, a collagenase associated with disc degeneration showed lower abundance in the NP of HIF-2αcKO at 6M, but no differences were seen at 14M (Fig. 6E–E’). These analyses demonstrated that loss of HIF-2α in the NP does not alter major AF matrix components.
Fig. 6. HIF-2αcKO mice do not show altered disc ECM environment.
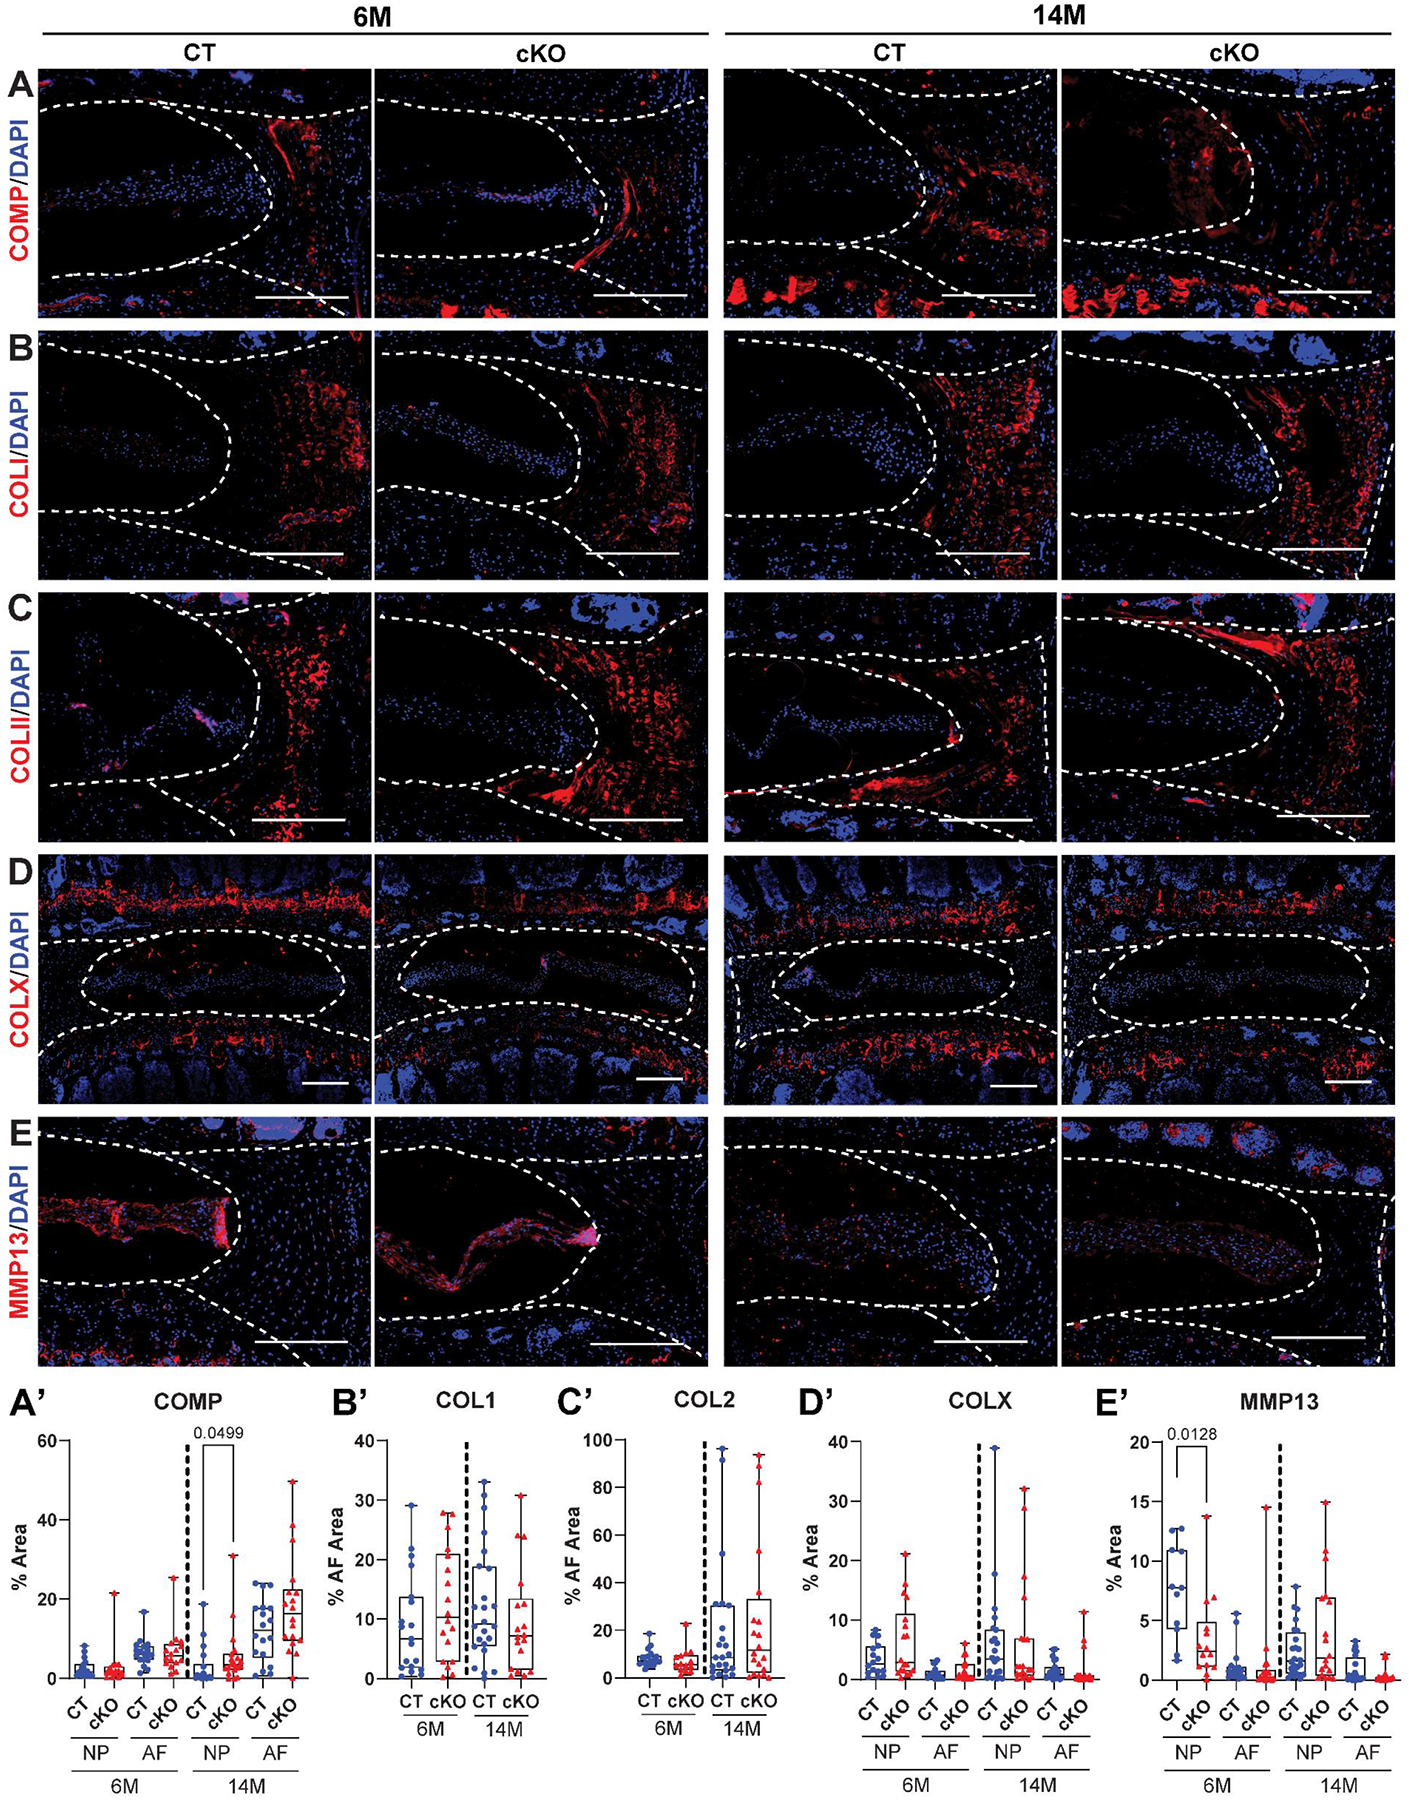
Quantitative immunohistological staining of 6M and 14M HIF-2αCT and HIF-2αcKO lumbar discs for: (A, A’) cartilage oligomeric matrix protein (COMP); (B, B’) collagen 1 (COL1); (C, C’) collagen 2 (COL2); (D, D’) collagen 10 (COLX); and (E, E’) matrix metalloproteinase 13 (MMP13). A-E: scale bar = 200 μm. (n =6–8 mice/genotype/timepoint, 1–3 discs/mouse, 11–24 discs/genotype/marker). White dotted lines demarcate the disc compartments. Quantitative measurements represent median with interquartile range. Significance was determined using an unpaired t-test or Mann–Whitney test, as appropriate.
Loss of HIF-2α modulates expression of molecules linked to tissue inflammation and fibrosis
To explore the mechanisms underlying NP phenotype in 14M HIF-2αcKO, we delineated status of molecules linked to local inflammation and fibrosis (41,52,53). MCP1 was predominantly localized in the NP and showed an increased abundance at 6M but decreased levels at 14M in HIF-2αcKO (Fig. 7A–A’). Similarly, IL-1β was localized in the NP and showed an increased abundance in HIF-2αcKO at 6M, but levels were comparable at 14M (Fig. 7B–B’). IL-6 showed significantly decreased staining at 14M in both NP and AF (Fig. 7C–C’), whereas TGF-β1 did not show difference at 14M (Fig. 7D–D’). We also assessed whether HIF-2α deletion affects anti-oxidative defense mechanisms in the disc. We tested levels of catalase and SOD2, which are regulated by HIF-2α in other cell types (54). Catalase and SOD2 showed a strong staining in the NP but did not show appreciable differences between HIF-2αCT and HIF-2αcKO (Fig. 7E–E’, 7F–F’). These findings suggest that HIF-2α loss decreases the levels of molecules associated with inflammatory and pro-fibrotic environment of the disc with age while maintaining tissue oxidative stress defenses.
Fig. 7. HIF-2α-deficient NP cells show reduced levels of pro-inflammatory markers and comparable levels of oxidative defense molecules.
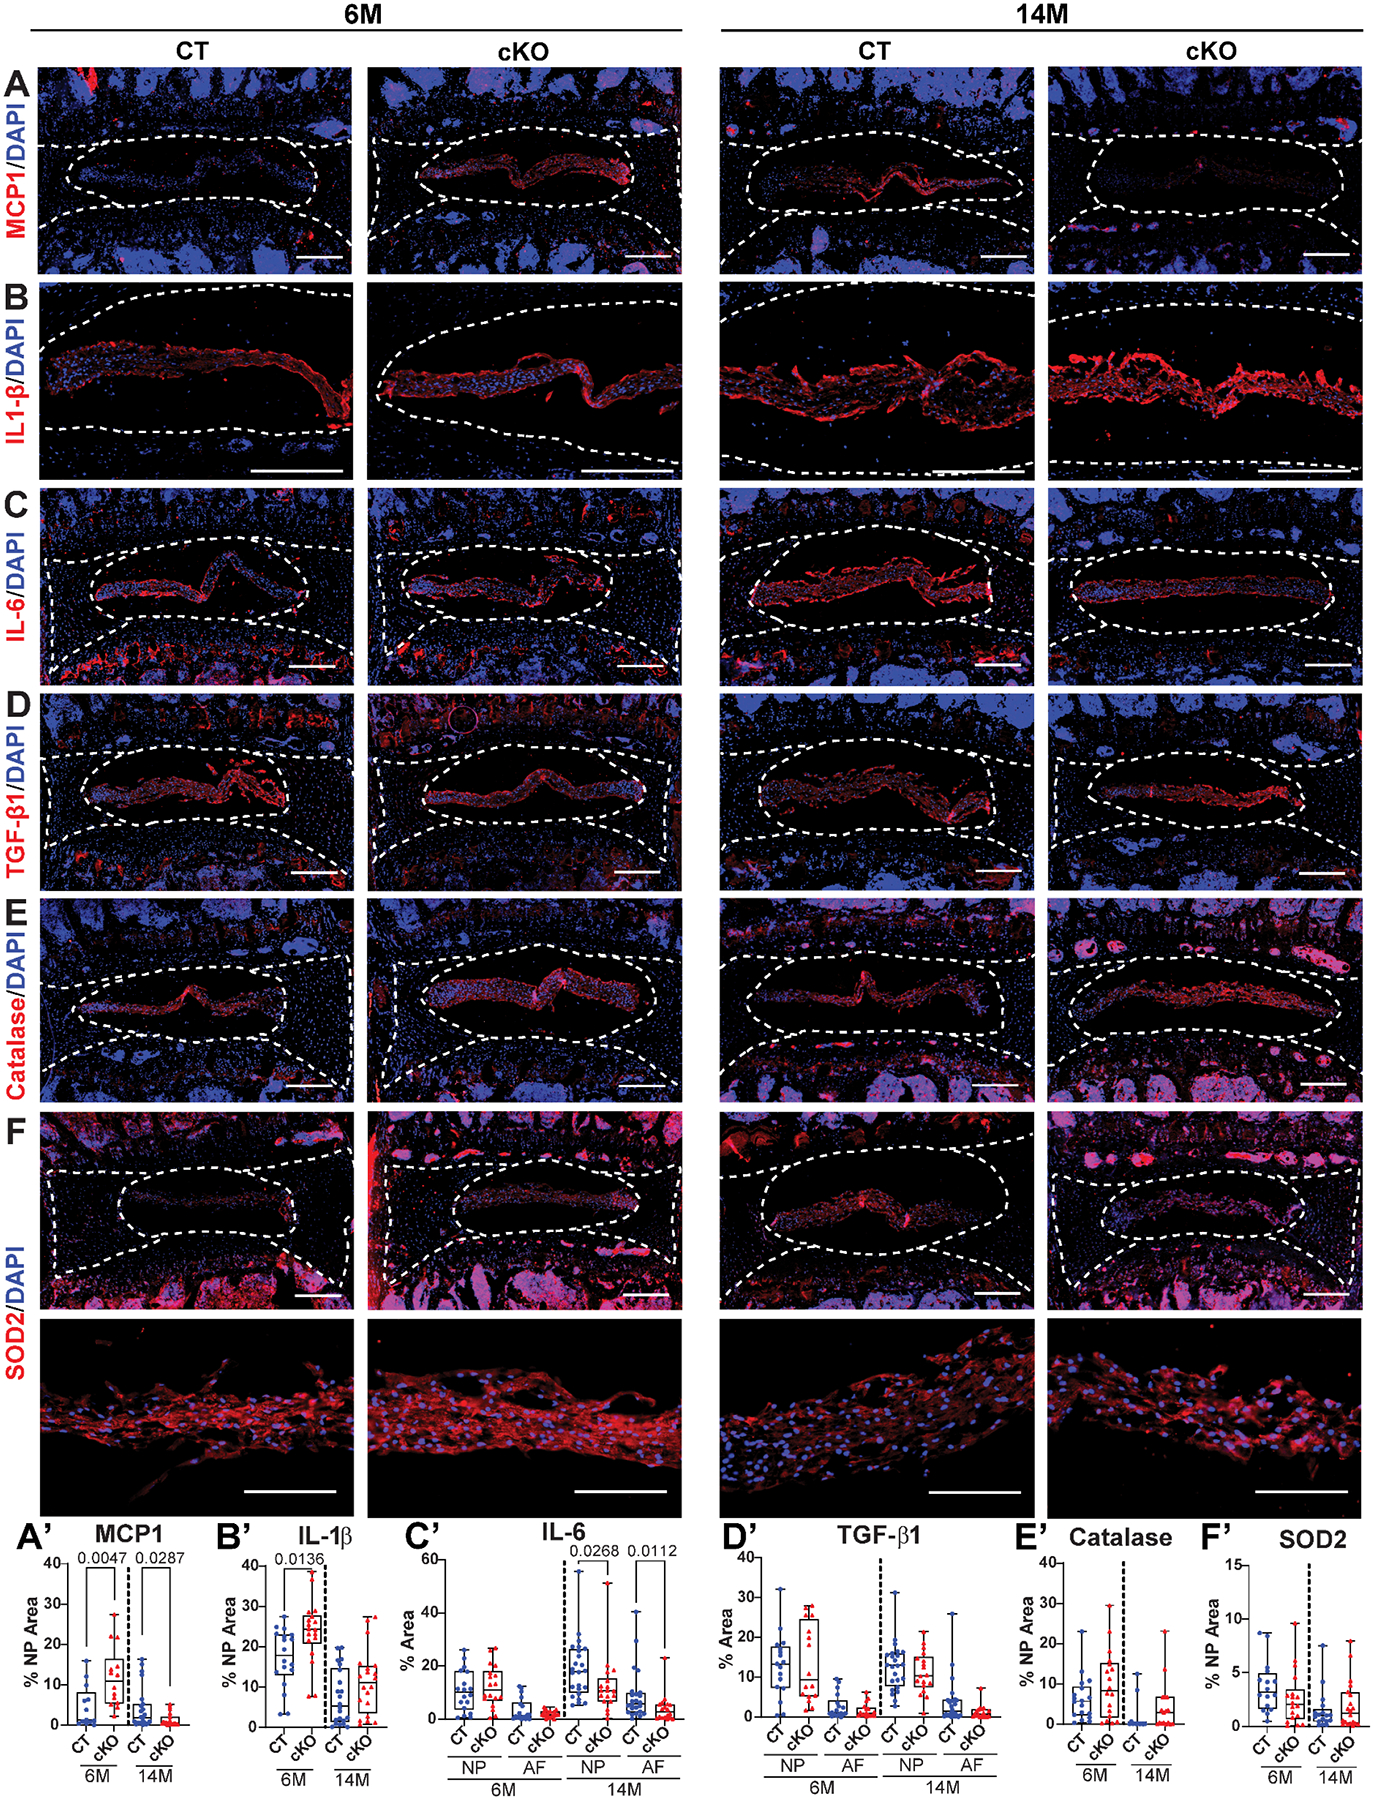
Quantitative immunohistological staining of 6M and 14M HIF-2αCT and HIF-2αcKO lumbar discs for: (A, A’) monocyte chemoattractant protein-1 (MCP1); (B, B’) interlukin-1β (IL-1β); (C, C’) interlukin-6 (IL-6); (D, D’) transforming growth factor β1 (TGF-β1); (E, E’) catalase; (F, F’) superoxide dismutase 2 (SOD2). A-F: scale bar = 200 μm. (n = 6–8 mice/genotype/timepoint, 1–3 discs/mouse, 11–24 discs/genotype/marker). White dotted lines demarcate different disc compartments. Quantitative measurements represent median with interquartile range. Significance was determined using an unpaired t-test or Mann-Whitney test, as appropriate.
Loss of HIF-2α modulates the NP transcriptional program
Microarray analysis was used to understand global transcriptomic changes in HIF-2αcKO NP compartment at 6- and 14M. The array data output was sorted by p ≤ 0.05 and fold change ≥ 2. 3D principal component analysis (PCA) showed that 6M and 14M samples grouped into distinct clusters based on their age and genotype (Fig. 8A). A three-way comparison was done to identify the unique and shared differentially expressed genes (DEGs) in the HIF-2αcKO between the 6M and 14M comparisons, and to ascertain which of those DEGs were associated with aging. The comparison of 6M HIF-2αcKO vs HIF-2αCT, showed 1 285 DEGs, and the comparison, 14M HIF-2αcKO vs HIF-2αCT, showed 122 DEGs. The third comparison, aging related DEGs showed 4 103 DEGs in 14M HIF-2αCT vs 6M HIF-2αCT with some overlap of aging related DEGs into both 6M and 14M HIF-2αcKO DEGs (Fig. 8B). Select DEGs common between HIF-2αcKO at 6M and 14M but not associated with aging were Cxcl12, Man2b1, Kdm5d, Sly, Ddx3y, Ssty2, and Lama3. Some of these genes could be direct targets of HIF-2α in disc; however further studies are necessary to ascertain this notion. Hierarchical clustering of the DEGs was performed between 6M HIF-2αcKO vs HIF-2αCT and 14M HIF-2αcKO vs HIF-2αCT; the data for these is presented as both heatmaps and volcano plots (Fig. 8C–C’, 8D–D’). The volcano plot for 6M group showed 841 Up and 444 Down DEGs (Fig. 8C’), while the 14M plot showed 92 Up and 30 Down DEGs in HIF-2αcKO (Fig. 8D’).
Fig. 8. NP transcriptome of HIF-2αcKO mice show changes in metabolic processes, gene regulation, and regulation of histone binding.
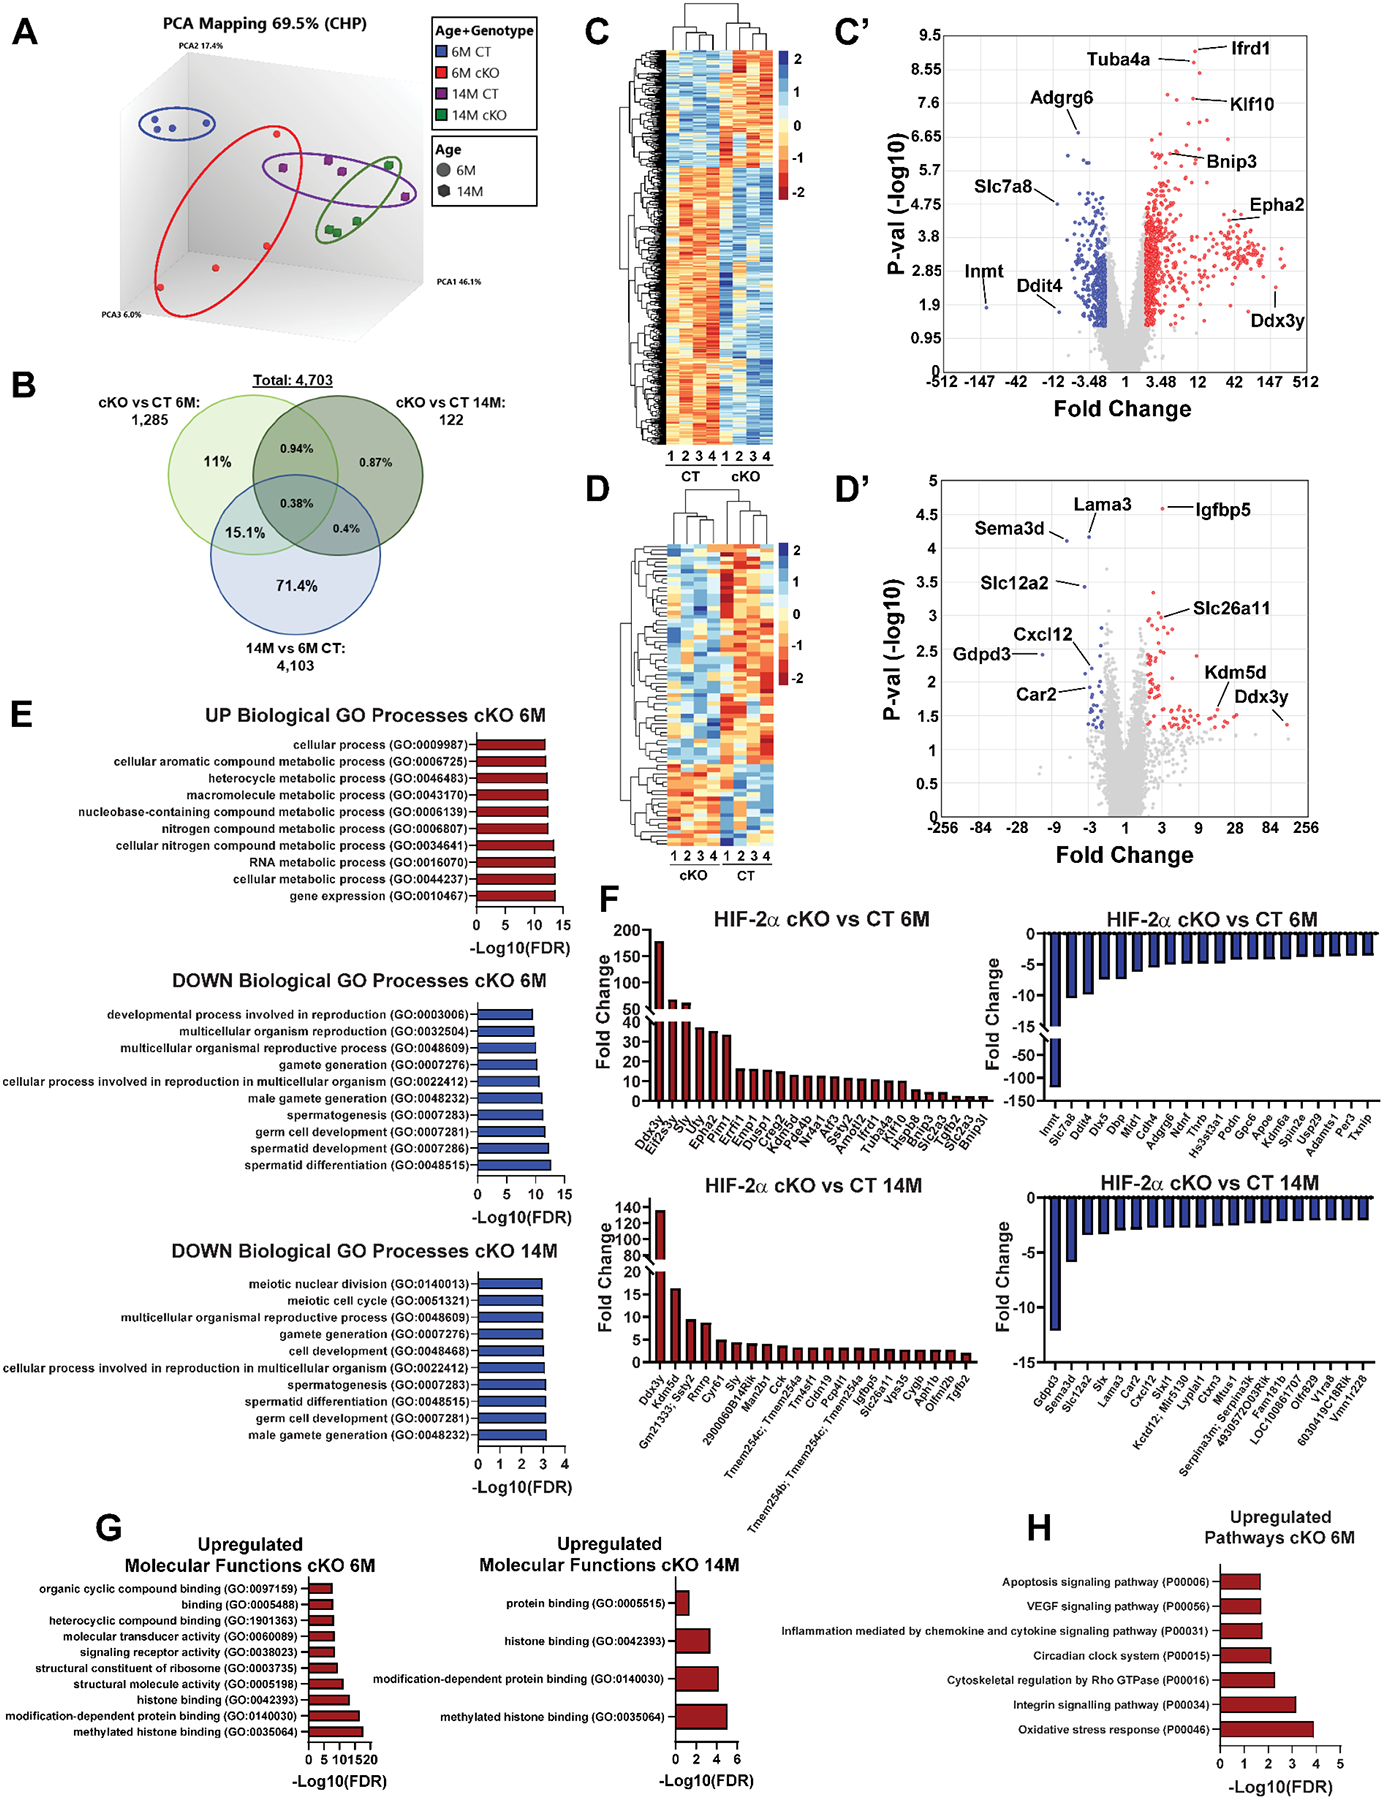
(A) Clustering of biological quadruplicates within genotypes and timepoints assessed by three-dimensional principal component analysis (PCA). (B) 3-way Venn diagram comparing DEGs at p ≤ 0.05 and > ±2-fold change of NP tissue from HIF-2αcKO mice (6M and 14M) with those from comparison between 14M vs 6M CT. Z-score heatmaps of differentially expressed genes at 6M (C) and 14M (D) between HIF-2αCT and HIF-2αcKO. Volcano plots showing the relationship between fold change (> ±2-fold) and p-value (< 0.05) for 6M (C’) and 14M (D’). (E) Representative upregulated GO biological processes at 6M and downregulated at 6M, and downregulated GO biological processes at 14M. (F) Representative upregulated and downregulated DEGs expressed at 6M and at 14M. (G) Representative upregulated GO molecular functions at 6M and 14M. (H) Representative upregulated Panther pathways at 6M. (n = 4 mice/genotype/timepoint, 6 discs/mouse). Representative DEGs were determined by TAC4.0 using cutoffs of p ≤ 0.05 and > ±2. GO analysis to assess biological processes, molecular functions, and pathways was performed using PANTHER overrepresentation test, GO database annotation, Fisher’s exact statistical test with FDR ≤ 0.05.
DEGs were analyzed for gene ontology (GO) using PANTHER. The top upregulated GO biological processes at 6M included regulation of gene expression, metabolic and biosynthetic processes, and regulation of cellular processes (Fig. 8E). Whereas, the top downregulated GO terms at 6M included spermatid differentiation, meiotic cell cycle, cell development, and cell differentiation (Fig. 8E). The select upregulated genes at 6M included Ddx3y, Epha2, Pim1, Bnip3, Binp3L, Hspb8, Tgbf2 and Klf10 of which Klf10 was implicated in preventing disc degeneration through TGF-β (Fig. 8F) (55). The select downregulated genes at 6M included Inmt, Slc7a8 a Na+-independent transporter of neutral amino acids, and Ddit4 (REDD1), Adgrg6, and Adamts1 some of which are known to affect disc health (Fig. 8F) (56,57). The select upregulated genes at 14M included Ddx3y, Ssty, Sly, Kdm5d, Tgfb2, Vps35 and Slc26a11 (Fig. 8F) but the upregulated DEGs at 14M did not show enrichment into GO biological processes. The downregulated GO biological processes at 14M included similar processes to 6M such as gamete generation, cell development, and meiotic cell cycle (Fig. 8E). The downregulated genes included development related genes Gdpd3 that encodes lysophospholipase D and Sema3d, cytosolic pH regulator Car2, and channel Slc12a2 a Na+/K+/Cl− transporter (Fig. 8F). Downregulated gene Cxcl12 is elevated during human disc degeneration (48). Enrichment of terms in downregulated DEGs related to spermatogenesis is not surprising as previous work indicates the critical role of HIF-2α in spermatid development, and several genes related to gonad function and development are expressed in the disc (36,58). The GO molecular functions were clustered from the DEGs, and only the upregulated DEGs at 6M and 14M clustered into molecular function terms. The GO molecular functions associated with upregulated DEGs in HIF-2αcKO at 6M and 14M were histone binding, modification dependent histone binding, and protein binding suggesting changes in chromatin accessibility and transcriptional regulation (Fig. 8G). To get additional insights into signaling pathways affected by loss of HIF-2α, PANTHER pathways associated with DEGs were analyzed and only 6M upregulated DEGs showed enrichment. Upregulated pathways associated with DEGs at 6M included oxidative stress response, integrin signaling, cytoskeletal regulation, circadian clock, inflammation mediated by chemokine and cytokine signaling, VEGF signaling and apoptosis (Fig. 8H). Together the microarray data suggests that HIF-2α loss alters gene regulation, metabolic processes of NP cells, epigenetic changes, and select pathways related to oxidative stress and VEGF signaling to help protect NP cells as the disc ages.
Discussion
HIF-2α, a hypoxia inducible transcription factor, is critical during development as global inactivation of HIF-2α results in embryonic lethality (11,37). Loss-of-function mouse models generated to study HIF-2α in different tissues showed tissue specificity as well as both positive and negative effects of HIF-2α on tissue health (58,59). However, little is known about HIF-2α function in the intervertebral disc. We therefore generated and characterized a NP-specific HIF-2α conditional knockout mouse with a goal to understand its function in this avascular and thus physiologically hypoxic tissue.
Previously we have shown that HIF-1α is a critical regulator for NP cell survival (17). FoxA2Cre; HIF-1αf/f conditional knockout mice showed an early apoptosis of notochordal cells by birth and complete postnatal remodeling and replacement of the NP compartment with cartilage-like tissue. Interestingly, fate mapping and Western blot analyses revealed that HIF-2α null NP cells were retained, appeared healthy, and compartment morphology was preserved postnatally highlighting a distinct role each homologue plays in these cells. Noteworthy, reduced tissue fibrosis, slower progression of degeneration and lower NP grades in 14M HIF-2αcKO compared to HIF-2αCT mice suggested that HIF-2α loss of function results in better NP morphology and health. At a molecular level, NP health assessment using CA3, aggrecan, and chondroitin sulfate showed no impact on disc health (14,34,44,45,49). However, the protective effect that was observed in middle aged (14M) animals was mitigated in old mice (24M) suggesting dominant effect of aging on disc health. Previous studies have shown increased tissue fibrosis as discs ages (34,38,45,60,61). Noteworthy, a significant reduction of collagen fibers present in NP compartment of HIF-2αcKO suggested that HIF-2α deletion prevents tissue stiffening thereby preserving the biomechanical function of the disc. This also explains why the spectral analysis by FTIR showed significantly reduced amounts of collagen and total protein in the NP of HIF-2αcKO. Interestingly, however, NP fibrosis in HIF-2αcKO mice caught up with HIF-2αCT mice by 24M. Moreover, there was a consistent and significant decrease in thin collagen fibers in AF compartment of HIF-2αcKO mice suggesting altered collagen remodeling (62–64). Collectively these results underscore that the loss of HIF-2α transiently protects the disc health during aging.
Proper organization and maintenance of the ECM is critical for disc function (36,38–40). Overall preservation of disc ECM abundance with aging and a slight reduction in MMP13 at 6-months in the NP suggested decline in matrix turnover. Lower burden of tissue-level inflammation, pro-fibrotic molecules and maintenance of oxidative stress defense are positively linked to disc health (41,42,65). It has been shown that pro-inflammatory molecules such as MCP1 and IL-6 which were diminished in HIF-2αcKO are elevated in aged and degenerated discs and are critical in driving pathological processes (41,52,53,65–68). Moreover, in agreement with a study in articular chondrocytes, our data suggests that IL-6 could be a potential HIF-2α target in NP cells (69). Furthermore, while studies in other cell types have shown HIF-2α regulation of oxidative stress levels of catalase and SOD2 were unaffected in HIF-2αcKO (11,70). It is likely that compensatory mechanisms played a role in preserving catalase and SOD2 expression in HIF-2αcKO implying their important contributions to NP cell adaptation to hypoxia. Our results indicate that HIF-2α loss likely provides protection to the disc ECM during aging through reduction of pro-inflammatory and pro-fibrotic response.
HIF-2α function is cell and tissue type specific. It is a catabolic regulator during bone remodeling, has conflicting roles in chondrocyte health, and is shown to control endothelial cell patterning and matrix organization (8,20,22,28,71). Assessment of the biological processes regulated by HIF-2α from our microarray analysis revealed that its function in NP cells shows some similarity with that in endothelial and other cell types (8,72). The biological processes involved gene regulation and cellular development; it is not uncommon that the top DEGs differed between cell types. Several DEGs provided clarity into why the discs of HIF-2αcKO exhibited better morphology. We observed decreased levels of Ddit4 in 6-month HIF-2αcKO. It was recently reported that increased Ddit4 (REDD1) promoted NP ECM degradation and may explain preservation of NP matrix (56). There was a loss of Adgrg6 in 6M HIF-2αcKO, while loss of this gene promotes endplate-oriented disc herniations, no direct effects on the NP or AF tissues were reported supporting our phenotypic observations (57). Recent studies show Cxcl12 is elevated during human disc degeneration, has proangiogenic effects on the NP, and is strongly modulated by HIF-2α (48,73,74). The observed loss of Cxcl12 in HIF-2αcKO corroborates with improved morphological outcomes and lower inflammatory burden. A separate group of genes related to autophagy including Bnip3, Binp3L, Hspb8, Vps35 and Tgfb2 were also upregulated in HIF-2αcKO. Maintenance of autophagic flux is critical for NP cell survival suggesting that induction of autophagy in HIF-2αcKO may underline preservation of NP cell function (16,75,76). This result is in line with an earlier observation that HIF-2α suppresses chondrocyte autophagy (54). Moreover, TGFβ isoforms play pleiotropic functions in disc cell health and loss of TGFβ signaling leads to disc degeneration (77,78). Another set of DEGs of interest were those affecting pH homeostasis, metabolism, and transport mechanisms such as Car2, glucose transporters Slc2a1 (GLUT1) and Slc2a3 (GLUT3), and transporters Slc7a8 (LAT2, sodium-independent amino acids), Slc12a1 (NKCC2, sodium-dependent potassium), and Slc26a11 (KBAT, sulfate). It is therefore plausible that HIF-2α is involved in regulating NP cell metabolism, transport mechanisms, and osmotic balance machinery. This finding warrants further evaluation as osmolarity is important in maintaining the disc health (42,79). Enrichment of DEGs under molecular functions: modifications to histones and protein binding was also in line with role of HIF-2α as a transcription factor. Histones are important for regulation of chromatin architecture, so it would be an interesting avenue to delineate how HIF-2-mediated histone modifications impact the disc function (80). Additionally, upregulated pathways associated with loss of HIF-2α in the NP include oxidative stress response, integrin signaling, cytoskeletal regulation, circadian clock, inflammation mediated by chemokine and cytokine signaling, VEGF signaling and apoptosis. Interestingly these pathways have known associations with HIF-2α in other cell types (9,67,81,82). Although the HIF-2αcKO transcriptome correlates with better attributes of disc health through these associated biological processes, molecular functions, and pathways further studies are needed to fully determine the strength of causality of the effects of HIF-2α on the NP function.
Since the disc is an avascular tissue, and HIF-1α is the major determinant of disc development and homeostasis, we asked a question, could conditional loss of HIF-2α disrupt the homeostatic environment of the disc? Surprisingly, our findings show that in middle-aged 14M mice HIF-2α loss lowers degeneration scores, ameliorates NP fibrosis and modulates pro-inflammatory and pro-fibrotic cytokines, providing protection against age-related disc degeneration (Suppl. Fig. 6). It is known that NP secretes growth and morphogenic factors that control the environment and affects the health of other compartments of the disc, our study supports this idea as HIF-2αcKO show changes in collagen turnover in the AF (83,84). Furthermore, this study supports the notion that HIF-1α and HIF-2α have unique roles, and their function in the disc is non-redundant and cell type specific (85,86). Moreover, it is plausible that deletion of HIF-2α may result in compensatory increase in HIF-1α levels as noted in other cell types (87,88,89). While we have not measured HIF-1α levels in the NP of HIF-2αcKO, we have noted elevated HIF-1β levels implying a possibility of increased HIF-1 signaling which may contribute to the protection seen in 14M mice (90). Additional studies are warranted to delineate cross talk between HIF-α homologues, unique transcriptional targets of HIF-2α that impact disc homeostasis, and its role in the setting of traumatic injury and/or herniation. While the results from this study provide the first evidence that inhibition of HIF-2α could provide plausible benefits in improving disc health with aging, it is challenging to target avascular and inaccessible NP cells.
Supplementary Material
Supplemental Figure 1. Age dependent changes in HIF-2α levels in NP and AF. (A) Western blot, (A’) Western blot overlayed on Ponceau Red stained membrane, and (A”) Ponceau Red stained membrane of NP tissue from mice at 2, 4, 14, 18–25-months from Western blot shown in Figure 1B. (B) Western blot, (B’) Western blot overlayed on Ponceau Red stained membrane, and (B”) Ponceau Red stained membrane of AF tissue from mice at 2, 4, 14, 18–25-months from Western blot shown in Figure 1B.
Supplemental Figure 2. HIF-2α and HIF-1β/ARNT expression in the NP and AF of HIF-2αCT and HIF-2αcKO mice. (A) Western blot, (A’) Western blot overlayed on Ponceau Red stained membrane, and (A”) Ponceau Red stained membrane of HIF-2α from NP and AF tissues from HIF-2αCT and HIF-2αcKO mice shown in Figure 1E. (B) Western blot, (B’) Western blot overlayed on Ponceau Red stained membrane, and (B”) Ponceau Red stained membrane of HIF-1β/ARNT from NP and AF tissues from HIF-2αCT and HIF-2αcKO mice shown in Figure 1E.
Supplemental Figure 3. Histological analysis of HIF-2αcKO mice at 1- and 24M. (A) Safranin O/Fast Green and hematoxylin staining of lumbar discs showing tissue morphology and overall proteoglycan content in 1-month (1M) control: CT (HIF-2αf/f), and conditional knockout: cKO (FoxA2Cre, HIF-2αf/f) animals (scale bars: Lumbar IVD = 200 μm, NP = 50 μm). (B, C) Histological grading assessment of 1M lumbar discs using the modified Thompson scale (n =1M: 5 CT, 5 cKO mice; 6 discs/mouse; 30 discs/genotype). (D) Safranin O/Fast Green and hematoxylin staining of lumbar discs showing tissue morphology and overall proteoglycan content in 24-month (24M) control: CT (HIF-2αf/f), and conditional knockout: cKO (FoxA2Cre, HIF-2αf/f) animals (scale bar = 100 μm). (E, F) Histological grading assessment of 24M lumbar discs using the modified Thompson scale (n = 24M: 9 CT, 10 cKO mice; 4–5 discs/mouse; 45–47 discs/genotype). Significance for grading distribution was determined using a χ2 test and differences between average grading scores was determined using an unpaired t-test or Mann-Whitney test, as appropriate. (G, H) Histological grading assessment between 1M, 6M, 14M, and 24M lumbar discs CT and cKO (G) NP and (H) AF using the modified Thompson scale (n = 1M: 5 CT, 5 cKO mice; 6M: 11 CT, 9 cKO mice; 14M: 8 CT, 7 cKO mice; 24M: 9 CT, 10 cKO mice; 4–6 discs/mouse; 30–66 discs/genotype/t.p.). Statistical significance was determined by Kruskal Wallis with Dunn’s test. Quantitative measurements represent whisker box plots showing all data points with median and interquartile range and maximum and minimum values.
Supplemental Figure 4. Evaluation of fibers in NP and AF lamellar thickness in 24M HIF-2αcKO mice. (A) Polarized light microscopy of picrosirius red stained lumbar discs showing fibers in NP in 24-month (24M) control: CT (HIF-2αf/f), and conditional knockout: cKO (FoxA2Cre, HIF-2αf/f) animals (scale bar = 200 μm). (B) Percentage of lumbar discs showing presence or absence of fibers in NP. (C) Picrosirius Red staining and polarized light microscopy (scale bar = 100 μm), and (D) distribution and quantification of percentage of AF fibers (n =24M: 9 CT, 10 cKO mice; 4–5 discs/mouse; 45–47 discs/genotype). Significance for NP fibers present and AF area distribution was determined using a χ2 test, and difference in AF collagen area were determined using Mann-Whitney test. Quantitative measurements represent whisker box plots showing all data points with median and interquartile range and maximum and minimum values.
Supplemental Figure 5. Enlarged Fourier Average Second Derivative Spectra Wavenumber Graphs. Enlarged average 2nd derivative absorbance of 1156, 1338, and 1660 cm−1, inverted for positive visualization of the (A-A”) NP and (B-B”) AF of 6M (n = 6 mice/genotype, 1 disc/mouse, 6 total discs/genotype) and (C-C”) NP and (D-D”) AF of 14M (n = 6 mice/genotype, 2 discs/mouse, 12 total discs/genotype) discs.
Supplemental Figure 6. Schematic summarizing the role of HIF-2α in the intervertebral disc. A schematic summary showing the role of HIF-2α in the intervertebral disc.
Acknowledgments
We would like to thank Dr. Ernestina Schipani, University of Michigan, for providing the HIF-2α conditional allele and FoxA2Cre driver mice. The authors thank Pranay Ramteke for technical help and feedback on the manuscript.
Funding
Research reported in this publication was supported by R01 AR055655, R01 AR074813, and R01 AG073349 from the National Institute of Arthritis and Musculoskeletal and Skin Diseases (NIAMS) and National Institute on Aging (NIA) of the National Institutes of Health. Shira Johnston was also supported by NIAMS T32 AR052273.
Footnotes
Conflicts of Interest
The authors declare that they have no conflict of interests.
Ethics
All mouse care procedures, housing, breading, the collection of animal tissues, and experiments were performed under protocols approved by the Institutional Animal Care and Use Committee (IACUC) of Thomas Jefferson University in accordance with the IACUC’s relevant guidelines and regulations.
Data Availability Statement
The datasets generated and analyzed during this study are available in the NCBI Gene Expression Omnibus (GEO) repository, accession number: GSE184424.
References
- 1.Livshits G, et al. Lumbar disc degeneration and genetic factors are the main risk factors for low back pain in women: the UK Twin Spine Study. Ann Rheum Dis. 2011. Oct;70(10):1740–5. doi: 10.1136/ard.2010.137836. Epub 2011 Jun 6. [DOI] [PMC free article] [PubMed] [Google Scholar]
- 2.Risbud MV, Schipani E, Shapiro IM. Hypoxic regulation of nucleus pulposus cell survival: from niche to notch. Am J Pathol. 2010. Apr;176(4):1577–83. doi: 10.2353/ajpath.2010.090734. Epub 2010 Feb 4. [DOI] [PMC free article] [PubMed] [Google Scholar]
- 3.Rajpurohit R, Risbud MV, Ducheyne P, Vresilovic EJ, Shapiro IM. Phenotypic characteristics of the nucleus pulposus: expression of hypoxia inducing factor-1, glucose transporter-1 and MMP-2. Cell Tissue Res. 2002. Jun;308(3):401–7. doi: 10.1007/s00441-002-0563-6. Epub 2002 May 25. [DOI] [PubMed] [Google Scholar]
- 4.Agrawal A, et al. Cited2 modulates hypoxia-inducible factor-dependent expression of vascular endothelial growth factor in nucleus pulposus cells of the rat intervertebral disc. Arthritis Rheum. 2008. Dec;58(12):3798–808. doi: 10.1002/art.24073. [DOI] [PubMed] [Google Scholar]
- 5.Tian H, McKnight SL, Russell DW. Endothelial PAS domain protein 1 (EPAS1), a transcription factor selectively expressed in endothelial cells. Genes Dev. 1997. Jan 1;11(1):72–82. doi: 10.1101/gad.11.1.72. [DOI] [PubMed] [Google Scholar]
- 6.Sowter HM, Raval RR, Moore JW, Ratcliffe PJ, Harris AL. Predominant role of hypoxia-inducible transcription factor (Hif)-1alpha versus Hif-2alpha in regulation of the transcriptional response to hypoxia. Cancer Res. 2003. Oct 1;63(19):6130–4. Erratum in: Cancer Res. 2003 Dec 1;63(23):8562. [PubMed] [Google Scholar]
- 7.Hu CJ, Sataur A, Wang L, Chen H, Simon MC. The N-terminal transactivation domain confers target gene specificity of hypoxia-inducible factors HIF-1alpha and HIF-2alpha. Mol Biol Cell. 2007. Nov;18(11):4528–42. doi: 10.1091/mbc.e06-05-0419. Epub 2007 Sep 5. [DOI] [PMC free article] [PubMed] [Google Scholar]
- 8.Downes NL, Laham-Karam N, Kaikkonen MU, Ylä-Herttuala S. Differential but Complementary HIF1α and HIF2α Transcriptional Regulation. Mol Ther. 2018. Jul 5;26(7):1735–1745. doi: 10.1016/j.ymthe.2018.05.004. Epub 2018 May 9. [DOI] [PMC free article] [PubMed] [Google Scholar]
- 9.Kojima I, et al. Protective role of hypoxia-inducible factor-2alpha against ischemic damage and oxidative stress in the kidney. J Am Soc Nephrol. 2007. Apr;18(4):1218–26. doi: 10.1681/ASN.2006060639. Epub 2007 Mar 7. [DOI] [PubMed] [Google Scholar]
- 10.Gilkes DM, Semenza GL, Wirtz D. Hypoxia and the extracellular matrix: drivers of tumour metastasis. Nat Rev Cancer. 2014. Jun;14(6):430–9. doi: 10.1038/nrc3726. Epub 2014 May 15. [DOI] [PMC free article] [PubMed] [Google Scholar]
- 11.Scortegagna M, et al. Multiple organ pathology, metabolic abnormalities and impaired homeostasis of reactive oxygen species in Epas1−/− mice. Nat Genet. 2003. Dec;35(4):331–40. doi: 10.1038/ng1266. Epub 2003 Nov 9. [DOI] [PubMed] [Google Scholar]
- 12.Agrawal A, et al. Normoxic stabilization of HIF-1alpha drives glycolytic metabolism and regulates aggrecan gene expression in nucleus pulposus cells of the rat intervertebral disk. Am J Physiol Cell Physiol. 2007. Aug;293(2):C621–31. doi: 10.1152/ajpcell.00538.2006. Epub 2007 Apr 18. [DOI] [PubMed] [Google Scholar]
- 13.Silagi ES, et al. Bicarbonate Recycling by HIF-1-Dependent Carbonic Anhydrase Isoforms 9 and 12 Is Critical in Maintaining Intracellular pH and Viability of Nucleus Pulposus Cells. J Bone Miner Res. 2018. Feb;33(2):338–355. doi: 10.1002/jbmr.3293. Epub 2017 Oct 9. [DOI] [PMC free article] [PubMed] [Google Scholar]
- 14.Silagi ES, et al. Lactate Efflux From Intervertebral Disc Cells Is Required for Maintenance of Spine Health. J Bone Miner Res. 2020. Mar;35(3):550–570. doi: 10.1002/jbmr.3908. Epub 2019 Dec 12. [DOI] [PMC free article] [PubMed] [Google Scholar]
- 15.Silagi ES, Schipani E, Shapiro IM, Risbud MV. The role of HIF proteins in maintaining the metabolic health of the intervertebral disc. Nat Rev Rheumatol. 2021. Jul;17(7):426–439. doi: 10.1038/s41584-021-00621-2. Epub 2021 Jun 3. [DOI] [PMC free article] [PubMed] [Google Scholar]
- 16.Madhu V, et al. Hypoxic Regulation of Mitochondrial Metabolism and Mitophagy in Nucleus Pulposus Cells Is Dependent on HIF-1α-BNIP3 Axis. J Bone Miner Res. 2020. Aug;35(8):1504–1524. doi: 10.1002/jbmr.4019. Epub 2020 May 15. [DOI] [PMC free article] [PubMed] [Google Scholar]
- 17.Merceron C, et al. Loss of HIF-1α in the notochord results in cell death and complete disappearance of the nucleus pulposus. PLoS One. 2014. Oct 22;9(10):e110768. doi: 10.1371/journal.pone.0110768. [DOI] [PMC free article] [PubMed] [Google Scholar]
- 18.Fujita N, Chiba K, Shapiro IM, Risbud MV. HIF-1α and HIF-2α degradation is differentially regulated in nucleus pulposus cells of the intervertebral disc. J Bone Miner Res. 2012. Feb;27(2):401–12. doi: 10.1002/jbmr.538. [DOI] [PMC free article] [PubMed] [Google Scholar]
- 19.Fujita N, et al. Expression of prolyl hydroxylases (PHDs) is selectively controlled by HIF-1 and HIF-2 proteins in nucleus pulposus cells of the intervertebral disc: distinct roles of PHD2 and PHD3 proteins in controlling HIF-1α activity in hypoxia. J Biol Chem. 2012. May 11;287(20):16975–86. doi: 10.1074/jbc.M111.334466. Epub 2012 Mar 26. [DOI] [PMC free article] [PubMed] [Google Scholar]
- 20.Lee SY, et al. Controlling hypoxia-inducible factor-2α is critical for maintaining bone homeostasis in mice. Bone Res. 2019. May 13;7:14. doi: 10.1038/s41413-019-0054-y. [DOI] [PMC free article] [PubMed] [Google Scholar]
- 21.Merceron C, et al. Hypoxia-inducible factor 2α is a negative regulator of osteoblastogenesis and bone mass accrual. Bone Res. 2019. Feb 21;7:7. doi: 10.1038/s41413-019-0045-z. [DOI] [PMC free article] [PubMed] [Google Scholar]
- 22.Lafont JE, Talma S, Murphy CL. Hypoxia-inducible factor 2alpha is essential for hypoxic induction of the human articular chondrocyte phenotype. Arthritis Rheum. 2007. Oct;56(10):3297–306. doi: 10.1002/art.22878. [DOI] [PubMed] [Google Scholar]
- 23.Stewart AJ, Houston B, Farquharson C. Elevated expression of hypoxia inducible factor-2alpha in terminally differentiating growth plate chondrocytes. J Cell Physiol. 2006. Feb;206(2):435–40. doi: 10.1002/jcp.20481. [DOI] [PubMed] [Google Scholar]
- 24.Araldi E, Khatri R, Giaccia AJ., Simon MC., Schipani E. Lack of HIF-2α in limb bud mesenchyme causes a modest and transient delay of endochondral bone development. Nat Med. 2011;17(1):25–29. doi: 10.1038/nm0111-25. [DOI] [PMC free article] [PubMed] [Google Scholar]
- 25.Lafont JE, Talma S, Hopfgarten C, Murphy CL. Hypoxia promotes the differentiated human articular chondrocyte phenotype through SOX9-dependent and -independent pathways. J Biol Chem. 2008. Feb 22;283(8):4778–86. doi: 10.1074/jbc.M707729200. Epub 2007 Dec 12. [DOI] [PubMed] [Google Scholar]
- 26.Lafont JE. Lack of oxygen in articular cartilage: consequences for chondrocyte biology. Int J Exp Pathol. 2010. Apr;91(2):99–106. doi: 10.1111/j.1365-2613.2010.00707.x. Erratum in: Int J Exp Pathol. 2010 Jun;91(3):302. [DOI] [PMC free article] [PubMed] [Google Scholar]
- 27.Thoms BL, Dudek KA, Lafont JE, Murphy CL. Hypoxia promotes the production and inhibits the destruction of human articular cartilage. Arthritis Rheum. 2013. May;65(5):1302–12. doi: 10.1002/art.37867. [DOI] [PubMed] [Google Scholar]
- 28.Liang Y, Mei Y, Guan S, et al. AB0982 Prevalence of osteoarthritis in high altitude area of Tibet. Annals of the Rheumatic Diseases 2018;77:1613. doi: 10.1136/annrheumdis-2018-eular.6679 [DOI] [Google Scholar]
- 29.Hoy D, Toole MJ, Morgan D, Morgan C. Low back pain in rural Tibet. Lancet. 2003;361(9353):225–226. doi: 10.1016/S0140-6736(03)12254-4. [DOI] [PubMed] [Google Scholar]
- 30.Saito T, et al. Transcriptional regulation of endochondral ossification by HIF-2alpha during skeletal growth and osteoarthritis development. Nat Med. 2010. Jun;16(6):678–86. doi: 10.1038/nm.2146. Epub 2010 May 23. [DOI] [PubMed] [Google Scholar]
- 31.Saito T, Kawaguchi H. HIF-2α as a possible therapeutic target of osteoarthritis. Osteoarthritis Cartilage. 2010. Dec;18(12):1552–6. doi: 10.1016/j.joca.2010.10.006. Epub 2010 Oct 13. [DOI] [PubMed] [Google Scholar]
- 32.Yang S, et al. Hypoxia-inducible factor-2alpha is a catabolic regulator of osteoarthritic cartilage destruction. Nat Med. 2010. Jun;16(6):687–93. doi: 10.1038/nm.2153. Epub 2010 May 23. [DOI] [PubMed] [Google Scholar]
- 33.Kumar A, Yamaguchi T, Sharma P, Kuehn MR. Transgenic mouse lines expressing Cre recombinase specifically in posterior notochord and notochord. Genesis. 2007. Dec;45(12):729–36. doi: 10.1002/dvg.20346. [DOI] [PubMed] [Google Scholar]
- 34.Silagi ES, Batista P, Shapiro IM, Risbud MV. Expression of Carbonic Anhydrase III, a Nucleus Pulposus Phenotypic Marker, is Hypoxia-responsive and Confers Protection from Oxidative Stress-induced Cell Death. Sci Rep. 2018. Mar 20;8(1):4856. doi: 10.1038/s41598-018-23196-7. [DOI] [PMC free article] [PubMed] [Google Scholar]
- 35.Uetzmann L, Burtscher I, Lickert H. A mouse line expressing Foxa2-driven Cre recombinase in node, notochord, floorplate, and endoderm. Genesis. 2008. Oct;46(10):515–22. doi: 10.1002/dvg.20410. [DOI] [PubMed] [Google Scholar]
- 36.Wang B, et al. On the origin of Tibetans and their genetic basis in adapting high-altitude environments. PLoS One. 2011. Feb 28;6(2):e17002. doi: 10.1371/journal.pone.0017002. [DOI] [PMC free article] [PubMed] [Google Scholar]
- 37.Tian H, Hammer RE, Matsumoto AM, Russell DW, McKnight SL. The hypoxia-responsive transcription factor EPAS1 is essential for catecholamine homeostasis and protection against heart failure during embryonic development. Genes Dev. 1998. Nov 1;12(21):3320–4. doi: 10.1101/gad.12.21.3320. [DOI] [PMC free article] [PubMed] [Google Scholar]
- 38.Kumaresan S, Yoganandan N, Pintar FA, Macias M, Cusick JF. Morphology of young and old cervical spine intervertebral disc tissues. Biomed Sci Instrum. 2000;36:141–6. [PubMed] [Google Scholar]
- 39.Iatridis JC, Setton LA, Weidenbaum M, Mow VC. Alterations in the mechanical behavior of the human lumbar nucleus pulposus with degeneration and aging. J Orthop Res. 1997. Mar;15(2):318–22. doi: 10.1002/jor.1100150224. [DOI] [PubMed] [Google Scholar]
- 40.Tessier S, et al. Arp2/3 inactivation causes intervertebral disc and cartilage degeneration with dysregulated TonEBP-mediated osmoadaptation. JCI Insight. 2020. Feb 27;5(4):e131382. doi: 10.1172/jci.insight.131382. [DOI] [PMC free article] [PubMed] [Google Scholar]
- 41.Novais EJ, et al. Long-term treatment with senolytic drugs Dasatinib and Quercetin ameliorates age-dependent intervertebral disc degeneration in mice. Nat Commun. 2021. Sep 3;12(1):5213. doi: 10.1038/s41467-021-25453-2. [DOI] [PMC free article] [PubMed] [Google Scholar]
- 42.Tessier S, et al. TonEBP-deficiency accelerates intervertebral disc degeneration underscored by matrix remodeling, cytoskeletal rearrangements, and changes in proinflammatory gene expression. Matrix Biol. 2020. May;87:94–111. doi: 10.1016/j.matbio.2019.10.007. Epub 2019 Nov 9. [DOI] [PMC free article] [PubMed] [Google Scholar]
- 43.Battié MC, Videman T, Levälahti E, Gill K, Kaprio J. Genetic and environmental effects on disc degeneration by phenotype and spinal level: a multivariate twin study. Spine (Phila Pa 1976). 2008;33(25):2801–2808. doi: 10.1097/BRS.0b013e31818043b7. [DOI] [PubMed] [Google Scholar]
- 44.Tsingas M, et al. Sox9 deletion causes severe intervertebral disc degeneration characterized by apoptosis, matrix remodeling, and compartment-specific transcriptomic changes. Matrix Biol. 2020. Dec;94:110–133. doi: 10.1016/j.matbio.2020.09.003. Epub 2020 Oct 4. [DOI] [PMC free article] [PubMed] [Google Scholar]
- 45.Choi H, et al. A novel mouse model of intervertebral disc degeneration shows altered cell fate and matrix homeostasis. Matrix Biol. 2018. Sep;70:102–122. doi: 10.1016/j.matbio.2018.03.019. Epub 2018 Mar 29. [DOI] [PMC free article] [PubMed] [Google Scholar]
- 46.Dayan D, Hiss Y, Hirshberg A, Bubis JJ, Wolman M Are the polarization colors of picrosirius red-stained collagen determined only by the diameter of the fibers?. Histochemistry. 1989;93(1):27–29. doi: 10.1007/BF00266843. [DOI] [PubMed] [Google Scholar]
- 47.Schindelin J, et al. Fiji: an open-source platform for biological-image analysis. Nat Methods. 2012. Jun 28;9(7):676–82. doi: 10.1038/nmeth.2019. [DOI] [PMC free article] [PubMed] [Google Scholar]
- 48.Er ZJ, Yin CF, Wang WJ, Chen XJ. Serum CXCL12/SDF-1 level is positively related with lumbar intervertebral disc degeneration and clinical severity. Innate Immun. 2020. Jul;26(5):341–350. doi: 10.1177/1753425919895086. Epub 2019 Dec 18. [DOI] [PMC free article] [PubMed] [Google Scholar]
- 49.Watanabe H, Nakata K, Kimata K, Nakanishi I, Yamada Y. Dwarfism and age-associated spinal degeneration of heterozygote cmd mice defective in aggrecan. Proc Natl Acad Sci USA. 1997. Jun 24;94(13):6943–7. doi: 10.1073/pnas.94.13.6943. [DOI] [PMC free article] [PubMed] [Google Scholar]
- 50.Mader KT, et al. Investigation of intervertebral disc degeneration using multivariate FTIR spectroscopic imaging. Faraday Discuss. 2016. Jun 23;187(1):393–414. doi: 10.1039/c5fd00160a. [DOI] [PMC free article] [PubMed] [Google Scholar]
- 51.Gruber M, et al. Acute postnatal ablation of Hif-2alpha results in anemia. Proc Natl Acad Sci U S A. 2007. Feb 13;104(7):2301–6. doi: 10.1073/pnas.0608382104. Epub 2007 Feb 6. [DOI] [PMC free article] [PubMed] [Google Scholar]
- 52.Weber KT, et al. Serum levels of the proinflammatory cytokine interleukin-6 vary based on diagnoses in individuals with lumbar intervertebral disc diseases. Arthritis Res Ther. 2016. Jan 7;18:3. doi: 10.1186/s13075-015-0887-8. [DOI] [PMC free article] [PubMed] [Google Scholar]
- 53.Deng X, Zhao F, Kang B, Zhang X. Elevated interleukin-6 expression levels are associated with intervertebral disc degeneration. Exp Ther Med. 2016. Apr;11(4):1425–1432. doi: 10.3892/etm.2016.3079. Epub 2016 Feb 16. [DOI] [PMC free article] [PubMed] [Google Scholar]
- 54.Bohensky J, et al. Regulation of autophagy in human and murine cartilage: hypoxia-inducible factor 2 suppresses chondrocyte autophagy. Arthritis Rheum. 2009. May;60(5):1406–15. doi: 10.1002/art.24444. [DOI] [PMC free article] [PubMed] [Google Scholar]
- 55.Wu T, et al. Krüppel like factor 10 prevents intervertebral disc degeneration via TGF-β signaling pathway both in vitro and in vivo. J Orthop Translat. 2021. May 15;29:19–29. doi: 10.1016/j.jot.2021.04.003. [DOI] [PMC free article] [PubMed] [Google Scholar]
- 56.Yin H, et al. The involvement of regulated in development and DNA damage response 1 (REDD1) in the pathogenesis of intervertebral disc degeneration. Exp Cell Res. 2018. Nov 15;372(2):188–197. doi: 10.1016/j.yexcr.2018.10.001. Epub 2018 Oct 9. [DOI] [PubMed] [Google Scholar]
- 57.Liu Z, et al. Dysregulation of STAT3 signaling is associated with endplate-oriented herniations of the intervertebral disc in Adgrg6 mutant mice. PLoS Genet. 2019. Oct 25;15(10):e1008096. doi: 10.1371/journal.pgen.1008096. [DOI] [PMC free article] [PubMed] [Google Scholar]
- 58.Gruber M, Mathew LK, Runge AC, Garcia JA, Simon MC. EPAS1 Is Required for Spermatogenesis in the Postnatal Mouse Testis. Biol Reprod. 2010. Jun;82(6):1227–36. doi: 10.1095/biolreprod.109.079202. Epub 2010 Feb 24. [DOI] [PMC free article] [PubMed] [Google Scholar]
- 59.Dioum EM, Clarke SL, Ding K, Repa JJ, Garcia JA. HIF-2alpha-haploinsufficient mice have blunted retinal neovascularization due to impaired expression of a proangiogenic gene battery. Invest Ophthalmol Vis Sci. 2008. Jun;49(6):2714–20. doi: 10.1167/iovs.07-1469. Epub 2008 Feb 15. [DOI] [PubMed] [Google Scholar]
- 60.Dahia CL, Mahoney EJ, Durrani AA, Wylie C. Postnatal growth, differentiation, and aging of the mouse intervertebral disc. Spine (Phila Pa 1976). 2009. Mar 1;34(5):447–55. doi: 10.1097/BRS.0b013e3181990c64. [DOI] [PubMed] [Google Scholar]
- 61.Vo NV, et al. Molecular mechanisms of biological aging in intervertebral discs. J Orthop Res. 2016. Aug;34(8):1289–306. doi: 10.1002/jor.23195. Epub 2016 Aug 12. [DOI] [PMC free article] [PubMed] [Google Scholar]
- 62.Montes GS, Junqueira LC. The use of the Picrosirius-polarization method for the study of the biopathology of collagen. Mem Inst Oswaldo Cruz. 1991;86 Suppl 3:1–11. doi: 10.1590/s0074-02761991000700002. [DOI] [PubMed] [Google Scholar]
- 63.Rabau MY, Dayan D. Polarization microscopy of picrosirius red stained sections: a useful method for qualitative evaluation of intestinal wall collagen. Histol Histopathol. 1994. Jul;9(3):525–8. [PubMed] [Google Scholar]
- 64.Sharma R, Rehani S, Mehendiratta M, Kardam P, Kumra M, Mathias Y, Yadav J, Sahay K. Architectural Analysis of Picrosirius Red Stained Collagen in Oral Epithelial Dysplasia and Oral Squamous Cell Carcinoma using Polarization Microscopy. J Clin Diagn Res. 2015. Dec;9(12):EC13–6. doi: 10.7860/JCDR/2015/13476.6872. Epub 2015 Dec 1. [DOI] [PMC free article] [PubMed] [Google Scholar]
- 65.Novais EJ, et al. Comparison of inbred mouse strains shows diverse phenotypic outcomes of intervertebral disc aging. Aging Cell. 2020. May;19(5):e13148. doi: 10.1111/acel.13148. Epub 2020 Apr 22. [DOI] [PMC free article] [PubMed] [Google Scholar]
- 66.Novais EJ, Diekman BO, Shapiro IM, Risbud MV. p16Ink4a deletion in cells of the intervertebral disc affects their matrix homeostasis and senescence associated secretory phenotype without altering onset of senescence. Matrix Biol. 2019. Sep;82:54–70. doi: 10.1016/j.matbio.2019.02.004. Epub 2019 Feb 24. [DOI] [PMC free article] [PubMed] [Google Scholar]
- 67.Phillips KL, et al. The cytokine and chemokine expression profile of nucleus pulposus cells: implications for degeneration and regeneration of the intervertebral disc. Arthritis Res Ther. 2013;15(6):R213. doi: 10.1186/ar4408. [DOI] [PMC free article] [PubMed] [Google Scholar]
- 68.Zhu X, et al. Contribution of chemokine CCL2/CCR2 signaling in the dorsal root ganglion and spinal cord to the maintenance of neuropathic pain in a rat model of lumbar disc herniation. J Pain. 2014. May;15(5):516–26. doi: 10.1016/j.jpain.2014.01.492. Epub 2014 Jan 23. [DOI] [PubMed] [Google Scholar]
- 69.Ryu JH, et al. Interleukin-6 plays an essential role in hypoxia-inducible factor 2α-induced experimental osteoarthritic cartilage destruction in mice. Arthritis Rheum. 2011. Sep;63(9):2732–43. doi: 10.1002/art.30451. [DOI] [PubMed] [Google Scholar]
- 70.Oktay Y, et al. Hypoxia-inducible factor 2alpha regulates expression of the mitochondrial aconitase chaperone protein frataxin. J Biol Chem. 2007. Apr 20;282(16):11750–6. doi: 10.1074/jbc.M611133200. Epub 2007 Feb 23. [DOI] [PubMed] [Google Scholar]
- 71.Murphy CL. HIF-2alpha--a mediator of osteoarthritis? Cell Res. 2010. Sep;20(9):977–9. doi: 10.1038/cr.2010.99. Epub 2010 Jul 13. [DOI] [PubMed] [Google Scholar]
- 72.Lee M, Won Y, Shin Y, Kim JH, Chun JS. Reciprocal activation of hypoxia-inducible factor (HIF)-2α and the zinc-ZIP8-MTF1 axis amplifies catabolic signaling in osteoarthritis. Osteoarthritis Cartilage. 2016. Jan;24(1):134–45. doi: 10.1016/j.joca.2015.07.016. Epub 2015 Aug 1. [DOI] [PubMed] [Google Scholar]
- 73.Zhang H, He B. SDF1/CXCR4 axis plays a role in angiogenesis during the degeneration of intervertebral discs. Mol Med Rep. 2019;20(2):1203–1211. doi: 10.3892/mmr.2019.10346. [DOI] [PMC free article] [PubMed] [Google Scholar]
- 74.Befani C, Liakos P. The role of hypoxia-inducible factor-2 alpha in angiogenesis. J Cell Physiol. 2018;233(12):9087–9098. doi: 10.1002/jcp.26805. [DOI] [PubMed] [Google Scholar]
- 75.Choi H, et al. Hypoxia promotes noncanonical autophagy in nucleus pulposus cells independent of MTOR and HIF1A signaling. Autophagy. 2016. Sep;12(9):1631–46. doi: 10.1080/15548627.2016.1192753. Epub 2016 Jun 17. [DOI] [PMC free article] [PubMed] [Google Scholar]
- 76.Madhu V, Guntur AR, Risbud MV. Role of autophagy in intervertebral disc and cartilage function: implications in health and disease. Matrix Biol. 2021. Jun;100–101:207–220. doi: 10.1016/j.matbio.2020.12.002. Epub 2020 Dec 7. [DOI] [PMC free article] [PubMed] [Google Scholar]
- 77.Baffi MO, et al. Conditional deletion of the TGF-beta type II receptor in Col2a expressing cells results in defects in the axial skeleton without alterations in chondrocyte differentiation or embryonic development of long bones. Dev Biol. 2004. Dec 1;276(1):124–42. doi: 10.1016/j.ydbio.2004.08.027. [DOI] [PubMed] [Google Scholar]
- 78.Alkhatib B, Liu C, Serra R. Tgfbr2 is required in Acan-expressing cells for maintenance of the intervertebral and sternocostal joints. JOR Spine. 2018. Jun;1(2):e1025. doi: 10.1002/jsp2.1025. Epub 2018 Jun 22. [DOI] [PMC free article] [PubMed] [Google Scholar]
- 79.Johnson ZI, Shapiro IM, Risbud MV. Extracellular osmolarity regulates matrix homeostasis in the intervertebral disc and articular cartilage: evolving role of TonEBP. Matrix Biol. 2014. Nov;40:10–6. doi: 10.1016/j.matbio.2014.08.014. Epub 2014 Aug 27. [DOI] [PMC free article] [PubMed] [Google Scholar]
- 80.Bannister AJ, Kouzarides T. Regulation of chromatin by histone modifications. Cell Res. 2011. Mar;21(3):381–95. doi: 10.1038/cr.2011.22. Epub 2011 Feb 15. [DOI] [PMC free article] [PubMed] [Google Scholar]
- 81.Imtiyaz HZ, Simon MC. Hypoxia-inducible factors as essential regulators of inflammation. Curr Top Microbiol Immunol. 2010;345:105–120. doi: 10.1007/82_2010_74. [DOI] [PMC free article] [PubMed] [Google Scholar]
- 82.Ryu JH, Shin Y, Huh YH, Yang S, Chun CH, Chun JS. Hypoxia-inducible factor-2α regulates Fas-mediated chondrocyte apoptosis during osteoarthritic cartilage destruction. Cell Death Differ. 2012;19(3):440–450. doi: 10.1038/cdd.2011.111. [DOI] [PMC free article] [PubMed] [Google Scholar]
- 83.Dahia CL, Mahoney E, Wylie C. Shh signaling from the nucleus pulposus is required for the postnatal growth and differentiation of the mouse intervertebral disc. PLoS One. 2012;7(4):e35944. doi: 10.1371/journal.pone.0035944. [DOI] [PMC free article] [PubMed] [Google Scholar]
- 84.Peck SH, McKee KK, Tobias JW, Malhotra NR, Harfe BD, Smith LJ. Whole Transcriptome Analysis of Notochord-Derived Cells during Embryonic Formation of the Nucleus Pulposus. Sci Rep. 2017;7(1):10504. Published 2017 Sep 5. doi: 10.1038/s41598-017-10692-5. [DOI] [PMC free article] [PubMed] [Google Scholar]
- 85.Loboda A, Jozkowicz A, Dulak J. HIF-1 and HIF-2 transcription factors--similar but not identical. Mol Cells. 2010. May;29(5):435–42. doi: 10.1007/s10059-010-0067-2. Epub 2010 Apr 12. [DOI] [PubMed] [Google Scholar]
- 86.Rankin EB, et al. Hypoxia-inducible factor-2 (HIF-2) regulates hepatic erythropoietin in vivo. J Clin Invest. 2007. Apr;117(4):1068–77. doi: 10.1172/JCI30117. [DOI] [PMC free article] [PubMed] [Google Scholar]
- 87.Menrad H, Werno C, Schmid T, Copanaki E, Deller T, Dehne N, Brüne B. Roles of hypoxia-inducible factor-1alpha (HIF-1alpha) versus HIF-2alpha in the survival of hepatocellular tumor spheroids. Hepatology. 2010. Jun;51(6):2183–92. doi: 10.1002/hep.23597. [DOI] [PubMed] [Google Scholar]
- 88.Schulz K, Milke L, Rübsamen D, Menrad H, Schmid T, Brüne B. HIF-1α protein is upregulated in HIF-2α depleted cells via enhanced translation. FEBS Lett. 2012. Jun 4;586(11):1652–7. doi: 10.1016/j.febslet.2012.04.039. Epub 2012 May 2. [DOI] [PubMed] [Google Scholar]
- 89.Tsuboi I, Yamashita T, Nagano M, Kimura K, To’a Salazar G, Ohneda O. Impaired expression of HIF-2α induces compensatory expression of HIF-1α for the recovery from anemia. J Cell Physiol. 2015. Jul;230(7):1534–48. doi: 10.1002/jcp.24899. [DOI] [PubMed] [Google Scholar]
- 90.Mandl M, Lieberum MK, Depping R. A HIF-1α-driven feed-forward loop augments HIF signalling in Hep3B cells by upregulation of ARNT. Cell Death Dis. 2016. Jun 30;7(6):e2284. doi: 10.1038/cddis.2016.187. [DOI] [PMC free article] [PubMed] [Google Scholar]
Associated Data
This section collects any data citations, data availability statements, or supplementary materials included in this article.
Supplementary Materials
Supplemental Figure 1. Age dependent changes in HIF-2α levels in NP and AF. (A) Western blot, (A’) Western blot overlayed on Ponceau Red stained membrane, and (A”) Ponceau Red stained membrane of NP tissue from mice at 2, 4, 14, 18–25-months from Western blot shown in Figure 1B. (B) Western blot, (B’) Western blot overlayed on Ponceau Red stained membrane, and (B”) Ponceau Red stained membrane of AF tissue from mice at 2, 4, 14, 18–25-months from Western blot shown in Figure 1B.
Supplemental Figure 2. HIF-2α and HIF-1β/ARNT expression in the NP and AF of HIF-2αCT and HIF-2αcKO mice. (A) Western blot, (A’) Western blot overlayed on Ponceau Red stained membrane, and (A”) Ponceau Red stained membrane of HIF-2α from NP and AF tissues from HIF-2αCT and HIF-2αcKO mice shown in Figure 1E. (B) Western blot, (B’) Western blot overlayed on Ponceau Red stained membrane, and (B”) Ponceau Red stained membrane of HIF-1β/ARNT from NP and AF tissues from HIF-2αCT and HIF-2αcKO mice shown in Figure 1E.
Supplemental Figure 3. Histological analysis of HIF-2αcKO mice at 1- and 24M. (A) Safranin O/Fast Green and hematoxylin staining of lumbar discs showing tissue morphology and overall proteoglycan content in 1-month (1M) control: CT (HIF-2αf/f), and conditional knockout: cKO (FoxA2Cre, HIF-2αf/f) animals (scale bars: Lumbar IVD = 200 μm, NP = 50 μm). (B, C) Histological grading assessment of 1M lumbar discs using the modified Thompson scale (n =1M: 5 CT, 5 cKO mice; 6 discs/mouse; 30 discs/genotype). (D) Safranin O/Fast Green and hematoxylin staining of lumbar discs showing tissue morphology and overall proteoglycan content in 24-month (24M) control: CT (HIF-2αf/f), and conditional knockout: cKO (FoxA2Cre, HIF-2αf/f) animals (scale bar = 100 μm). (E, F) Histological grading assessment of 24M lumbar discs using the modified Thompson scale (n = 24M: 9 CT, 10 cKO mice; 4–5 discs/mouse; 45–47 discs/genotype). Significance for grading distribution was determined using a χ2 test and differences between average grading scores was determined using an unpaired t-test or Mann-Whitney test, as appropriate. (G, H) Histological grading assessment between 1M, 6M, 14M, and 24M lumbar discs CT and cKO (G) NP and (H) AF using the modified Thompson scale (n = 1M: 5 CT, 5 cKO mice; 6M: 11 CT, 9 cKO mice; 14M: 8 CT, 7 cKO mice; 24M: 9 CT, 10 cKO mice; 4–6 discs/mouse; 30–66 discs/genotype/t.p.). Statistical significance was determined by Kruskal Wallis with Dunn’s test. Quantitative measurements represent whisker box plots showing all data points with median and interquartile range and maximum and minimum values.
Supplemental Figure 4. Evaluation of fibers in NP and AF lamellar thickness in 24M HIF-2αcKO mice. (A) Polarized light microscopy of picrosirius red stained lumbar discs showing fibers in NP in 24-month (24M) control: CT (HIF-2αf/f), and conditional knockout: cKO (FoxA2Cre, HIF-2αf/f) animals (scale bar = 200 μm). (B) Percentage of lumbar discs showing presence or absence of fibers in NP. (C) Picrosirius Red staining and polarized light microscopy (scale bar = 100 μm), and (D) distribution and quantification of percentage of AF fibers (n =24M: 9 CT, 10 cKO mice; 4–5 discs/mouse; 45–47 discs/genotype). Significance for NP fibers present and AF area distribution was determined using a χ2 test, and difference in AF collagen area were determined using Mann-Whitney test. Quantitative measurements represent whisker box plots showing all data points with median and interquartile range and maximum and minimum values.
Supplemental Figure 5. Enlarged Fourier Average Second Derivative Spectra Wavenumber Graphs. Enlarged average 2nd derivative absorbance of 1156, 1338, and 1660 cm−1, inverted for positive visualization of the (A-A”) NP and (B-B”) AF of 6M (n = 6 mice/genotype, 1 disc/mouse, 6 total discs/genotype) and (C-C”) NP and (D-D”) AF of 14M (n = 6 mice/genotype, 2 discs/mouse, 12 total discs/genotype) discs.
Supplemental Figure 6. Schematic summarizing the role of HIF-2α in the intervertebral disc. A schematic summary showing the role of HIF-2α in the intervertebral disc.
Data Availability Statement
The datasets generated and analyzed during this study are available in the NCBI Gene Expression Omnibus (GEO) repository, accession number: GSE184424.