

Abstract
Alzheimer’s disease (AD) patients present with symptoms such as impairment of insulin signaling, chronic inflammation, and oxidative stress. Furthermore, there are comorbidities associated with AD progression. For example, osteoporosis is common with AD wherein patients exhibit reduced mineralization, and a risk for fragility fractures. However, there is a lack of understanding on the effects of AD on bone beyond loss of bone density. To this end, we investigated the effects AD on bone quality using the 5XFAD transgenic mouse model in which twelve-month-old 5XFAD mice showed accumulation of amyloid-beta (Aβ42) compared to wild-type littermates (N=10/group; 50% Female, 50% Male). Here, we observed changes in cortical bone but not in cancellous bone quality. Both bone mass and bone quality, measured in femoral samples using imaging (μCT, confocal Raman spectroscopy, X-ray Diffraction), mechanical (fracture tests) and chemical analyses (biochemical assays), were altered in the 5XFAD mice compared to WT. MicroCT results showed 5XFAD mice had lower volumetric BMD, and increased endocortical bone loss. XRD results showed decreased mineralization with smaller mineral crystals. Bone matrix compositional properties, from Raman, showed decreased crystallinity along with higher accumulation of glycoxidation products and glycation products, measured biochemically. 5XFAD mice also demonstrated loss of initiation and maximum toughness. We observed that CML and mineralization correlated with initiation toughness while crystal size and PEN correlated with maximum toughness suggesting bone matrix changes predominated by AGEs and altered/poor mineral quality explained loss of fracture toughness. Our findings highlight two pathways to skeletal fragility in AD through alteration of bone quality: (1) accumulation of AGEs; and (2) loss of crystallinity, decreased crystal size and loss of mineralization. We observed that the accumulation of amyloidosis in brain correlated with an increase in several AGEs, consistent with a mechanistic link between elevated Aβ42 levels in the brain and AGE accumulation in bone.
Keywords: Alzheimer’s Disease, 5XFAD Transgenic Mouse Model, Bone QCT/microCT, Glycoxidation, Biomechanics
Introduction
Alzheimer’s disease (AD) is an irreversible and progressive form of dementia that affects over 50 million people worldwide [1]. While the pathology behind the neurodegeneration seen with AD is still not fully understood, there are two main proteins associated with the toxicity cascade, beta-amyloid and tau, which comprise the hallmarks of AD [2]–[7]. The abnormal processing of the amyloid precursor protein (APP) leading to accumulation of beta amyloid peptide (Aβ) results in plaques or clusters referred to as senile plaques (SPs) [2]. Meanwhile, the hyperphosphorylation of the intracellular microtubule-binding protein tau leads to an abundance of neurofibrillary tangles (NFTs) [3]. Moreover, AD patients present with myriad other symptoms such as cellular signaling dysregulation, impairment of insulin signaling, chronic inflammation, synapse loss, cellular metabolism disorders, and oxidative stress [4]–[7].
There are many contributing factors to AD occurrence, with research suggesting that lifestyle, environmental, and genetic factors all play an important role. For example, lifestyle habits such as high-fat diets (HFDs) and sleep fragmentation have been shown to increase chronic inflammation and, in turn, increase the risk of AD development [8], [9]. Certain mutations, such as APP, PSEN1 and PSEN2, increase the risk for early-onset AD (EOAD) [10]. Whereas other genes, such as APOE4 is strongly linked to late-onset AD (LOAD) diagnosis [11].
Furthermore, there are many comorbidities associated with AD progression. In particular, the impairment of insulin signaling, chronic inflammation and oxidative stress seen with AD have made diabetes a very severe comorbidity of AD [5], [12], [13]. In fact, hyperglycemia causes oxidative stress that damages the endothelial lining of the blood-brain barrier and produces a significant amount of toxic lipids and ceramides that exacerbates the neurodegeneration cascade [13]. This causes increased stress on the brain tissue and leads to insulin resistance in the brain triggering the formation of advanced glycation end-products (AGEs) [14], [15]. AGEs are produced by non-enzymatic reaction between reducing sugars such as glucose and macromolecules such as proteins, DNA, and lipids which are the predominant components of plaques [14]. AGEs can also destroy cell membrane function and damage insulin receptor activity and have been identified in both SPs and NFTs [15]. Similarly, AGEs form in bone with aging due to immunosenescence which generates a high level of oxidants and AGEs [16]. Accumulation of AGEs can affect bone’s ability to turnover by inducing osteoclastogenesis through upregulation of RANKL and downregulating differentiation of osteoblasts [17] leading to increased bone fragility [18]–[20].
Skeletal fragility is another severe comorbidity of AD with patients exhibiting an increased risk for fracture [21], [22], reduced bone mineral density (BMD) [23]–[25], and a higher chance for osteoporosis [26]. In fact, osteoporosis – a disease marked by loss of bone – can occur at twice the rate in AD patients, regardless of gender [27]. This epidemiological data suggests that regulatory pathways may be shared by both brain and bone [28], [29]. One such pathway is the Wnt/β-catenin intracellular signaling pathway [30]–[32]. Wnt signaling activates the transcriptional coregulator β-catenin which mediates both bone formation and regulation of synaptogenesis and neurogenesis in the brain [31]. The triggering receptor expressed on myeloid cells-2 (TREM2), which has been found to regulate Wnt signaling, plays a role in neuroprotection and impacts osteoclasts in bone where it functions as a negative regulator of bone resorption during normal bone remodeling processes [32]. Another pathway that connects brain and bone is the receptor activator of nuclear factor-κB (RANK) signaling network, which drives bone resorption [33]. Aβ can interfere with the RANK downstream signaling by enhancing RANKL-induced osteoclastic bone resorption by increasing nuclear factor kappa B (NF-κB) activity, degradation of the inhibitor of NF-κB (IκB) and increased nuclear factor of activated T-cells-cytoplasmic 1 (NFATc1) expression which stimulates osteoclast-specific genes [34], [35]. Furthermore, osteocalcin (OC) – a bone specific protein known to affect diverse physiological processes such as energy expenditure, glucose homeostasis and male fertility – crosses the blood-brain barrier where it binds to neurons of the brainstem, midbrain, and hippocampus, and influences the synthesis of several neurotransmitters [36]–[38].
Despite the many clinical studies linking AD and osteoporosis [24], [39], there is still a lack of understanding on the effects of AD on bone beyond bone density. To this end, we used the 5XFAD transgenic mouse model to understand the effects of AD on bone quality and determine the associations between the loss of bone and brain health. We used 5XFAD mice (B6SJL-Tg(APPSwFlLon,PSEN1*M146L*L286V) 6799Vas/Mmjax (5XFAD/ Tg6799)) overexpressing mutant human APP(695) with the Swedish (K670N, M671L), Florida (I716V), and London (V717I) familial Alzheimer’s disease (FAD) mutations along with human PS1 harboring two FAD mutations (M146L and L286V). This model was generated on a B6/SJL-hybrid background and was maintained by crossing transgenic mice back to B6SJLF1 hybrids each generation. This early-onset AD (EOAD) model exhibits a robust AD pathology such as rapidly accumulating Aβ42 in the brain, early amyloid deposition, and gliosis, robust intraneuronal Aβ labeling, neurodegeneration, and neuron loss [40], [41]. Early onset of AD in 5XFAD mice make this model ideal for studying co-morbidities such as bone health (that follow or lag AD) during the typical lifespan of an AD mouse.
Materials and Methods
Study design
Thirty-five-day old 5XFAD mice (MMRRC Stock No: 34840-JAX; https://www.jax.org/strain/006554), and wild-type littermate controls (N=10/group), optimally balanced for sex ratio within genotypes (50% Male/50% Female), were obtained from The Jackson Laboratory (Bar Harbor, ME) and transferred to Skidmore College where they were acclimated for 104 days. All mice were individually housed and provided with food (Prolab RMH 3000 Lab Diet pellets) and tap water were provided ad libitum and maintained under a controlled ambient temperature of 71 ± 2 °C and 12:12 LD schedule of indoor lighting (3500K fluorescent lamps, irradiance of approximately 70 μW.cm−2) and provided with a 2g cotton Nestlet (Ancare Corporation, Bellmore, NY USA). From age 139 days to euthanization at 12 months of age, Nestlets were removed and a 4.5-in.-diamter running wheel was provided to assay voluntary circadian locomotor activity [41]. All experimental procedures were approved by the Skidmore College Animal Care and Use Committee and conformed to international ethical standards.
Nesting behavior and body mass
Approximately 30 grams of quilting cotton (Quilters Dream Cotton, 100% Pure Cotton, Virginia Beach, VA) was placed on top of each cage in the food bin on the first day of measurement. On the final day, the remaining cotton weight was subtracted from the initial weight to find the total amount of cotton used creating a nesting score. A baseline score was measured at 19-weeks, with follow-up scores at 26-, 33-, 40-, and 47-weeks of age. At these time intervals, the body mass of each mouse was also collected. Nesting behavior was measured for four days on some intervals, and five days on others. Therefore, all data shown has been standardized to represent 4-day scores.
Aβ42 ELISA
As previously reported [41], cortical brain tissue was harvested post-euthanasia and prepared according to the protocol established for 5XFAD mice [42]. Here, we breakdown the data to analyze sex differences, which has not previously been reported. The methods for the assay have been explained [42], and in brief, the tissue was flash frozen and re-suspended in PBS-0.5% Triton supplemented with protease inhibitors (A32965 ThermoFisher, Waltham, MA). Tissue was homogenized with a Corning Dounce homogenizer (1234F35 Thomas Scientific, Swedesboro, NJ). Cleared homogenates were supplemented with guanidine hydrochloride to a final concentration of 5M to solubilize plaques and then diluted in Standard Diluent Buffer. Aβ42 levels were measured in duplicates by the Invitrogen Human Aβ42 ELISA kit (KHB3441, ThermoFisher, Waltham, MA) and normalized by total protein content (5000002, Bio-Rad, Hercules, CA).
Micro-computed tomography
All femora, previously stored in saline at −80°C, were scanned using a μCT scanner (VivaCT40, Scanco Medical AG, Basserdoft, Switzerland), following guidelines by Bouxsein et al. [43]. High-resolution scans were acquired at 70 kVp energy, 114 mA current, 301 ms integration time using a 10.5 mm voxel size. Bone mineral density was calculated with a hydroxyapatite (HA) phantom used for calibration, and global threshold for all scans was set for 656 mg HA/cm3 with a gaussian filtration (σ = 0.8, support = 1). Custom evaluation scripts with pre-defined volume of interest (VOI) were used to analyze the cortical and trabecular morphology of femora. Trabecular number, thickness and separation were calculated based on distance transformation, where 3D distances are estimated by fitting maximal spheres inside the structure or void space. Structural model index and trabecular bone fraction were calculated based on triangularization of surface (i.e., one more interpolation step in comparison to counting voxels.
Cortical morphology was evaluated from 30 slices morphed from a ~0.3 mm region at mid-diaphysis. Variables collected were periosteal diameter, endosteal diameter, cortical thickness (Ct.Th), moment of inertia (Ixx), and cortical bone mineral density (BMD). To perform trabecular analysis, the most distal slice in which the condyles meet was identified and used as a point of reference. The VOI for trabecular analysis at the distal metaphysis was defined by first locating the growth plate in the distal end of the femora. Manual contouring was started 5 slices from it for a ~0.5mm region with contours every 10 slices and a 5% reduction to ensure no cortical bone was included in the analyses. Variables of interest were: bone trabecular thickness (Tb.Th), trabecular number (Tb.N), trabecular separation (Tb.Sp), volume fraction (BV/TV), structural model index (SMI), and trabecular BMD. Structural model index is measured as an indicator of the structure of trabeculae to estimate the plate- versus rod-like characteristic of the trabecular bone structure. This index was designed to be 0 for perfect plates, 3 for perfect rods, where plates are considered to be mechanically superior to rods. Reconstruction images (2D, 3D) were collected and recorded.
Confocal Raman spectroscopy
Femora were sectioned from the mid-diaphysis using a slow speed diamond saw. After drying, specimens were embedded in epoxy (EpoHeat CLR Resin & Hardener, Buehler, Lake Bluff, IL). Embedded specimens were transversely cut to produce ~500 μm sections that were subsequently polished with carbide (320 grit, 800 grit), and diamond (3 um) papers to achieve a smooth finish. Raman analysis was performed using a confocal Raman spectroscopy system (WITec Alpha 300R; WITec, Ulm, Germany) equipped with a 532 nm green laser. Confocal spectroscopy was selected as it allows for the magnification to be adjusted and the signal can reach beyond the surface level of the epoxy resin into the bone tissue, whereas non-confocal spectroscopy can only reach surface level and thus would be limited if samples are embedded.
An objective lens of 20x was first used to differentiate the bone tissue from epoxy resin (Figure 1A). Single spectrum at each morphological quadrant (N=4/sample) were acquired with 4s of integration time and 20 accumulations. Objective was set to 100x, numerical aperture (na) 0.90, pinhole diameter was 50 μm, grating set to 600 g/cm, BLZ at 500 nm, with the spectral center at 2100 cm−1, and a spectral range of 400-3600cm−1. WITec software was used for cosmic ray reduction, Savitzky-Golay smoothing (2nd order polynomial, window size 21), and background subtraction which was performed from the spectra of the epoxy resin prior to peak analysis. All single spectra collected were individually processed, analyzed and then final peak values were averaged (Figure 1B). The full width at half maximum (FWHM) of the peaks of interest were analyzed using a custom MATLAB script (R2018b, MathWorks, Natick, MA), following published protocols [44], [45], [54]–[57], [46]–[53]. Peaks of interest were fitted using Gaussian functions.
Figure 1. Analysis of bone tissue by confocal Raman spectroscopy.
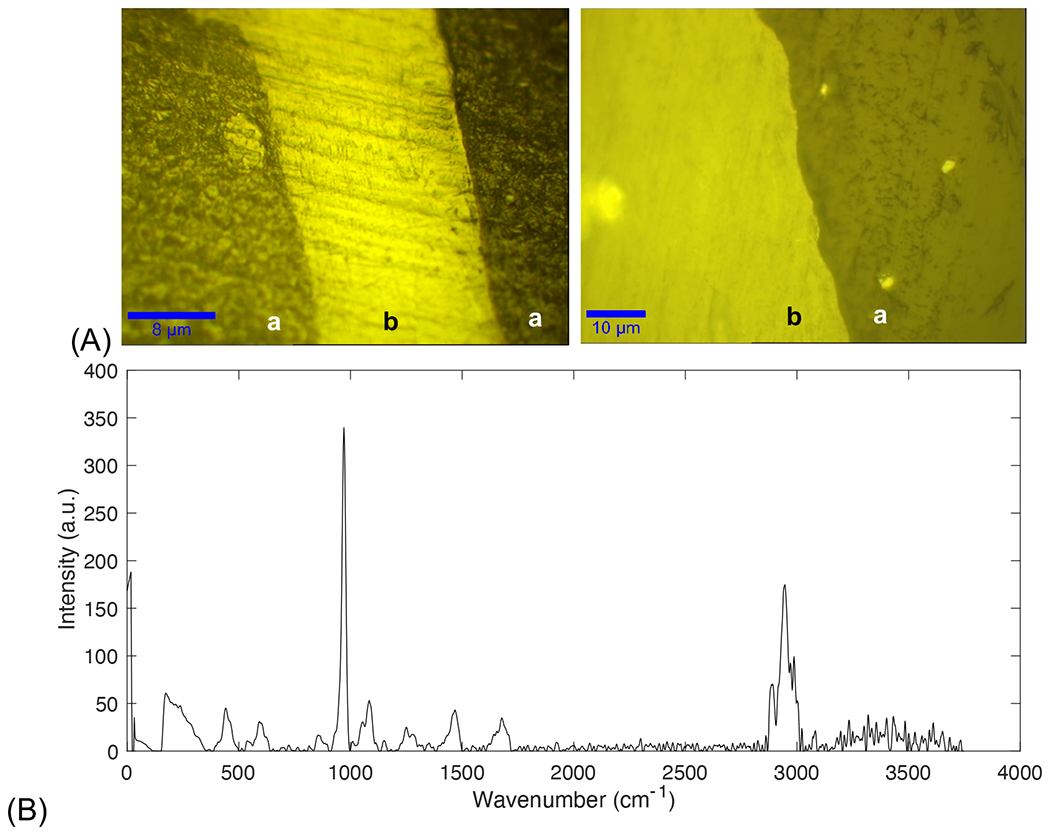
(A) Objective lens of 20x (left) was used to differentiate bone tissue (region marked ‘b’) from epoxy (region marked ‘a’) resin which was then confirmed at 100x (right). (B) Complete Raman spectrum collected from bone tissue.
Peak intensity of phosphate (ν1PO43−, ~960 cm−1; ν2PO43−, ~430 cm−1) [46], carbonate (ν1CO32−, ~1070 cm−1) [47], Amide I (~1670 cm−1) [48], Amide III (~1242 cm−1) [48], methylene wag (CH2-wag, 1450 cm−1) [49], pentosidine (PEN, 1495 cm−1) [50], and carboxymethyl-lysine (CML, 1150 cm−1) [50] were measured and then used to analyze intensities of bone matrix composites.
Crystallinity was measured from the inverse of the FWHM of the ν1PO43− peak [45], [46], [52]. The mineral-to-matrix ratio (MMR) was calculated using polarization-dependent and -independent peaks, as the relative ratio between the ν1PO4 and Amide I and ν2PO4 and Amide III intensity peaks, respectively [45], [54]. Level of Type-B carbonate substitution was measured as the ratio between the ~1070 cm−1 carbonate subpeak and (ν1) phosphate peaks [47], [53].
Glycation products, PEN and CML, were normalized to methylene [49], [50]. CML standard was purchased from Neta Scientific (MFCD04114278) and analyzed by confocal Raman spectroscopy to confirm the Raman marker band for CML (1150 cm−1) in bone [50], [55].
X-ray diffraction
Femora were dissected with equal number of left or right femora randomly selected for each group. Soft tissues were removed, and all specimens were cleaned. Femora were cut at the ends using a slow speed (150 rpm) diamond saw blade (Buehler Isomet 100, Lake Bluff, IL) and the shaft was washed free of blood. Dry specimens, i.e. the whole cortical shaft (200 mg), were then powdered using a mortar and pestle. X-ray diffraction (XRD) patterns were obtained using the Panalytical X’Pert Diffractometer (Malvern Panalytical, Malvern, United Kingdom) operated at 45 kV and 40 mA with Copper (Cu) Kα with wavelength λ = 1.5405980 Å. Diffractograms were taken from 20 to 55° in a 2θ scale with a 0.01° step size and 499 s step count. Diffractograms were then analyzed using the HighScore software (Malvern Panalytical, Malvern, United Kingdom), where background subtraction and smoothing was done prior to peak fitting (Figure 2). The diffraction peak of 002, related to the length of the c-axis, was analyzed. The d-spacing and full width half-maximum (FWHM) of the 002 peak was calculated, and the mineral crystal size was determined using the Scherrer equation, B = kλ/Lcosθ, as previously reported [58]–[61].
Figure 2. Analysis of bone powder by X-ray Diffraction.

(A) Raw peak intensities. (B) Baseline correction for XRD peak analysis. (C) Peak fitting of 002 peak.
Fluorescent advanced glycation end-products
Total fAGEs in bone samples were measured using protocols previously established [62]–[66]. A section of cortical bone tissue was cut from the mid-diaphysis of each femora sample, with equal number of left or right femora randomly selected for each group, after mechanical testing. Each sample of approximately 10 mg was washed free of blood with distilled water and subsequently defatted in several cycles of 100% isopropyl ether to remove any outside fat or muscle tissue. All samples were then lyophilized to remove excess liquid from each bone sample. Each bone sample was then placed in a glass vial and submerged with 6N HCl solution at a ratio of 50 μL per 1 mg of bone. These were incubated at 110° C for direct hydrolysis to expose the bone proteins and lipids within the matrix. Two hydrolysates out of each sample were made by diluting the samples with nanopore water. These were used in two separate assays: a quinine sulphate fluorescence assay, and a collagen content assay.
The first assay used a quinine stock (1 μg Quinine/mL 0.1 M H2SO4) which was diluted with sulfuric acid to create standard curve. Triplicates of each standard and sample hydrolysates were placed into the wells of a 96-microtiter plate. The fluorescence of each sample was measured using a spectrophotometer (Infinite 200, Tecan Trading AG, Switzerland) at 360 nm excitation and 460 nm emission.
The second part of the assay used a hydroxyproline stock (2000 μg L-hydroxyproline/mL 0.001 M HCl) diluted with nano-pure water to create a standard curve. Freshly made solutions of chloramine-T, 3.15 M perchloric acid, and p-dimethylaminobenzaldehyde (DMAB) were added to each standard and sample hydrolysate. After adding the chloramine-T solution, the samples were incubated at room temperature. Next, the 3.15 M perchloric acid solution was added, and the samples were incubated at room temperature. Finally, the DMAB solution was added, and the samples were incubated at 60°C. Triplicates of each standard and sample hydrolysate were placed in a 96-well plate. The absorbance of each sample was measured at 570 nm using the same spectrophotometer. The “in bulk” fAGEs content of each sample was then calculated as a unit of quinine fluorescence normalized by the collagen content (ng quinine/mg collagen).
Mechanical characterization
The contributions of AD to the biomechanical properties of bone were characterized using fracture mechanics-based tests for toughness. Fracture mechanics-based tests provide a measure of bone’s resistance to fracture due to a pre-existing flaw. Femora, with equal number of left or right femora randomly selected for each group, were prepared by first removing the femoral head and condyles and then forming a flaw, in the form of a controlled notch, at the mid-diaphyseal region on the anterior surface using a slow-speed diamond saw and sharpened using a razorblade. Three-dimensional reconstruction of the notch was performed using μCT images to measure the inner radius (Ri), outer radius (Ro), and notch angle with ImageJ, as the femora used for mechanical tests were the same as previously scanned with microCT. Samples were tested under wet conditions using an electromechanical testing system (EnduraTEC 3200, TA Instruments, New Castle, DE) at a ramp speed of 0.001mm/s with a span length of 6.5 mm. Load and displacement curves were recorded and using published equations [67], [68] we calculated initiation toughness (Kc, in; MPa√m) and maximum toughness (Kc, max; MPa√m). Initiation toughness defines the stress intensity at the initiation of fracture from the notch and the maximum toughness defines the stress intensity at maximum load during crack propagation (commonly referred to as crack growth resistance or propagation toughness).
Statistical analyses
Data presentation was generated using MATLAB R2020b (The MathWorks, Natick, MA). All data are displayed as boxplots with median and interquartile ranges with all data points scattered. The number next to each group in the legend indicates sample size (n). Statistical analyses were performed using R Project (https://www.rproject.org). Data were tested for normality using the Shapiro-Wilk test. In cases where data were slightly non-normal, we performed power transformations, such as the natural log, to normalize the distribution. Where data could not be normalized, non-parametric tests were used. Balanced data were tested for homoscedasticity using Bartlett’s test, while unbalanced data were tested using Fligner Killeen test which is a non-parametric test for homogeneity of group variances based on ranks. Normal data were tested with Two-Factor ANOVA with Replication (α < 0.05) to discern gender (male and female), genotype (WT and 5XFAD), and interactions (gender * genotype) effect. We report F-values, degrees of freedom (DF) – identified in parathesis following the F-statistic, and p-values. Partial eta squared (ηp2) values are reported for interpretation of the effect sizes, where ηp2 closer to 0 represent a small effect, ηp2 closer to 1 represent a large effect. Residuals were plotted for normality (Q-Q plots) and homoscedasticity (residuals vs. fitted) checks. None of our data violated these assumptions. Tukey’s honestly significant difference (HSD) test (95% CI) was used for post hoc tests in multiple comparisons of means. Non-normal data were tested with Kruskal–Wallis (α < 0.05) test by ranks to discern gender (male and female), and genotype (WT and 5XFAD) effects. Dunn’s test (95% CI) was used for post hoc tests in pairwise multiple comparisons procedure based on rank sums. We report chi-squared (χ2) values, degrees of freedom (DF) – identified in parathesis following the chi-squared value, and p-values. The chi-square (χ2) value is a measure of the difference between the observed and expected frequencies of the outcomes of a set of events or variable, wherein bigger values represent larger differences. Whole-bone mechanical properties, morphology, and BMD results were adjusted for body mass using a linear regression method as specified for bone biomechanics [69]. Pearson’s R (α < 0.05) and Spearman’s ρ (α < 0.05) were used to determined coefficient of correlation between balanced and non-balanced variables, where we report the coefficient of correlation (r or ρ), the degrees of freedom - identified in parathesis following the coefficient of correlation, the sample size, and the test statistic (t or S). Significant codes: p < 0.05 ‘*’, p < 0.01 ‘**’, p < 0.001 ‘***’. G*Power (Version 3.1.9.6) was used to compute the achieved power post hoc given α, sample size, and effect size where we confirmed power > 80%.
Results
5XFAD mice displayed progressive weight loss
Body mass measurements were recorded at baseline (19-weeks) and at the point of study culmination (47-weeks). At baseline (Figure 3A), we observed a significant effect of gender on body mass (χ2(1) = 14.296, p = 0.0001562, ηp2 = 0.87). Post hoc tests revealed male mice had significantly greater body mass within wild-type (p = 0.0479) and 5XFAD groups (p = 0.0008) when compared to female mice. No genotype (χ2(1) = 0.20587, p = 0.65, ηp2 = 0.03) effects were present.
Figure 3. 5XFAD mice displayed a progressive weight loss.

5XFAD mice showed a 1.81% decrease in body mass at baseline (A) that by 47-weeks (B) had augmented to a 15.28% decrease. Results are shown as boxplots (with median and interquartile range) showing all data points. Statistically significant differences were determined by Kruskal–Wallis (α < 0.05) test by ranks to discern gender, and genotype effects, with Dunn’s test (95% CI) as post hoc tests in pairwise multiple comparisons procedure based on rank sums; or by Two-Factor ANOVA with Replication (α < 0.05) to discern gender, genotype, and interactions effect, with Tukey’s HSD test (95% CI) as post hoc tests in multiple comparisons of means. Significant codes: p < 0.05 ‘*’, p < 0.01 ‘**’, p < 0.001 ‘***’.
By 47-weeks (Figure 3B), we observed a significant effect of genotype (F1,16 = 9.49, p = 0.00715, ηp2 = 0.37) with 5XFAD exhibiting body mass loss compared to wild-type controls. Female 5XFAD mice showed a 18.75% decrease in mean body mass compared to WT female mice, while male 5XFAD mice showed a 12.86% decrease compared to their WT counterparts. However, post hoc tests did not show individual genotype differences between males (p = 0.177) or females (p = 0.165). Further, the significant effect of gender on body mass (F1,16 = 51.42, p = 2.22e-06, ηp2 = 0.76) remained, wherein male mice showed significantly greater body mass compared to female mice. Post hoc tests confirmed gender effects with male mice showing significantly higher body mass within wild-type groups (p = 6.18e-04) and 5XFAD groups (p = 5.69e-04). No interaction effects were present (F1,16 = 0.001, p = 0.976).
Overall, all 5XFAD mice showed a 1.81% decrease in body mass at baseline that by 47-weeks had augmented to a 15.28% decrease in body mass pertaining to genotype, a common feature of AD progression [8], [70], [71].
5XFAD mice exhibited decline in nesting abilities
Nesting behavior was quantified by the amount of cotton used per each mouse over the course of four days, measured at baseline (19-weeks) and at the point of study culmination (47-weeks). Cotton usage showed large disparities as WT mice used large quantities of cotton whereas 5XFAD mice’s usage continuously dropped to none or very little towards the end of the study (Figure 4A).
Figure 4. 5XFAD mice exhibited decline in nesting abilities.

(A) Example of near perfect nest building compared to an unidentifiable nest. AD progression significantly reduced the ability of 5XFAD mice to build nests exhibiting a decline from baseline (B) to the end of the study (C). Despite gender not being a significant factor in these changes, we did observe greater effect sizes within the female groups. Results are shown as boxplots (with median and interquartile range) showing all data points. Statistically significant differences were determined by Kruskal–Wallis (α < 0.05) test by ranks to discern gender, and genotype effects, with Dunn’s test (95% CI) as post hoc tests in pairwise multiple comparisons procedure based on rank sums. Significant codes: p < 0.05 ‘*’, p < 0.01 ‘**’, p < 0.001 ‘***’.
Baseline measurements (Figure 4B) showed a significant effect of genotype on nesting behavior (χ2(1) = 7.43, p = 0.0064, ηp2 = 0.42), wherein 5XFAD mice showed a significant decline on cotton usage, regardless of gender. No gender (χ2(1) = 1.96, p = 0.161, ηp2 = 0.17) effects were present. Post hoc tests confirmed genotype effects with 5XFAD female mice showing lower cotton usage compared to wild-type female mice (p = 0.0198). However, 5XFAD/Male compared to WT/Male did not show the same genotype effects (p = 0.127).
At 47-weeks (Figure 4C), there was an increased significant effect of genotype on nesting behavior (χ2(1) = 14.383, p = 1.49e-04, ηp2 = 0.64), wherein 5XFAD mice showed a significant decline on cotton usage, regardless of gender. No gender (χ2(1) = 0.899, p = 0.3431, ηρ2 = 0.03) effects were present. Post hoc tests confirmed genotype effects within female groups (p = 0.0017), and male groups (p = 0.026). As expected, the onset of AD progression significantly reduced the ability of 5XFAD mice to build nests. Despite gender not being a significant factor in these changes, we did observe greater effect sizes within the female groups.
Elevated levels of Aβ42 in 5XFAD mice
Amyloid-βeta levels (Figure 5) showed genotype effects (χ2(1) = 16.31, p = 5.381e-05, ηp2 = 0.78), wherein 5XFAD mice showed a significant increase compared to WT mice, regardless of gender. No gender (χ2(1) = 0.0408, p = 0.84, ηp2 = 0.03) effects were present. Post hoc tests confirmed genotype effects within female groups (p = 0.0027), and male groups (p = 0.0067).
Figure 5. Elevated levels of Aβ42 in 5XFAD mice.

5XFAD mice showed a significant increase in Aβ42 levels compared to WT mice, regardless of gender. Results are shown as boxplots (with median and interquartile range) showing all data points. Statistically significant differences were determined by Kruskal–Wallis (α < 0.05) test by ranks to discern gender, and genotype effects, with Dunn’s test (95% CI) as post hoc tests in pairwise multiple comparisons procedure based on rank sums. Significant codes: p < 0.05 ‘*’, p < 0.01 ‘**’, p < 0.001 ‘***’.
5XFAD mice showed altered bone structure
Cortical and trabecular morphology of femora samples (Table 1) were analyzed with micro-computed topography at the mid-diaphysis and distal metaphysis, respectively. We observed a significant effect of genotype on the endosteal diameter (F1,16 = 5.23, p = 0.0362, ηp2 = 0.25), wherein 5XFAD mice showed significantly greater inner surface expansion compared to wild-type controls demonstrating an increase in bone loss (Table 1). No gender (F1,16 = 0.920, p = 0.352, ηp2 = 0.05) or interaction effects were present (F1,16 = 0.038, p = 0.848).
Table 1.
Femoral cortical and trabecular morphology assessed by μCT imaging.
| Index | WT/Male | AD/Male | WT/Female | AD/Female |
|---|---|---|---|---|
| Cortical | ||||
| End. Dia (mm) a | 1.1554 ± 0.1473 | 1.2599 ± 0.0915 | 1.0978 ± 0.1099 | 1.2217 ± 0.0878 |
| Per. Dia (mm) | 1.6089 ± 0.2333 | 1.7235 ± 0.1050 | 1.6326 ± 0.1317 | 1.6869 ± 0.1073 |
| Ct. Th (mm) | 0.2268 ± 0.0484 | 0.2318 ± 0.0136 | 0.2674 ± 0.0213 | 0.2326 ± 0.0167 |
| Ixx (mm∧4) | 0.2439 ± 0.0680 | 0.2097 ± 0.0712 | 0.2034 ± 0.0836 | 0.1905 ± 0.0432 |
| BMD (mg HA/ccm) b, c, d | 617.7 ± 32.4 | 622.7 ± 7.9 | 739.0 ± 27.2 | 647.5 ± 46.7 |
| Trabecular | ||||
| Tb. N (1/mm) | 4.6943 ± 0.2064 | 5.1067 ± 0.6002 | 5.1027 ± 0.3879 | 4.2433 ± 1.1034 |
| Tb. Th (mm) | 0.0685 ± 0.0100 | 0.0669 ± 0.0124 | 0.0683 ± 0.0217 | 0.0754 ± 0.0182 |
| Tb. Sp (mm) | 0.1448 ± 0.0121 | 0.1311 ± 0.0310 | 0.1286 ± 0.0300 | 0.1771 ± 0.0778 |
| SMI b | 0.4976 ± 0.5097 | 0.3075 ± 0.4942 | 1.0216 ± 0.5502 | 0.6755 ± 0.0876 |
| BV/TV (%) | 0.3212 ± 0.0455 | 0.3446 ± 0.0941 | 0.3503 ± 0.1217 | 0.3136 ± 0.0972 |
| BMD (mg HA/ccm) | 437.5 ± 53.8 | 420.9 ± 53.8 | 448.4 ± 131.8 | 426.8 ± 101.2 |
Results are shown as mean ± STD. End. Dia = endosteal diameter; Per. Dia = periosteal diameter; Ct. Th = cortical thickness; Ixx = moment of inertia; BMD = bone mineral density; Tb. N = trabecular number; Tb. Th = trabecular thickness; Tb. Sp = trabecular separation; SMI = structural model index; BV/TV = bone volume to total volume. Statistically significant differences were determined by Two-Factor ANOVA with Replication (α < 0.05) to discern gender, genotype, and interactions effect, with Tukey’s HSD test (95% CI) as post hoc tests in multiple comparisons of means; or by Kruskal–Wallis (α < 0.05) test by ranks to discern gender, and genotype effects, with Dunn’s test (95% CI) as post hoc tests in pairwise multiple comparisons procedure based on rank sums. Bold indicates statistically significant variable.
Genotype effects.
Sex effects.
Significant differences between 5XFAD and WT mice.
Significant differences between male and female mice. N=20 (5/group; 50% Male/50% Female).
We observed no changes in the outer surface (Table 1) as there was not a significant effect of genotype (F1,16 = 1.512, p = 0.237, ηp2 = 0.09), or gender (F1,16 = 0.009, p = 0.926, ηp2 = 5.45e-04) on the periosteal diameter. Despite changes in the inner surface diameter, there were no significant changes in cortical thickness or moment of inertia with genotype or gender.
Bone density, measured by cortical BMD (Table 1), did not show genotype (χ2(1) = 2.0629, p = 0.1509, ηp2 = 0.03) effects. However, cortical BMD did show a significant effect of gender (χ2(1) = 5.8514, p = 0.01556, ηp2 = 0.31), wherein post hoc tests revealed female 5XFAD mice had a significant loss of BMD as they were differences between 5XFAD/Female and WT/Female (p = 0.0284). Within WT groups, female mice also showed a reduction in BMD compared to WT/Male mice (p = 0.0039).
Trabecular bone did not show changes in terms of trabecular number, trabecular thickness, trabecular separation, BV/TV, or trabecular BMD with gender or genotype (Table 1). However, we observed a significant gender effect on SMI (F1,16 = 4.885, p = 0.042, ηp2 = 0.23). There was no genotype (F1,16 = 1.765, p = 0.203, ηp2 = 0.10) or interaction effect (F1,16 = 0.149, p = 0.704). Post hoc tests did not detect any individual differences.
Diminished mineral crystal size and lattice d-spacing in 5XFAD mice
XRD was used to evaluate the mineral properties of cortical bone. The FWHM of peak 002 was used to calculate the mean crystal size. There was a significant genotype effect (F1,16 = 16.203, p = 0.000978, ηp2 = 0.48), wherein 5XFAD mice showed decreased mineral crystal size, regardless of gender (Figure 6A). Post hoc tests confirmed genotype effects within female groups (p = 0.01065) but not within male groups (p = 0.2106). No gender effect (F1,16 = 0.005, p = 0.9429, ηp2 = 3.06e-04) or interaction effects (F1,16 = 1.260, p = 0.2782) were present.
Figure 6. Diminished mineral crystal size and lattice d-spacing in 5XFAD mice.

The FWHM of peak 002 was used to calculate the mean crystal size (A) and d-spacing (B) of the mineral crystal lattice. Results are shown as boxplots (with median and interquartile range) showing all data points. Statistically significant differences were determined by Two-Factor ANOVA with Replication (α < 0.05) to discern gender, genotype, and interactions effect, with Tukey’s HSD test (95% CI) as post hoc tests in multiple comparisons of means; or by Kruskal–Wallis (α < 0.05) test by ranks to discern gender, and genotype effects, with Dunn’s test (95% CI) as post hoc tests in pairwise multiple comparisons procedure based on rank sums. Significant codes: p < 0.05 ‘*’, p < 0.01 ‘**’, p < 0.001 ‘***’.
The interplanar spacing, or simply d-spacing, of the mineral crystal lattice (Figure 6B) was significantly reduced in 5XFAD mice when compared to the WT groups (χ2(1) = 7, p = 0.008151, ηp2 = 0.47). Post hoc tests confirmed genotype effects within female groups (p = 0.0422) but not within male groups (p = 0.0872). There was no gender (χ2(1) = 0.46286, p = 0.4963, ηp2 = 0.03) effects present with crystal lattice d-spacing. Taken together, 5XFAD groups demonstrated the poorer crystalline lattice compared to WT groups.
Loss of bone quality and diminished mineralization in 5XFAD mice
Confocal Raman spectroscopy was used to measure mineral matrix characteristics of femoral cortical bone sections, in terms of crystallinity, type B carbonate substitutions, and mineral-to-matrix ratio (Figure 7).
Figure 7. Loss of bone quality and diminished mineralization in 5XFAD mice.

(A) Crystallinity (1/ν1PO43−). (B) B-type carbonate substitutions (ν1CO32−/ν1PO43−). (C) Mineral-to-matrix ratio (ν1PO43−/Amide I). (D) Mineral-to-matrix ratio (ν2PO43−/Amide III). Results are shown as boxplots (with median and interquartile range) showing all data points. Statistically significant differences were determined by Two-Factor ANOVA with Replication (α < 0.05) to discern gender, genotype, and interactions effect, with Tukey’s HSD test (95% CI) as post hoc tests in multiple comparisons of means; or by Kruskal–Wallis (α < 0.05) test by ranks to discern gender, and genotype effects, with Dunn’s test (95% CI) as post hoc tests in pairwise multiple comparisons procedure based on rank sums. Significant codes: p < 0.05 ‘*’, p < 0.01 ‘**’, p < 0.001 ‘***’.
Crystallinity (Figure 7A) showed genotype effects (F1,16 = 27.762, p = 7.64e-05, ηp2 = 0.62) wherein 5XFAD mice displayed a significant reduction compared to WT mice. No gender (F1,16 = 1.846, p = 0.193, ηp2 = 0.10) or interaction effects (F1,16 = 1.238, p = 0.282) were present. Post hoc tests confirmed genotype effects within female groups (p = 0.001809) and within male groups (p = 0.04304).
Carbonate-to-phosphate ratio (Figure 7B) showed genotype effects (F1,16 = 13.950, p = 0.0018, ηp2 = 0.46) wherein 5XFAD mice displayed a significant reduction compared to WT mice. No gender (F1,16 = 1.741, p = 0.2055, ηp2 = 0.10) or interaction effects (F1,16 = 0.281, p = 0.6031) were present. Post hoc tests confirmed genotype effects within female groups (p = 0.03703) but not within male groups (p = 0.148).
We observed a significantly lower levels of mineralization in 5XFAD mice, as measured by the mineral-to-matrix ratio (MMR) calculated using polarization-dependent (ν1PO43−/Amide I) and -independent peaks (ν2PO43−/Amide III). MMR1 (Figure 7C) showed significant genotype effects (F1,16 = 26.593, p = 9.55e-05, ηp2 = 0.61) wherein 5XFAD mice displayed a significant loss of mineralization compared to WT mice. Post hoc tests confirmed genotype effects within female groups (p = 0.002856) and within male groups (p = 0.0378). No gender (F1,16 = 0.973, p = 0.339, ηp2 = 0.05) or interaction effects (F1,16 = 0.821, p = 0.378) were present. MMR2 (Figure 7D) showed significant genotype effects (χ2(1) = 12.623, p = 0.000381, ηp2 = 0.58) wherein 5XFAD mice displayed a significant reduction of mineralization compared to WT mice. Post hoc tests confirmed genotype effects within male groups (p = 0.0011) but not within female groups (p = 0.0777). No gender (χ2(1) = 0.07, p = 0.978, ηp2 = 0.05) effects were present.
5XFAD mice showed accumulation of glycoxidation products
Confocal Raman spectroscopy was used to measure organic matrix characteristics of femoral cortical bone sections, in terms of glycoxidation products, such as carboxymethyl-lysine (CML) and pentosidine (PEN) (Figure 8).
Figure 8. 5XFAD mice showed accumulation of glycoxidation products.

(A) Carboxymethyl-lysine (I1150/CH2-wag). (B) Pentosidine (I1495/ CH2-wag). Results are shown as boxplots (with median and interquartile range) showing all data points. Statistically significant differences were determined by Two-Factor ANOVA with Replication (α < 0.05) to discern gender, genotype, and interactions effect, with Tukey’s HSD test (95% CI) as post hoc tests in multiple comparisons of means. Significant codes: p < 0.05 ‘*’, p < 0.01 ‘**’, p < 0.001 ‘***’.
CML (Figure 8A) showed significant genotype effects (F1,16 = 86.430, p = 7.5e-08, ηp2 = 0.84) where in 5XFAD groups had significantly greater accumulation of CML compared to WT groups. Post hoc tests confirmed genotype effects within male groups (p = 0.0000688) and within female groups (p = 0.0000177). Gender effects (F1,16 = 5.642, p = 0.0304, ηp2 = 0.26) were present but post hoc tests did not show individual differences between male and female groups. No interaction effects (F1,16 = 0.285, p = 0.6009) were present. PEN (Figure 8B) showed significant genotype effects (F1,16 = 31.334, p = 4.01e-05, ηp2 = 0.65) where in 5XFAD groups had significantly greater accumulation of PEN compared to WT groups. Post hoc tests confirmed genotype effects within male groups (p = 0.001247) and within female groups (p = 0.02484). No gender (F1,16 = 1.262, p = 0.278, ηp2 = 0.07) or interaction effects (F1,16 = 1.093, p = 0.311) were present.
5XFAD mice showed greater accumulation of fAGEs
Total fluorescent advanced glycation end-products (fAGEs) data (Figure 9) showed genotype effects (χ2(1) = 14.286, p = 0.0001571, ηp2 = 0.88), wherein 5XFAD mice showed greater accumulation of fAGEs compared to WT mice. Post hoc tests confirmed genotype effects within female groups (p = 0.0027), and male groups (p = 0.0067). No gender effects were present (χ2(1) = 0.02286, p = 0.8798, ηp2 = 5.14e-03).
Figure 9. 5XFAD mice showed greater accumulation of fAGEs.

Results are shown as boxplots (with median and interquartile range) showing all data points. Statistically significant differences were determined by Kruskal–Wallis (α < 0.05) test by ranks to discern gender, and genotype effects, with Dunn’s test (95% CI) as post hoc tests in pairwise multiple comparisons procedure based on rank sums. Significant codes: p < 0.05 ‘*’, p < 0.01 ‘**’, p < 0.001 ‘***’.
Loss of bone toughness in 5XFAD mice
Bone toughness was measured by subjecting femora to three-point bending (Figure 10A). We observed significant genotype effects (F1,16 = 92.680, p = 4.65e-08, ηp2 = 0.84) in initiation toughness (Figure 10B) wherein 5XFAD groups showed loss of toughness compared to WT groups. Post hoc tests confirmed genotype effects within female groups (p = 0.0000067) and within male groups (p = 0.0000829). No gender (F1,16 = 1.806, p = 0.198, ηp2 = 0.10) or interaction effects (F1,16 = 1.013, p = 0.329) were present. We observed significant genotype effects (χ2(1) = 8.2514, p = 0.004072, ηp2 = 0.45) in maximum toughness (Figure 10C) wherein 5XFAD groups showed loss of toughness compared to WT groups. Post hoc tests confirmed genotype effects within female groups (p = 0.0120) but not within male groups (p = 0.1211). No gender (χ2(1) = 1.8514, p = 0.1736, ηp2 = 0.08) effects were present.
Figure 10. Loss of bone toughness in 5XFAD mice.

(A) Bone toughness was measured by subjecting femora to three-point bending. (B) Initiation toughness. (C) Maximum toughness. Results are shown as boxplots (with median and interquartile range) showing all data points. Statistically significant differences were determined by Two-Factor ANOVA with Replication (α < 0.05) to discern gender, genotype, and interactions effect, with Tukey’s HSD test (95% CI) as post hoc tests in multiple comparisons of means; or by Kruskal–Wallis (α < 0.05) test by ranks to discern gender, and genotype effects, with Dunn’s test (95% CI) as post hoc tests in pairwise multiple comparisons procedure based on rank sums. Significant codes: p < 0.05 ‘*’, p < 0.01 ‘**’, p < 0.001 ‘***’.
Associations between measures of bone health and Alzheimer’s disease
Skeletal fragility is a severe comorbidity of AD with patients exhibiting an increased risk for fracture [21], [22], reduced BMD [23]–[25], and higher chance for osteoporosis [26]. Interestingly, Aβ can interfere with the RANK downstream signaling [34] and stimulate osteoclast-specific genes [35]. Therefore, we evaluated the association of Aβ42 levels with bone structural and compositional measures, and in turn, their effect on bone toughness (Table 2).
Table 2.
Correlation between selected structural, biomechanical, and compositional measures.
| Crystallinity | CO32−/PO43− | MMR | Crystal Size | CML | PEN | fAGEs | Kc, in | Kc, max | |
|---|---|---|---|---|---|---|---|---|---|
|
|
|||||||||
| Aβ | ρ = −0.65 (0.001858) | ρ = 0.56 (0.01024) | ρ = −0.77 (6.86E-05) | ρ = −0.68 (0.000872) | ρ = 0.82 (8.82E-06) | ρ = 0.87 (7.64E-07) | ρ = 0.87 (7.64E-07) | ρ = −0.78 (4.42E-05) | ρ = −0.59 (0.006125) |
| Crystallinity | 1 | r = −0.54 (0.01306) | r = 0.64 (0.00235) | r = 0.51 (0.02183) | r = −0.73 (0.000229) | r = −0.49 (0.02724) | ρ = −0.60 (0.00656) | r = 0.63 (0.00302) | ρ = 0.34 (0.141) |
| CO32−/PO43− | 1 | r = −0.42 (0.0686) | r = −0.41 (0.0697) | r = 0.61 (0.00415) | r = 0.24 (0.3149) | ρ = 0.72 (0.0005407) | r = −0.60 (0.005297) | ρ = −0.45 (0.04901) | |
| MMR | 1 | r = 0.67 (0.001101) | r = −0.70 (0.00057) | r = −0.71 (0.000445) | ρ = −0.58 (0.007973) | r = 0.68 (0.000868) | ρ = 0.35 (0.1268) | ||
| Crystal Size | 1 | r = −0.72 (0.000372) | r = −0.60 (0.00553) | ρ = −0.63 (0.003486) | r = 0.69 (0.000727) | ρ = 0.30 (0.1925) | |||
| CML | 1 | r = 0.65 (0.001961) | ρ = 0.72 (0.0005199) | r = −0.81 (1.4E-05) | ρ = −0.49 (0.0309) | ||||
| PEN | 1 | ρ = 0.75 (0.0002206) | r = −0.68 (0.000894) | ρ = −0.54 (0.01538) | |||||
| fAGEs | 1 | ρ = −0.78 (5.908e-05) | ρ = −0.53 (0.01673) | ||||||
| Kc, in | 1 | ρ = 0.76 (0.0001732) | |||||||
|
|
|||||||||
Coefficient of correlation determined by Pearson’s R or Spearman’s ρ for parametric or non-parametric, respectfully. Results are shown as correlation value (p-value). All groups were combined with N=20 (5/group; 50% Male/50% Female). Bold indicates statistically significant variable. Aβ = amyloid-βeta levels; CO32− = carbonate; PO43− = phosphate; MMR = mineral-to-matrix ratio; CML = carboxymethyl-lysine; PEN = pentosidine; fAGEs = fluorescent advanced glycation end-products; Kc, in = initiation toughness; Kc, max = maximum toughness.
We observed a negative correlation between Aβ42 levels and loss of mineralization (ρ(18) = −0.77, n = 20, p = 6.86E-05, S = 2355.7). Furthermore, higher levels of Aβ42 also correlated with loss of crystallinity (ρ(18) = −0.65, n = 20, p = 0.001858, S = 2196.5), decreased mineral crystal size (ρ(18) = −0.68, n = 20, p = 0.000872, S = 2240.3), and higher levels of type B carbonate substitutions (ρ(18) = 0.56, n = 20, p = 0.01024, S = 585.28).
An increase in Aβ42 levels was correlated with increased accumulation of glycoxidation products, CML (ρ(18) = 0.82, n = 20, p = 8.82e-06, S = 236.95) and PEN (ρ(18) = 0.86, n = 20, p = 7.64e-07, S = 177.12), and glycation products, fAGEs (ρ(18) = 0.87, n = 20, p = 7.64E-07, S = 177.12).
Taken together, the increase in Aβ42 levels was correlated with loss of mineral quantity (mineralization) and diminished matrix quality (loss of crystallinity, higher accumulation of glycoxidation and glycation products). These measures, in turn, combine to affect bone mechanical properties as seen by the loss of toughness. Moreover, higher Aβ42 levels negatively correlated with loss of initiation toughness (ρ(18) = −0.78, n = 20, p = 4.42E-05, S = 2371.8) and maximum toughness (p(18) = −0.59, n = 20, p = 0.006125, S = 2115.3))
Discussion
While recent evidence showed loss of BMD with Alzheimer’s disease, this is the first study to demonstrate the effects of the AD phenotype on bone quality and link changes in bone and amyloid formation in the brain using the 5XFAD transgenic mouse model.
The 5XFAD transgenic mouse model has been extensively characterized in terms of AD pathology [40], [42], and here we confirmed AD status with 5XFAD mice showing accumulation of Aβ42 peptides and also exhibited a progressive decline in nesting abilities, regardless of gender. The nesting ability of mice was quantified as an indicator of mouse health [72]–[74]. Diminished nesting behavior has been demonstrated for other transgenic mouse models [73] but had not previously been documented for 5XFAD mice.
Metabolic markers of AD were not measured in this study but these have been previously reported for the model investigated here [8], [75]. For example, studies have shown that 5XFAD mice and other AD mice demonstrate a lean phenotype (i.e., weight loss, rise in metabolic rate, less white adipose tissue, lower leptin expression) and exhibit lower body weight compared to WT mice [8], [70], [71]. Similarly to this result, we observed a genotype effect with 5XFAD mice displaying reduced body mass compared to WT mice at 47 weeks of age. Of note, we included running wheels inside each mouse cage. While exercise might have mitigated or confounded these effects [76], there were no significant differences in the average running wheel activity levels (wheel revolutions per ten/min interval) between WT and 5XFAD mice. However, AD progression significantly diminishes motor control [77] which might have altered bone morphology.
Interestingly, the 5XFAD transgene construct [42] uses a modified Thy1 gene promoter that is designed for brain-specific expression [78]. However, the Thy1 gene downstream pathway can directly affect the Wnt signaling pathway which is responsible for bone formation [79]. Moreover, Aβ can interfere with the RANK downstream signaling [34] and stimulate osteoclast-specific genes [35]. In partial agreement with this observation, we found that bone structural properties in 5XFAD mice had a significant increase in inner surface expansion, while the outer surface remained unchanged. However, such changes were only seen in cortical, which demonstrated loss of BMD in a gender dependent manner, and not in distal trabecular femoral bone, as similarly reported in other AD mouse models [80], [81].
We evaluated surface level organic properties using confocal Raman spectroscopy, which uses frequency shifts corresponding to collagen and mineral characteristics of the bone matrix [40]–[53]. Glycoxidation products, such as carboxymethyl-lysine and pentosidine, are commonly seen to increase with higher levels of oxidation and glycation [82]–[85]. Although we did not measure inflammatory markers here, 5XFAD mice have been shown to have elevated oxidative stress and inflammation [8]. Furthermore, oxidative stress and systemic inflammation has been linked to formation of AGEs, and amyloid-beta [16], [86]. 5XFAD mice showed a significant increase in CML and PEN compared to WT mice. In addition, we observed a significant increase in total fAGEs, measured biochemically, in 5XFAD mice which could have impacted the plasticity potential of bone elevating the risk for fragility fractures.
When investigating bone toughness, we observed significant loss of initiation and maximum toughness in 5XFAD mice. Loss of toughness was significantly correlated with accumulation of all AGEs measured (i.e., CML, PEN, fAGEs), in line with several studies that have demonstrated AGE formation can reduce bone turnover and resistance to fracture [62]–[66]. In particular, the increased levels of AGEs have been found to cause a disruption in the alignment of the collagen fibril bundles consecutively reducing the amount of d-spacing available in the crystal lattice and thus leading to fragility fractures as energy dissipation is diminished [87]. We observed this in our study wherein XRD results from 5XFAD mice bones showed a reduction in d-spacing and mineral crystal size, which correlated to loss of toughness.
We also evaluated surface level mineral compositional properties using confocal Raman spectroscopy. In concert with our XRD results, we observed a significant reduction of crystallinity in 5XFAD mice compared to WT groups. This loss of crystallinity is an indicator of a less perfect and more amorphous crystalline structure, which correlates to increased brittleness [45], [52]. It has been shown that Aβ can drive bone resorption by stimulating osteoclastic-specific genes [35], and consistent with this, we observed the presence of less mineralized bone tissue in 5xFAD mice bones, possibly due new bone formation following enhanced resorption [53], [54]. Furthermore, 5XFAD mice showed an increase in the carbonate-to-phosphate ratio, a measure of B-type carbonate substitutions, which is associated with a distortion of the atomic arrangement in the crystal lattice [47], [88], [89]. Overall, the mineral matrix of 5XFAD mice was shown to be highly affected in terms of quantity and quality (i.e., perfection, maturity, length).
We observed that CML and mineralization (as determined by the mineral-to-matrix ratio) correlated with initiation toughness. CML has been reported to have the ability of impacting the mineral phase of bone [82], [83], [90] and has been correlated with impaired mineralization [85]. In fact, it has been suggested that CML can attract positively charged calcium ions and cause increased mineralization, providing a link between the mineral and organic matrix of bone and subsequently minimize microdamage formation, energy dissipation and fracture toughness [91], [92]. Meanwhile, crystal size (as determined by XRD) and PEN correlated with maximum toughness. The effect of PEN in the post-yield properties was expected considering that PEN has been correlated to the stiffening of the organic matrix [84]. Increased levels of AGEs have been found to impact the crystal lattice by disrupting the alignment of the collagen fibril bundles [61], [85].
Observational studies linking AD and osteoporosis are be confounded by aging as most of the skeletal symptoms seen with AD progression are also associated with advanced age in general [93]. Moreover, hormonal changes that occur with menopause may lead to osteoporosis [94], making it increasingly difficult to distinguish the singular effects of AD on skeletal development. Hyperglycemia and sleep disorders are common comorbidities with AD wherein these can increase oxidative stress and mitochondrial dysfunction which are linked to impaired glycemic control accelerating the neurodegeneration cascade [4], [5], [7]. Moreover, both these processes can lead to an increase of AGE formation, identified in both brain and bone tissue, and lead to cognitive decline and skeletal fragility [15], [18].
Interestingly, we observed that accumulation of amyloidosis correlated with an increase in CML, PEN and total fAGEs, suggesting a mechanistic link between elevated Aβ42 levels in the brain and AGE accumulation in bone. As discussed above, the neurodegeneration cascade of AD has been shown to increase chronic inflammation and oxidative stress [5], [12], [13]. This increased stress on the brain tissue triggers the formation of AGEs [14], [15], while damaging the endothelial lining of the blood-brain barrier allowing for systemic accumulation of AGEs [13]. Presently, CML can be readily measured in blood serum [95] while PEN is commonly quantified through urine [96]. While the causal relationship between AGE markers in bone and Aβ42 levels in brain must be further elucidated, we propose this association might provide clinically relevant. For example, the use of custom-built probe-based Raman spectroscopy has been validated as a non-invasive method for measuring bone compositional properties [97], [98]. While it has yet to be implemented clinically, its ability to measure AGEs in bone and relationships between AGEs in bone and Aβ42 levels in brain, demonstrated here, could be harnessed for diagnosis of bone health and for estimating amyloid load in AD. Alternatively, serum levels of AGEs are correlated to AGEs in bone [99] and can be evaluated for correlation against in Aβ42 levels in brain. Of note, AGEs have been shown to increase with aging thus this could present as a potential confounding factor.
In summary, our findings highlight the two major pathways to skeletal fragility in AD through alteration of bone quality: (1) accumulation of AGEs in the organic matrix; and (2) loss of crystallinity, decreased crystal size and loss of mineralization. The matrix changes we observed here occurred in concert with loss of fracture properties and they explained the increased skeletal fragility seen with AD, as determined by stepwise linear regression. While the specific mechanistic interplay behind bone-brain interactions requires further investigation, we provide a conceptual framework that can ultimately contribute to the development of clinical solutions to reduce AD-associated skeletal fragility. Considering the growing epidemic of Alzheimer’s disease, our results offer both increased understanding and a possible clinical approach for skeletal fragility seen with AD.
Acknowledgements
Financial support from the NIH (NIA) Training Grant T32AG057464 (1-5) (JL), Florence Petrlik Family Foundation, the Skidmore College Faculty Research Program (BP), and NIH (NIA) Grant R21AG063063 (DV). A part of this work has been presented as a brief abstract during the 2020 Annual Meeting of the American Society for Bone and Mineral Research (P-714), which is published under the Journal for Bone and Mineral Research, Volume 35, Issue S1, Page 269. November 2020.
Footnotes
Disclosures: All authors declare that they have no conflicts of interest.
Data Availability
The data that support the findings of this study are available from the corresponding author upon reasonable request.
References
- [1].C. P, “World Alzheimer report 2018: the state of the art of dementia research,” 2018.
- [2].Yu H and Wu J, “Amyloid-β: A double agent in Alzheimer’s disease?,” Biomed. Pharmacother, vol. 139, p. 111575, Jul. 2021. [DOI] [PubMed] [Google Scholar]
- [3].Wang D et al. , “The Structure Biology of Tau and Clue for Aggregation Inhibitor Design.,” Protein J., vol. 40, no. 5, pp. 656–668, Oct. 2021. [DOI] [PubMed] [Google Scholar]
- [4].Ishii M and ladecola C, “Metabolic and Non-Cognitive Manifestations of Alzheimers Disease: The Hypothalamus as Both Culprit and Target of Pathology,” Cell Metab., vol. 22, no. 5, pp. 761–776, 2015. [DOI] [PMC free article] [PubMed] [Google Scholar]
- [5].De La Monte SM, “Alzheimer’s Disease Is Type 3 Diabetes—Evidence Reviewed,” J. Diabetes Sci. Technol. J Diabetes Sci Technol J Diabetes Sci Technol, vol. 22, no. 6, pp. 1101–1113, 2008. [DOI] [PMC free article] [PubMed] [Google Scholar]
- [6].Hall A and Roberson E, “Mouse Models of Alzheimer’s Disease,” Brain Res Bull, vol. 88, no. 1, pp. 259–273, 2007. [DOI] [PMC free article] [PubMed] [Google Scholar]
- [7].Gao C, Liu Y, Li L, and Hölscher C, “New animal models of Alzheimer’s disease that display insulin desensitization in the brain,” Rev. Neurosci, vol. 24, no. 6, pp. 607–615, 2013. [DOI] [PubMed] [Google Scholar]
- [8].Lin B, Hasegawa Y, Takane K, Koibuchi N, Cao C, and Kim-Mitsuyama S, “High-Fat-Diet Intake Enhances Cerebral Amyloid Angiopathy and Cognitive Impairment in a Mouse Model of Alzheimer’s Disease, Independently of Metabolic Disorders.,” J. Am. Heart Assoc, vol. 5, no. 6, Jun. 2016. [DOI] [PMC free article] [PubMed] [Google Scholar]
- [9].Phan TX and Malkani RG, “Sleep and circadian rhythm disruption and stress intersect in Alzheimer’s disease.,” Neurobiol. Stress, vol. 10, p. 100133, Feb. 2019. [DOI] [PMC free article] [PubMed] [Google Scholar]
- [10].Lanoiselée H-M et al. , “APP, PSEN1, and PSEN2 mutations in early-onset Alzheimer disease: A genetic screening study of familial and sporadic cases.,” PLoS Med., vol. 14, no. 3, p. e1002270, Mar. 2017. [DOI] [PMC free article] [PubMed] [Google Scholar]
- [11].Souza LS et al. , “Role of APOE Gene in Bone Mineral Density and Incidence of Bone Fractures in Brazilian Postmenopausal Women.,” J. Clin. Densitom. Off. J. Int. Soc. Clin. Densitom, vol. 21, no. 2, pp. 227–235, 2018. [DOI] [PubMed] [Google Scholar]
- [12].Moneim AEA, “Oxidant / Antioxidant Imbalance and the Risk of Alzheimer ‘ s Disease,” pp. 335–349, 2015. [DOI] [PMC free article] [PubMed]
- [13].Prasad S, Sajja RK, Naik P, and Cucullo L, “Diabetes Mellitus and Blood-Brain Barrier Dysfunction: An Overview.,” J. Pharmacovigil, vol. 2, no. 2, p. 125, Jun.2014. [DOI] [PMC free article] [PubMed] [Google Scholar]
- [14].N. S et al. , “Advanced glycation end products in Alzheimer’s disease and other neurodegenerative diseases,” Am. J. Pathol, vol. 153, no. 4, pp. 1149–1155, 1998. [DOI] [PMC free article] [PubMed] [Google Scholar]
- [15].Takeuchi M and Yamagishi S, “Possible involvement of advanced glycation end-products (AGEs) in the pathogenesis of Alzheimer’s disease.,” Curr. Pharm. Des, vol. 14, no. 10, pp. 973–978, 2008. [DOI] [PubMed] [Google Scholar]
- [16].Sanguineti R, Puddu A, Mach F, Montecucco F, and Viviani GL, “Advanced Glycation End Products Play Adverse Proinflammatory Activities in Osteoporosis,” Mediators Inflamm., vol. 2014, pp. 1–9, 2014. [DOI] [PMC free article] [PubMed] [Google Scholar]
- [17].Asadipooya K and Uy EM, “Advanced Glycation End Products (AGEs), Receptor for AGEs, Diabetes, and Bone: Review of the Literature,” J. Endocr. Soc, vol. 3, no. 10, pp. 1799–1818, Oct. 2019. [DOI] [PMC free article] [PubMed] [Google Scholar]
- [18].Tang SY, Zeenath U, and Vashishth D, “Effects of non-enzymatic glycation on cancellous bone fragility.,” Bone, vol. 40, no. 4, pp. 1144–1151, Apr. 2007. [DOI] [PMC free article] [PubMed] [Google Scholar]
- [19].Ganeko K et al. , “Bone Aging by Advanced Glycation End Products,” J. Dent. Res, vol. 94, no. 12, pp. 1684–1690, Dec. 2015. [DOI] [PubMed] [Google Scholar]
- [20].ODETTI P et al. , “Advanced Glycation End Products and Bone Loss during Aging,” Ann. N. Y. Acad. Sci, vol. 1043, no. 1, pp. 710–717, Jun. 2005. [DOI] [PubMed] [Google Scholar]
- [21].Wang H-K et al. , “Increased risk of hip fractures in patients with dementia: a nationwide population-based study.,” BMC Neurol., vol. 14, p. 175, Sep. 2014. [DOI] [PMC free article] [PubMed] [Google Scholar]
- [22].Zhao Y, Shen L, and Ji H-F, “Alzheimer’s disease and risk of hip fracture: a meta-analysis study.,” ScientificWorldJournal., vol. 2012, p. 872173, 2012. [DOI] [PMC free article] [PubMed] [Google Scholar]
- [23].Dengler-Crish CM, Smith MA, and Wilson GN, “Early Evidence of Low Bone Density and Decreased Serotonergic Synthesis in the Dorsal Raphe of a Tauopathy Model of Alzheimer’s Disease,” J. Alzheimer’s Dis, vol. 55, no. 4, pp. 1605–1619, 2017. [DOI] [PMC free article] [PubMed] [Google Scholar]
- [24].Tan ZS et al. , “Bone mineral density and the risk of Alzheimer disease.,” Arch. Neurol, vol. 62, no. 1, pp. 107–111, Jan. 2005. [DOI] [PubMed] [Google Scholar]
- [25].Yaffe K, Browner W, Cauley J, Launer L, and Harris T, “Association between bone mineral density and cognitive decline in older women.,” J. Am. Geriatr. Soc, vol. 47, no. 10, pp. 1176–1182, Oct. 1999. [DOI] [PubMed] [Google Scholar]
- [26].Chen Y-H and Lo RY, “Alzheimer’s disease and osteoporosis.,” Ci ji yi xue za zhi = Tzu-chi Med. J, vol. 29, no. 3, pp. 138–142, 2017. [DOI] [PMC free article] [PubMed] [Google Scholar]
- [27].Dengler-Crish CM and Elefteriou F, “Shared mechanisms: osteoporosis and Alzheimer’s disease?,” Aging, vol. 11, no. 5. pp. 1317–1318, Feb-2019. [DOI] [PMC free article] [PubMed] [Google Scholar]
- [28].Otero K et al. , “TREM2 and β-catenin regulate bone homeostasis by controlling the rate of osteoclastogenesis,” J Immunol, vol. 6, no. 6, pp. 247–253, 2009. [DOI] [PMC free article] [PubMed] [Google Scholar]
- [29].Frame G, Bretland KA, and Dengler-Crish CM, “Mechanistic complexities of bone loss in Alzheimer’s disease: a review.,” Connect. Tissue Res, vol. 61, no. 1, pp. 4–18, Jan. 2020. [DOI] [PubMed] [Google Scholar]
- [30].Libro R, Bramanti P, and Mazzon E, “The role of the Wnt canonical signaling in neurodegenerative diseases.,” Life Sci., vol. 158, pp. 78–88, Aug. 2016. [DOI] [PubMed] [Google Scholar]
- [31].Marzo A et al. , “Reversal of Synapse Degeneration by Restoring Wnt Signaling in the Adult Hippocampus.,” Curr. Biol, vol. 26, no. 19, pp. 2551–2561, Oct. 2016. [DOI] [PMC free article] [PubMed] [Google Scholar]
- [32].Griciuc A et al. , “TREM2 Acts Downstream of CD33 in Modulating Microglial Pathology in Alzheimer’s Disease.,” Neuron, vol. 103, no. 5, pp. 820–835.e7, Sep. 2019. [DOI] [PMC free article] [PubMed] [Google Scholar]
- [33].Cao X, “RANKL-RANK signaling regulates osteoblast differentiation and bone formation.,” Bone research, vol. 6. p. 35, 2018. [DOI] [PMC free article] [PubMed] [Google Scholar]
- [34].Yoon S-S and Jo SA, “Mechanisms of Amyloid-β Peptide Clearance: Potential Therapeutic Targets for Alzheimer’s Disease.,” Biomol. Ther. (Seoul), vol. 20, no. 3, pp. 245–255, May 2012. [DOI] [PMC free article] [PubMed] [Google Scholar]
- [35].Li S, Liu B, Zhang L, and Rong L, “Amyloid beta peptide is elevated in osteoporotic bone tissues and enhances osteoclast function.,” Bone, vol. 61, pp. 164–175, Apr. 2014. [DOI] [PubMed] [Google Scholar]
- [36].Bradburn S et al. , “Association between osteocalcin and cognitive performance in healthy older adults.,” Age Ageing, vol. 45, no. 6, pp. 844–849, Nov. 2016. [DOI] [PMC free article] [PubMed] [Google Scholar]
- [37].Puig J et al. , “Lower serum osteocalcin concentrations are associated with brain microstructural changes and worse cognitive performance.,” Clin. Endocrinol. (Oxf), vol. 84, no. 5, pp. 756–763, May 2016. [DOI] [PubMed] [Google Scholar]
- [38].Obri A, Khrimian L, Karsenty G, and Oury F, “Osteocalcin in the brain: from embryonic development to age-related decline in cognition.,” Nat. Rev. Endocrinol, vol. 14, no. 3, pp. 174–182, Mar. 2018. [DOI] [PMC free article] [PubMed] [Google Scholar]
- [39].Lv X-L et al. , “Association between Osteoporosis, Bone Mineral Density Levels and Alzheimer’s Disease: A Systematic Review and Meta-analysis,” Int. J. Gerontol, vol. 12, no. 2, pp. 76–83, 2018. [Google Scholar]
- [40].Jawhar S, Trawicka A, Jenneckens C, Bayer TA, and Wirths O, “Motor deficits, neuron loss, and reduced anxiety coinciding with axonal degeneration and intraneuronal Aβ aggregation in the 5XFAD mouse model of Alzheimer’s disease.,” Neurobiol. Aging, vol. 33, no. 1, pp. 196.e29–40, Jan. 2012. [DOI] [PubMed] [Google Scholar]
- [41].Nagare R, Possidente B, Lagalwar S, and Figueiro MG, “Robust light-dark patterns and reduced amyloid load in an Alzheimer’s disease transgenic mouse model.,” Sci. Rep, vol. 10, no. 1, p. 11436, Jul. 2020. [DOI] [PMC free article] [PubMed] [Google Scholar]
- [42].Oakley H et al. , “Intraneuronal beta-amyloid aggregates, neurodegeneration, and neuron loss in transgenic mice with five familial Alzheimer’s disease mutations: potential factors in amyloid plaque formation.,” J. Neurosci, vol. 26, no. 40, pp. 10129–10140, Oct. 2006. [DOI] [PMC free article] [PubMed] [Google Scholar]
- [43].Bouxsein ML, Boyd SK, Christiansen BA, Guldberg RE, Jepsen KJ, and Müller R, “Guidelines for assessment of bone microstructure in rodents using micro-computed tomography.,” J. bone Miner. Res. Off. J. Am. Soc. Bone Miner. Res, vol. 25, no. 7, pp. 1468–1486, Jul. 2010. [DOI] [PubMed] [Google Scholar]
- [44].Penel G, Delfosse C, Descamps M, and Leroy G, “Composition of bone and apatitic biomaterials as revealed by intravital Raman microspectroscopy.,” Bone, vol. 36, no. 5, pp. 893–901, May 2005. [DOI] [PubMed] [Google Scholar]
- [45].Mandair GS and Morris MD, “Contributions of Raman spectroscopy to the understanding of bone strength.,” Bonekey Rep., vol. 4, p. 620, 2015. [DOI] [PMC free article] [PubMed] [Google Scholar]
- [46].Yerramshetty JS, Lind C, and Akkus O, “The compositional and physicochemical homogeneity of male femoral cortex increases after the sixth decade.,” Bone, vol. 39, no. 6, pp. 1236–1243, Dec. 2006. [DOI] [PubMed] [Google Scholar]
- [47].Penel G, Leroy G, Rey C, and Bres E, “MicroRaman spectral study of the PO4 and CO3 vibrational modes in synthetic and biological apatites.,” Calcif. Tissue Int, vol. 63, no. 6, pp. 475–481, Dec. 1998. [DOI] [PubMed] [Google Scholar]
- [48].Unal M, Uppuganti S, Timur S, Mahadevan-Jansen A, Akkus O, and Nyman JS, “Assessing matrix quality by Raman spectroscopy helps predict fracture toughness of human cortical bone.,” Sci. Rep, vol. 9, no. 1, p. 7195, May 2019. [DOI] [PMC free article] [PubMed] [Google Scholar]
- [49].Gamsjaeger S, Robins SP, Tatakis DN, Klaushofer K, and Paschalis EP, “Identification of Pyridinoline Trivalent Collagen Cross-Links by Raman Microspectroscopy.,” Calcif. Tissue Int, vol. 100, no. 6, pp. 565–574, Jun. 2017. [DOI] [PubMed] [Google Scholar]
- [50].Rubin MR et al. , “Advanced glycation endproducts and bone material properties in type 1 diabetic mice,” PLoS One, vol. 11, no. 5, pp. 1–14, 2016. [DOI] [PMC free article] [PubMed] [Google Scholar]
- [51].Unal M and Akkus O, “Raman spectral classification of mineral- and collagen-bound water’s associations to elastic and post-yield mechanical properties of cortical bone.,” Bone, vol. 81, pp. 315–326, Dec. 2015. [DOI] [PMC free article] [PubMed] [Google Scholar]
- [52].Khalid M, Bora T, Al Ghaithi A, Thukral S, and Dutta J, “Raman Spectroscopy detects changes in Bone Mineral Quality and Collagen Cross-linkage in Staphylococcus Infected Human Bone.,” Sci. Rep, vol. 8, no. 1, p. 9417, Jun. 2018. [DOI] [PMC free article] [PubMed] [Google Scholar]
- [53].Morris MD and Mandair GS, “Raman assessment of bone quality.,” Clin. Orthop. Relat. Res, vol. 469, no. 8, pp. 2160–2169, Aug. 2011. [DOI] [PMC free article] [PubMed] [Google Scholar]
- [54].Creecy A et al. , “Changes in the Fracture Resistance of Bone with the Progression of Type 2 Diabetes in the ZDSD Rat.,” Calcif. Tissue Int, vol. 99, no. 3, pp. 289–301, Sep. 2016. [DOI] [PMC free article] [PubMed] [Google Scholar]
- [55].LLabre JE, Sroga GE, Tice MJL, and Vashishth D, “Induction and rescue of skeletal fragility in a high-fat diet mouse model of type 2 diabetes: An in vivo and in vitro approach.,” Bone, vol. 156, p. 116302, Mar. 2022. [DOI] [PMC free article] [PubMed] [Google Scholar]
- [56].Nyman JS et al. , “Partial removal of pore and loosely bound water by low-energy drying decreases cortical bone toughness in young and old donors.,” J. Mech. Behav. Biomed. Mater, vol. 22, pp. 136–145, Jun. 2013. [DOI] [PMC free article] [PubMed] [Google Scholar]
- [57].Nyman JS et al. , “Manipulating the Amount and Structure of the Organic Matrix Affects the Water Compartments of Human Cortical Bone.,” JBMR plus, vol. 3, no. 6, p. e10135, Jun. 2019. [DOI] [PMC free article] [PubMed] [Google Scholar]
- [58].Shitole P, Choubey A, Mondal P, and Ghosh R, “LDN Protects Bone Property Deterioration at Different Hierarchical Levels in T2DM Mice Bone.,” ACS omega, vol. 6, no. 31, pp. 20369–20378, Aug. 2021. [DOI] [PMC free article] [PubMed] [Google Scholar]
- [59].Londoño-Restrepo SM, Jeronimo-Cruz R, Millán-Malo BM, Rivera-Muñoz EM, and Rodriguez-García ME, “Effect of the Nano Crystal Size on the X-ray Diffraction Patterns of Biogenic Hydroxyapatite from Human, Bovine, and Porcine Bones.,” Sci. Rep, vol. 9, no. 1, p. 5915, Apr. 2019. [DOI] [PMC free article] [PubMed] [Google Scholar]
- [60].Monshi A, Foroughi MR, and Monshi M, “Modified Scherrer Equation to Estimate More Accurately Nano-Crystallite Size Using XRD,” World J. Nano Sci. Eng, vol. 02, pp. 154–160, 2012. [Google Scholar]
- [61].Poundarik AA, Boskey A, Gundberg C, and Vashishth D, “Biomolecular regulation, composition and nanoarchitecture of bone mineral,” Sci. Rep, vol. 8, no. 1, p. 1191, 2018. [DOI] [PMC free article] [PubMed] [Google Scholar]
- [62].Vashishth D, “Advanced glycation end-products and bone fractures,” IBMS Bonekey, vol. 6, no. 8, pp. 268–278, 2009. [DOI] [PMC free article] [PubMed] [Google Scholar]
- [63].Vashishth D, Gibson GJ, Khoury JI, Schaffler MB, Kimura J, and Fyhrie DP, “Influence of nonenzymatic glycation on biomechanical properties of cortical bone.,” Bone, vol. 28, no. 2, pp. 195–201, Feb. 2001. [DOI] [PubMed] [Google Scholar]
- [64].Poundarik AA et al. , “A Direct Role of Collagen Glycation in Bone Fracture,” Pediatr Neurol, vol. 52, no. 6, pp. 566–584, 2016. [DOI] [PMC free article] [PubMed] [Google Scholar]
- [65].Sroga GE, Siddula A, and Vashishth D, “Glycation of Human Cortical and Cancellous Bone Captures Differences in the Formation of Maillard Reaction Products between Glucose and Ribose,” PLoS One, vol. 10, no. 2, p. e0117240, Feb. 2015. [DOI] [PMC free article] [PubMed] [Google Scholar]
- [66].LLabre JE, Trujillo R, Sroga GE, Figueiro MG, and Vashishth D, “Circadian rhythm disruption with high-fat diet impairs glycemic control and bone quality.,” FASEB J. Off. Publ. Fed. Am. Soc. Exp. Biol, vol. 35, no. 9, p. e21786, Sep. 2021. [DOI] [PMC free article] [PubMed] [Google Scholar]
- [67].Ritchie RO, Koester KJ, Ionova S, Yao W, Lane NE, and Ager JW 3rd, “Measurement of the toughness of bone: a tutorial with special reference to small animal studies.,” Bone, vol. 43, no. 5, pp. 798–812, Nov. 2008. [DOI] [PMC free article] [PubMed] [Google Scholar]
- [68].Vashishth D, “Small animal bone biomechanics,” Bone, vol. 43, no. 5, pp. 794–797, 2008. [DOI] [PMC free article] [PubMed] [Google Scholar]
- [69].Jepsen KJ, Silva MJ, Vashishth D, Guo XE, and van der Meulen MCH, “Establishing biomechanical mechanisms in mouse models: practical guidelines for systematically evaluating phenotypic changes in the diaphyses of long bones.,” J. bone Miner. Res. Off. J. Am. Soc. Bone Miner. Res, vol. 30, no. 6, pp. 951–966, Jun. 2015. [DOI] [PMC free article] [PubMed] [Google Scholar]
- [70].Gendron WH et al. , “Age related weight loss in female 5xFAD mice from 3 to 12 months of age,” Behav. Brain Res, vol. 406, p. 113214, May 2021. [DOI] [PubMed] [Google Scholar]
- [71].Knight EM, Verkhratsky A, Luckman SM, Allan SM, and Lawrence CB, “Hypermetabolism in a triple-transgenic mouse model of Alzheimer’s disease,” Neurobiol. Aging, vol. 33, no. 1, pp. 187–193, Jan. 2012. [DOI] [PubMed] [Google Scholar]
- [72].Deacon RMJ, “Assessing nest building in mice.,” Nat. Protoc, vol. 1, no. 3, pp. 1117–1119, 2006. [DOI] [PubMed] [Google Scholar]
- [73].Filali M and Lalonde R, “Age-related cognitive decline and nesting behavior in an APPswe/PS1 bigenic model of Alzheimer’s disease.,” Brain Res., vol. 1292, pp. 93–99, Oct. 2009. [DOI] [PubMed] [Google Scholar]
- [74].Gaskill BN, Karas AZ, Garner JP, and Pritchett-Corning KR, “Nest building as an indicator of health and welfare in laboratory mice.,” J. Vis. Exp, no. 82, p. 51012, Dec. 2013. [DOI] [PMC free article] [PubMed] [Google Scholar]
- [75].Pu Z, Tang X, Fei Y, Hou Q, Lin Y, and Zha X, “Bone metabolic biomarkers and bone mineral density in male patients with early-stage Alzheimer’s disease.,” Eur. Geriatr. Med, vol. 11, no. 3, pp. 403–408, Jun. 2020. [DOI] [PubMed] [Google Scholar]
- [76].Alkhouli MF et al. , “Exercise and resveratrol increase fracture resistance in the 3xTg-AD mouse model of Alzheimer’s disease.,” BMC Complement. Altern. Med, vol. 19, no. 1, p. 39, Feb. 2019. [DOI] [PMC free article] [PubMed] [Google Scholar]
- [77].O’Leary TP, Robertson A, Chipman PH, Rafuse VF, and Brown RE, “Motor function deficits in the 12 month-old female 5xFAD mouse model of Alzheimer’s disease.,” Behav. Brain Res, vol. 337, pp. 256–263, Jan. 2018. [DOI] [PubMed] [Google Scholar]
- [78].Moechars D, Lorent K, De Strooper B, Dewachter I, and Van Leuven F, “Expression in brain of amyloid precursor protein mutated in the alpha-secretase site causes disturbed behavior, neuronal degeneration and premature death in transgenic mice.,” EMBO J., vol. 15, no. 6, pp. 1265–1274, Mar. 1996. [PMC free article] [PubMed] [Google Scholar]
- [79].Saalbach A and Anderegg U, “Thy-1: more than a marker for mesenchymal stromal cells.,” FASEB J. Off. Publ. Fed. Am. Soc. Exp. Biol, vol. 33, no. 6, pp. 6689–6696, Jun. 2019. [DOI] [PubMed] [Google Scholar]
- [80].Pan J-X et al. , “APP promotes osteoblast survival and bone formation by regulating mitochondrial function and preventing oxidative stress,” Cell Death Dis., vol. 9, no. 11, p. 1077, Nov. 2018. [DOI] [PMC free article] [PubMed] [Google Scholar]
- [81].Xia W-F et al. , “Swedish mutant APP suppresses osteoblast differentiation and causes osteoporotic deficit, which are ameliorated by N-acetyl-L-cysteine,” J. Bone Miner. Res, vol. 28, no. 10, pp. 2122–2135, Oct. 2013. [DOI] [PMC free article] [PubMed] [Google Scholar]
- [82].Thomas CJ, Cleland TP, Sroga GE, and Vashishth D, “Accumulation of carboxymethyl-lysine (CML) in human cortical bone.,” Bone, vol. 110, pp. 128–133, May 2018. [DOI] [PMC free article] [PubMed] [Google Scholar]
- [83].Ehrlich H et al. , “Modification of collagen in vitro with respect to formation of Nepsilon-carboxymethyllysine.,” Int. J. Biol. Macromol, vol. 44, no. 1, pp. 51–56, Jan. 2009. [DOI] [PubMed] [Google Scholar]
- [84].Kawamura M et al. , “Pentosidine correlates with nanomechanical properties of human jaw bone.,” J. Mech. Behav. Biomed. Mater, vol. 98, pp. 20–25, Oct. 2019. [DOI] [PubMed] [Google Scholar]
- [85].Nakano M et al. , “Pentosidine and carboxymethyl-lysine associate differently with prevalent osteoporotic vertebral fracture and various bone markers,” Sci. Rep, vol. 10, no. 1, p. 22090, Dec. 2020. [DOI] [PMC free article] [PubMed] [Google Scholar]
- [86].Takeuchi M et al. , “Involvement of Advanced Glycation End-products ( AGEs ) in Alzheimer ’ s Disease,” pp. 39–46, 2004. [DOI] [PubMed]
- [87].Poundarik AA et al. , “A direct role of collagen glycation in bone fracture.,” J. Mech. Behav. Biomed. Mater, vol. 52, pp. 120–130, Dec. 2015. [DOI] [PMC free article] [PubMed] [Google Scholar]
- [88].Taylor EA, Mileti CJ, Ganesan S, Kim JH, and Donnelly E, “Measures of Bone Mineral Carbonate Content and Mineral Maturity/Crystallinity for FT-IR and Raman Spectroscopic Imaging Differentially Relate to Physical–Chemical Properties of Carbonate-Substituted Hydroxyapatite,” Calcif. Tissue Int, vol. 109, no. 1, pp. 77–91, 2021. [DOI] [PubMed] [Google Scholar]
- [89].Awonusi A, Morris MD, and Tecklenburg MMJ, “Carbonate assignment and calibration in the Raman spectrum of apatite.,” Calcif. Tissue Int, vol. 81, no. 1, pp. 46–52, Jul. 2007. [DOI] [PubMed] [Google Scholar]
- [90].Sroga GE and Vashishth D, “Controlled Formation of Carboxymethyllysine in Bone Matrix through Designed Glycation Reaction.,” JBMR plus, vol. 5, no. 11, p. e10548, Nov. 2021. [DOI] [PMC free article] [PubMed] [Google Scholar]
- [91].Diab T, Sit S, Kim D, Rho J, and Vashishth D, “Age-dependent fatigue behaviour of human cortical bone.,” Eur. J. Morphol, vol. 42, no. 1–2, pp. 53–59, 2005. [DOI] [PubMed] [Google Scholar]
- [92].Ural A and Vashishth D, “Hierarchical perspective of bone toughness – from molecules to fracture,” Int. Mater. Rev, vol. 59, no. 5, pp. 245–263, Jun. 2014. [Google Scholar]
- [93].O’Flaherty EJ, “Modeling normal aging bone loss, with consideration of bone loss in osteoporosis.,” Toxicol. Sci, vol. 55, no. 1, pp. 171–188, May 2000. [DOI] [PubMed] [Google Scholar]
- [94].Hemmati E, Mirghafourvand M, Mobasseri M, Shakouri SK, Mikaeli P, and Farshbaf-Khalili A, “Prevalence of primary osteoporosis and low bone mass in postmenopausal women and related risk factors.,” J. Educ. Health Promot, vol. 10, p. 204, 2021. [DOI] [PMC free article] [PubMed] [Google Scholar]
- [95].Dhaliwal R, Ewing SK, Vashishth D, Semba RD, and V Schwartz A, “Greater Carboxy-Methyl-Lysine Is Associated With Increased Fracture Risk in Type 2 Diabetes.,” J. bone Miner. Res. Off. J. Am. Soc. Bone Miner. Res, vol. 37, no. 2, pp. 265–272, Feb. 2022. [DOI] [PMC free article] [PubMed] [Google Scholar]
- [96].Nomi Y et al. , “Free advanced glycation end product distribution in blood components and the effect of genetic polymorphisms.,” Biochimie, vol. 179, pp. 69–76, Dec. 2020. [DOI] [PubMed] [Google Scholar]
- [97].Chen K, Massie C, and Berger AJ, “Soft-tissue spectral subtraction improves transcutaneous Raman estimates of murine bone strength in vivo.,” J. Biophotonics, vol. 13, no. 11, p. e202000256, Nov. 2020. [DOI] [PMC free article] [PubMed] [Google Scholar]
- [98].Shu C, Chen K, Lynch M, Maher JR, Awad HA, and Berger AJ, “Spatially offset Raman spectroscopy for in vivo bone strength prediction.,” Biomed. Opt. Express, vol. 9, no. 10, pp. 4781–4791, Oct. 2018. [DOI] [PMC free article] [PubMed] [Google Scholar]
- [99].Sihota P et al. , “Investigation of Mechanical, Material, and Compositional Determinants of Human Trabecular Bone Quality in Type 2 Diabetes.,” J. Clin. Endocrinol. Metab, vol. 106, no. 5, pp. e2271–e2289, Apr. 2021. [DOI] [PubMed] [Google Scholar]
Associated Data
This section collects any data citations, data availability statements, or supplementary materials included in this article.
Data Availability Statement
The data that support the findings of this study are available from the corresponding author upon reasonable request.