

Abstract
Objectives:
Major socio-political events can influence the general public’s affective state and other affect-related processes, such as sleep. Here, we investigated the extent that the 2020 US presidential election impacted sleep, public mood, and alcohol consumption. We also explored the relationship between affect and sleep changes during the peak period of election stress.
Participants:
US-residing (n=437) and non-US-residing (n=106) participants were recruited online for participation in the study.
Methods:
A non-representative, convenience sample responded to daily assessments of their affect, sleep, and alcohol consumption during a baseline period (October 1–13, 2020) and in the days surrounding the 2020 US Election (October 30 - November 12, 2020).
Results:
Analyses determined changes within and between US and non-US participants. Election Day evoked significantly reduced sleep amount and efficiency, coupled with heightened stress, negative affect, and increased alcohol use. While US participants were significantly more impacted in a number of domains, non-US participants also reported reduced sleep and greater stress compared to baseline. Across participants, disrupted sleep on Election Night correlated with changes in emotional well-being and alcohol consumption on Election Day.
Conclusion:
These results suggest that major socio-political events can have global impacts on sleep that may interact with significant fluctuations in public mood and well-being. Further, while the largest impact is on the local population, these results suggest that the effects can extend beyond borders. These findings highlight the potential impact of future socio-political events on public well-being.
Keywords: Public mood, affect, sleep, stress, depression, US election, alcohol consumption, COVID-19
Introduction
Major political and societal events can have dramatic impacts on psychological health. These events can be positive (e.g. hosting major sporting events) or negative (e.g. Boston Marathon bombing), and impact multiple dimensions of sleep1–4 and mental and emotional well-being.5–10 One lens through which this effect has been studied is referred to as “public mood,”3,11,12 or the way in which the overall affective state of the general public is influenced in a positive or negative direction specifically because of their membership in a particular community. The political affiliation aspect of public mood13 is similar to that of other social-based emotional reactions driven by social group membership12 and in-group-out-group differentiation.14 Moreover, it can be influenced by a variety of factors, including national identity, partisanship, policy dissatisfaction, personal and collective experiences, discrete emotional responses to short-term events, and other predisposing factors.11
Recent examples of societal events affecting psychological health and public mood can be found in studies reporting reduced sleep, heightened stress, and increased negative affect in the days surrounding divisive socio-political events, such as US elections.3,8,15 A study on the 2008 US presidential election found that supporters of the winning presidential candidate (Barack Obama) reported significant increases in positive affect and decreases in negative affect following the election, while supporters of the losing presidential candidate (John McCain) reported the reverse (decreased positive affect, increased negative affect).8 Hoyt & colleagues15 tracked young adults’ affect and cortisol in the days surrounding the 2016 election. They found an increase in negative affect leading up to the election followed by a post-election “recovery”. The authors reported no change in morning or evening cortisol across all participants but did find that these effects were further modulated by certain group memberships, such as sex, ethnicity, race, and political affiliation15 (see Supplementary Materials for more details).
Given the proposed relationship between psychological factors, such as negative affect and stress, and biological processes, like sleep, it is surprising how little research has been conducted exploring the relationship between acute shifts in “public mood” and sleep during these highly intense socio-political events and other major societal events, both positive and negative. One of the few peer-reviewed studies recently examined 15 million nights of sleep using sleep-monitoring smartphone apps before and after the UK Brexit poll and the 2016 presidential election.3 In both instances, they found that sleep was significantly reduced the night of the poll and election for UK and US residents, respectively. Further, they found that global sleep was reduced the night of the US election, but not the night of the UK poll. The authors attributed this to the proportion of US-based app users (>30%), which they suspected had a heavy impact on the global mean, (UK-users were only ~8% of the user-base). The authors also note that the 2016 election occurred the week that Daylight Savings Time ended in the US, which also may have had an influence on sleep timing, amount, and quality.3 Importantly, however, the authors had no other measures of affect or stress and thus were unable to explore any potential links between changes in psychiatric measures and sleep.
These recent findings highlight several intriguing areas for further research. First, given the bidirectional effects of sleep and affect,16–18 it is intriguing to consider how changes in affect and emotional well-being of participants relate to the subsequent sleep pattern changes reported by Anýž and colleagues3. Second, it is also interesting to consider how public shifts in affect and sleep may relate to the engagement in different positive (e.g., mindfulness, self-care) and negative (e.g., increased alcohol/drug consumption) coping strategies. Moreover, given the context of the present study it is important to keep in mind that some of these behaviors, such as alcohol consumption, could be implemented or increase as either a negative coping strategy19 or engagement in celebratory behavior.20 Finally, a fundamental characteristic of “public mood” is that, by definition, the impacts are thought to be most pronounced for citizens of a specific community.11,12 As the world becomes more globalized and national interests more intertwined, it is interesting to consider how barriers between different communities may become blurred, such that major events in one country may lead to “global” shifts in mood and sleep. This is especially relevant for events in 2020 given the global devastation of the COVID-19 pandemic. Not only is it important to consider how the pandemic may have increased the globalization of “public mood,” but given the flood of research investigating the effects of the pandemic on mental health, it is critical to remember that the pandemic did not occur in isolation. Rather, major public events took place that may better account for shifts in public mood (e.g., the murder of George Floyd and the subsequent global protests), and must be taken into consideration, especially if survey responses are averaged over time.
To this point, the 2020 US presidential election was a highly anticipated and contentious socio-political event that was frequently featured in international news and occurred in the midst of the COVID-19 pandemic. Here, we investigated the extent that the 2020 US election impacted subjective reports of sleep, indicators of public mood, and reported consumption of alcohol in both US and non-US residents. In line with previous research, we anticipated sharp changes in measures of sleep and public mood in the days surrounding the election compared to the average reports across the assessment period (October 1–November 12). We also predicted that these changes would be greatest in US residents, but that non-US residents would also show some degree of change compared to their average responses across the same assessment period. Finally, we explored how day-of-election changes in affect, stress, depression, and alcohol consumption were related to subsequent sleep following the close of election polls on election night. While exploratory, to our knowledge this association between changes in public mood and subsequent sleep in the wake of an election is completely novel to the field and adds much needed ecological-relevance to an area of research that has largely relied on lab-based study designs.
Participants and Methods
Participants
As part of a larger study exploring the sleep and psychological repercussions of the COVID-19 pandemic,21–24 we collected metrics of sleep and public mood during a baseline period prior to acute election stress (October 1–13, 2020) and in the days surrounding the November 3rd, 2020 Election (October 30-November 12, 2020) from a non-representative convenience sample. All English-speaking adults aged 18+ were eligible for the study, regardless of pre-existing mental health or medical conditions (see Supplementary Materials for recruitment information). The age of participants in this sample ranged from 18–90 years old (M=39.8). The full sample (N=543) included a subsample of non-US residents, which permitted a unique opportunity to compare sleep and psychological trajectories surrounding the election in both US-residing (n=437) and non-US-residing (n=106) participants (see Table 1 for demographics and Table 2 for geographic locations). The Boston College Institutional Review Board approved all consent and assessment procedures.
Table 1:
Participant demographics. N reported as number of participants; Age reported in years; all other demographics reported as percentage of total US and non-US participants
| Participant Demographics | ||
|---|---|---|
| US | Non-US | |
| N | 437 | 106 |
| Age | ||
| mean | 41.31 | 33.58 |
| std | 18.39 | 13.03 |
| min | 18 | 19 |
| 25th percentile | 27 | 24 |
| 50th percentile | 34 | 29 |
| 75th percentile | 57 | 38 |
| max | 90 | 73 |
| Ethnicity | ||
| Hispanic | 5.29% | 6.60% |
| Not Hispanic | 93.10% | 88.68% |
| Prefer not to say / Not Reported | 1.61% | 4.72% |
| Race | ||
| Black | 1.83% | 0% |
| Asian | 7.09% | 18.87% |
| White | 82.84% | 63.21% |
| Hispanic/Latino/Latina | 1.83% | 5.66% |
| Native Hawaiian or Other Pacific Islander | 0% | 0.94% |
| American Indian/Alaska Native | 0.23% | 0.23% |
| More than one race/Prefer to self-describe | 4.81% | 9.43% |
| Unknown | 0% | 0% |
| Prefer not to say / Not Reported | 1.14% | 1.89% |
| Gender | ||
| female | 81.71% | 77.36% |
| male | 16.90% | 19.81% |
| prefer to self-describe | 0.69% | 0% |
| non-binary/third gender | 0% | 2.83% |
| Prefer not to say / Not Reported | 0% | 0% |
| Biological Sex | ||
| female | 82.84% | 79.25% |
| male | 17.16% | 20.75% |
| Gender Identity | ||
| cisgender | 98.85% | 99.06% |
| transgender | 0.46% | 0.94% |
| Prefer not to say / Not Reported | 0.69% | 0.46% |
| Sexual Orientation | ||
| straight/heterosexual | 81.94% | 78.30% |
| bisexual | 11.34% | 11.32% |
| gay/lesbian | 3.47% | 6.60% |
| prefer to self-describe | 1.85% | 2.83% |
| Prefer not to say / Not Reported | 1.39% | 0.94% |
| Education | ||
| graduate, medical, or professional degree | 48.28% | 44.34% |
| bachelor’s degree | 29.52% | 21.70% |
| some college | 10.98% | 18.87% |
| some post-bachelor | 9.15% | 10.38% |
| high school diploma or GED | 2.06% | 3.77% |
| some high school | 0% | 0.94% |
| Relationship Status | ||
| married | 37.99% | 29.25% |
| single | 29.75% | 39.62% |
| in a relationship | 22.43% | 29.25% |
| separated/divorced | 6.64% | 1.89% |
| widowed | 3.20% | 0% |
| Serious medical problems? | ||
| no | 90.85% | 90.57% |
| yes | 9.15% | 9.43% |
| Income | ||
| $0 – 25,000 | 6.41% | 20.75% |
| $25,001 – 50,000 | 16.02% | 16.98% |
| $50,001 – 75,000 | 15.79% | 17.92% |
| $75,001 – 100,000 | 17.62% | 17.92% |
| $100,001 – 150,000 | 21.05% | 14.15% |
| $150,001 – 250,000 | 13.73% | 4.72% |
| $250,000+ | 9.38% | 7.55% |
| Are you a full time student? | ||
| no | 79.18% | 68.87% |
| yes | 20.82% | 31.13% |
| Are you currently employed? | ||
| yes | 73.12% | 80.82% |
| no | 26.88% | 19.18% |
| Very Liberal | 29.1% | 25.5% |
| Liberal | 32.3% | 30.2% |
| Slightly Liberal | 8.2% | 9.4% |
| Moderate | 11.2% | 16.0% |
| Slightly Conservative | 3.4% | 0.9% |
| Conservative | 2.7% | 0.9% |
| Very Conserative | 0.0% | 0.0% |
| Not Reported | 13.0% | 17.0% |
Table 2:
Participant Geographic Locations. US Regions and Non-US countries reported as number of participants that reported being from each location.
| Geographic Locations of Participants | |
|---|---|
| US Regions (US Participants only) | |
| Northeast | 214 |
| West | 67 |
| Midwest | 64 |
| South | 50 |
| Not Reported | 42 |
| Non-US Countries (Non-US Participants only) | |||
|---|---|---|---|
| Canada | 28 | 1 | |
| Australia | 10 | 1 | |
| Brazil | 5 | 1 | |
| United Kingdom | 5 | 1 | |
| Germany | 4 | 1 | |
| India | 4 | 1 | |
| Sweden | 4 | 1 | |
| Chile | 3 | 1 | |
| France | 3 | 1 | |
| Philippines | 3 | 1 | |
| South Africa | 3 | 1 | |
| Spain | 3 | 1 | |
| Austria | 2 | 1 | |
| Netherlands | 2 | 1 | |
| New Zealand | 2 | 1 | |
| Norway | 2 | 1 | |
| Albania | 1 | 1 | |
| Barbados | 1 | 1 | |
| China | 1 | 1 | |
| Czech Republic | 1 | ||
Procedure
Details of the larger study tracking the effects of COVID-19 study can be found in the Supplementary Materials and data descriptor publication.21 To reduce participant burden, we created two versions of daily assessments — a Short and Full Version. The Short Version of our survey included all questions relevant to the duration and quality of sleep, including bedtime, sleep attempt time, sleep onset latency, number of awakenings, wake time after sleep onset (WASO), morning wake time, out-of-bed time, and amount of daytime napping. The Short Version also assessed alcohol consumption and subjective experience of overall stress. All questions within the Short Version were optional and – given the longitudinal nature of the data collection – participants were asked to respond to any that they were able given their time and energy each day. The Full Version of the survey included all questions from the Short Version, as well as assessment of affect using the Positive and Negative Affect Schedule (PANAS),25 and symptoms of depression using a modified version of the Patient Health Questionnaire-9 (PHQ-9).26,27 Most questions within the Full Version were required for completion, but participation each day was optional.
For the present report, daily surveys were initiated during a baseline period prior to the election (October 1–13) and the days surrounding the election (October 30–November 12). One version of the survey (Short or Full) was sent each day of the assessment periods. Surveys were sent via email using REDCAP28,29 to all consented and registered participants, and were set to arrive at 08:00 in the residential time zone of the participant. Participants were asked to fill out the survey soon after its arrival in the morning, but the survey remained open all day so that participants could respond at the time that was most convenient for them. To prevent recall lag, however, if participants were unable to respond to a survey within 24-hours, they were explicitly instructed to skip that day entirely and try to respond the next day, rather than to try to recall their sleep and public mood metrics days later. Everyone always received the same version of the survey each day. Administration of the Full vs. Short version was pseudo-randomly determined to ensure equal coverage between days of the week. The Full Version was sent 2–3 days/week while the Short Version was sent the remaining days of the week. As such, sleep, stress, and alcohol consumption were assessed every day during the assessment periods, while affect and depression were assessed 2–3 times per week. The questions were designed to assess the previous night’s sleep and alcohol consumption, while participants were prompted to report their affect, stress, and depression in the moment at the time of survey completion. Both versions of the daily survey are available for open access (https://osf.io/gpxwa/). See Supplementary Section for more details on the Measures and characteristics of the sample across the data collection period.
Data Analysis
Measures of time in bed (TIB), total sleep time (TST), and sleep efficiency (SE) were calculated from the daily sleep logs (see Supplementary Materials). The PANAS metrics of positive (PA) and negative affect (NA) were scored as recommended. Per IRB request, the PHQ-9 suicidality question was omitted and the eight remaining PHQ-9 questions were summed as a modified depression score.27 The question on subjective experience of stress was reported on a 7-point Likert scale.22,23,30 Number of awakenings, minutes napping, and number of alcoholic beverages consumed were self-reported by participants. Data was cleaned to remove incorrect or implausible responses31 and dates in which there were fewer than 30 usable responses for a variable were omitted from analyses (see Supplementary Materials). We also limited the analysis of alcohol consumption to known consumers of alcohol within our dataset and adjusted certain measures (e.g., TIB, TST, alcohol) by day of week to account for known differences in weekdays and weekends (see Supplementary Materials).
The dependent variables were analyzed with linear mixed models with a random intercept for subject. Each dependent variable (DV) of interest was analyzed in a separate DV~day model for US and non-US participants separately. Day was a deviation coded categorical variable (each day compared to the grand mean). The interaction of day and residence (US vs non-US) was tested in a DV~day*residence model for each DV with residence as a dummy coded categorical predictor (US=0, non-US=1). This allowed us to determine the individual days that differed from the grand means across the October-November assessment period for US and non-US groups separately, and the days in which the day × group interaction was significant, indicating that the impact of that day differed between groups (denoted by red dates in the figures). Post hoc correlations were then conducted between changes in sleep and public mood on Election Day. Models were estimated with restricted maximum likelihood, degrees of freedom and p-values were estimated via the Satterthwaite approximation, and confidence intervals were estimated via the likelihood profile method.
Analyses were conducted in R.32 Mixed models and inferential tests for these models were estimated with the lme4,33 lmerTest,34 and afex35 packages. Analysis scripts are available for open access (https://osf.io/2dcsn/).
Results
Impact of Election on Sleep
With regard to sleep on Election night, both US and non-US participants reported similar levels of significant sleep loss (TST; Figure 1a) compared to their grand averages across the reporting period. TIB (Figure 1b) only decreased significantly in US participants, and this reduction differed significantly compared to non-US participants. On Election night, US participants reported significantly greater WASO (Figure 1c) and poorer sleep efficiency (Figure 1e) compared to their grand mean. US, but not non-US, participants also had more WASO in anticipation of the election, with higher WASO on the eve of Election Day compared to the grand mean. This increase in WASO differed from the non-US participants as indicated by the significant day*group interaction. We found no evidence of increased sleep fragmentation (i.e., increased number of awakenings) in US participants on election night compared to their overall average, but they did have fewer awakenings during recovery sleep the following night (Figure 1d). Sleep onset latency did not deviate from the average for US or non-US participants, but US participants did spend less time napping the day before the election and more time napping the day after the election than usual, and these changes in napping significantly differed compared to non-US participants (Figures 1f–g).
Figure 1:
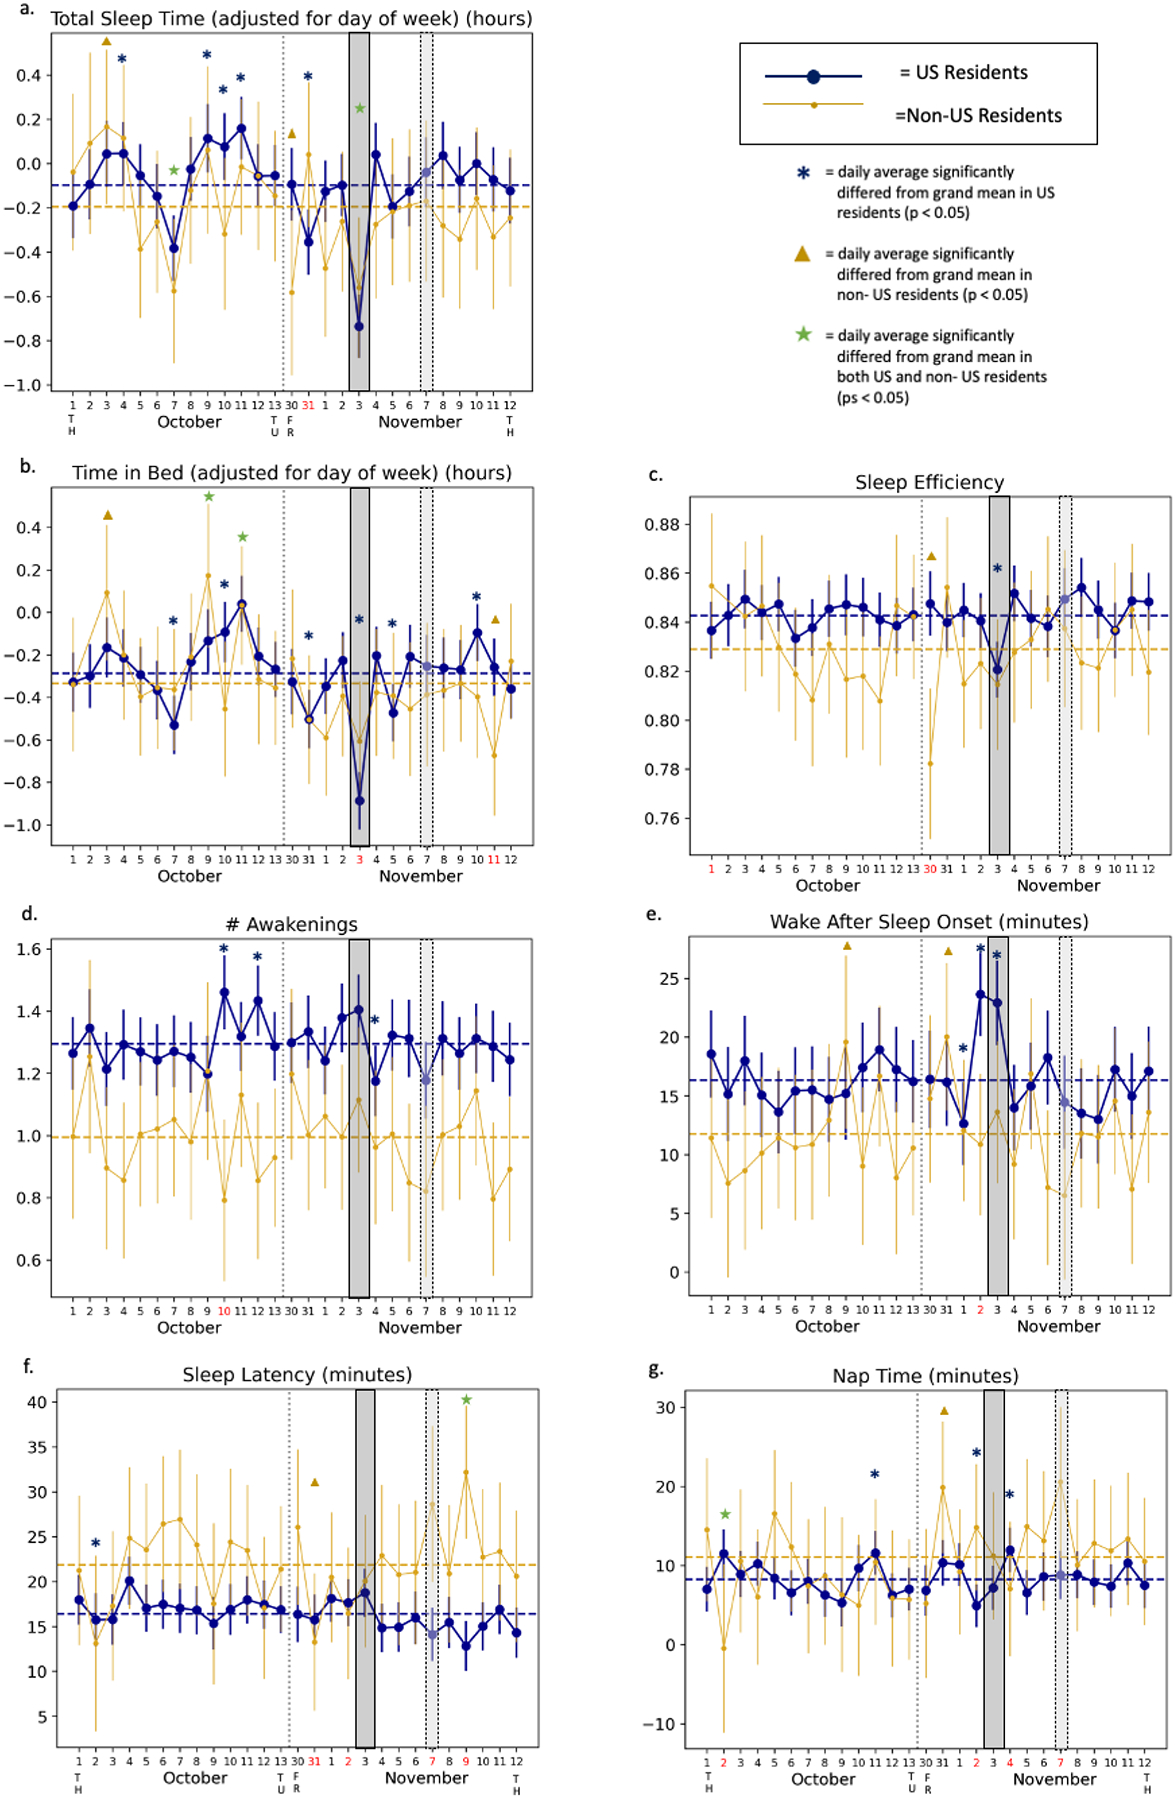
Graphical representation of the DV ~ day linear mixed models (LMM) for all sleep measures: Total Sleep Time (TST; reported in number of hours), Time in Bed (TIB; reported in number of hours), Sleep Efficiency (SE; reported as proportion TST/TIB), number of awakenings (# Awakenings), wake after sleep onset (WASO; reported in minutes), sleep onset latency (reported in minutes), and nap time (reported in minutes). Given typical differences in weekends vs. weekdays, total sleep time was adjusted for the day of the week. US residents are presented in blue with large markers, non-US residents are presented in gold with small markers. The dotted horizontal lines show the intercept (i.e., the mean of daily averages) for each group. The data points show the model estimate for the mean of each group (coefficient + intercept) and the confidence interval (CI) around the coefficient. Where the CI does not overlap the group intercept, that day differed significantly from the grand mean (p < 0.05). The date on the x-axis is red if the day*group interaction was significant in a DV ~ day*group model (i.e., if the impact of that day differed between the groups) at a level of p < 0.05. Blue asterisks mark days in which US residents (but not non-US residents) significantly differed from the US resident mean. Gold triangles mark days in which non-US residents (but not US residents) significantly differed from the non-US resident mean. Green stars mark the days in which both US and non-US residents differed from their respective means. Top and bottom rows of figures include day-of-week anchors along x-axis: TH = Thursday, TU = Tuesday, FR = Friday. Dates in which there were fewer than 30 usable non-US participant responses for a variable were omitted from analyses. Election day is highlighted by the dark gray-filled box. The day the election was called by the Associated Press is highlighted by the light gray open box.
Impact of Election on measures of Public Mood
While stress levels remained largely consistent during the October assessment period for both US and non-US participants, there was a sharp rise in reported stress in the days leading up to the election, peaking on Election Day (Figure 2a). Conversely, stress levels recovered and even undershot reporting averages, with stress levels significantly below the grand average on November 6th-8th (the presidential race was called on November 7th). While these patterns were observed in both US and non-US participants, stress level changes were significantly greater in US participants from November 1st-5th. In US-participants, NA (Figure 2b) and depression (Figure 2c) both increased prior to Election Day, peaked on Election Day, and recovered following the election. Moreover, PA was significantly lower than average on Election Day before returning to normal (Figure 2d). Non-US participants did not report significant changes in affect or depression in the days immediately surrounding the election, but they did report significant decreases in negative affect and depression the day after the election was called. Model interaction results indicated that there were multiple days in which the affect changes were greater in US-participants compared to non-US participants, while the decrease in depression symptoms after the election was called was greater in non-US participants compared to US participants.
Figure 2:
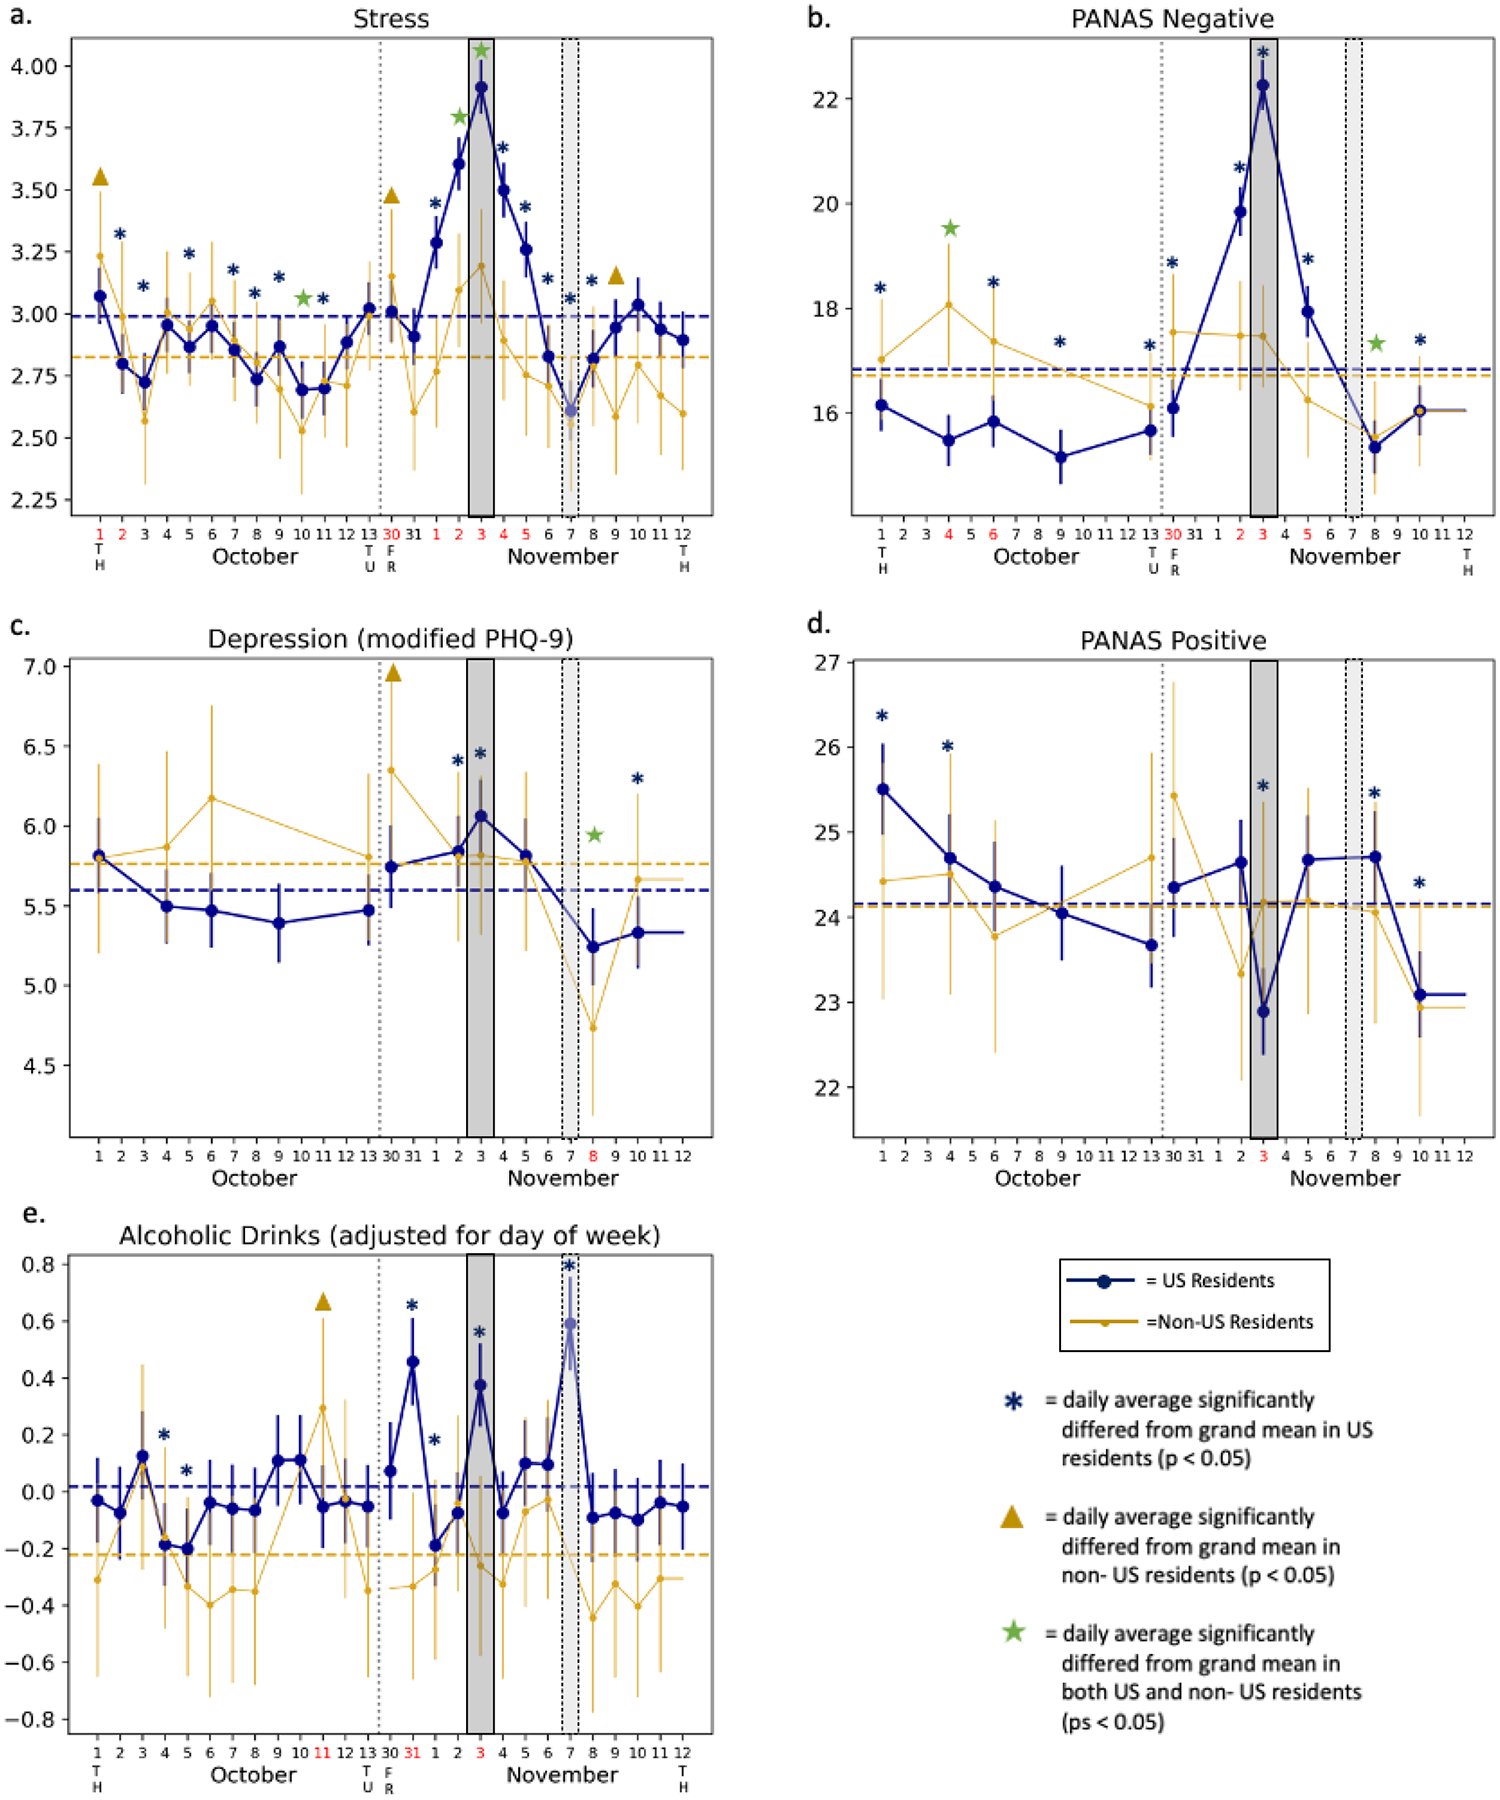
Graphical representation of the DV ~ day linear mixed models (LMM) for (a) stress (reported in units), (b) negative affect (PANASt Negative; reported in units), (c) depression (modified PHQ-9c; reported in units), (d) positive affect (PANASt Positive; reported in units), and (e) alcohol consumption (reported in number of drinks). Given typical differences in weekends vs. weekdays, alcohol consumption was adjusted for the day of the week. US residents are presented in blue with large markers, non-US residents are presented in gold with small markers. The dotted horizontal lines show the intercept (i.e., the mean of daily averages) for each group. The data points show the model estimate for the mean of each group (coefficient + intercept) and the confidence interval (CI) around the coefficient. Where the CI does not overlap the group intercept, that day differed significantly from the grand mean (p < 0.05). The date on the x-axis is red if the day*group interaction was significant in a DV ~ day*group model (i.e., if the impact of that day differed between the groups) at a level of p < 0.05. Blue asterisks mark days in which US residents (but not non-US residents) significantly differed from the US resident mean. Gold triangles mark days in which non-US residents (but not US residents) significantly differed from the non-US resident mean. Green stars mark the days in which both US and non-US residents differed from their respective means. Top and bottom rows of figures include day-of-week anchors along x-axis: TH = Thursday, TU = Tuesday, FR = Friday. Dates in which there were fewer than 30 usable non-US participant responses for a variable were omitted from analyses. Election day is highlighted by the dark gray-filled box. The day the election was called by the Associated Press is highlighted by the light gray open box. t PANAS = Positive and Negative Affect Schedule c The Patient Health Questionnaire-9 (PHQ-9) was modified to remove the question assessing suicidality due to IRB considerations. The remaining 8 questions were summed as usual to calculate the modified PHQ-9 score.
Impact of Election on Alcohol Consumption
In US participants who ever reported alcohol consumption across the entire study up to the point of this report (March 2020–March 2021), there were three days over the assessment period in which alcohol consumption was significantly increased. These days corresponded to the Halloween holiday (October 31st, 2020; Saturday pre-election), Election Day (Tuesday November 3rd, 2020), and the day the presidential race was called by most media outlets (November 7th, 2020; Saturday post-election; Figure 2e). Among non-US participants who ever reported drinking, there was no change in alcohol consumption during the November assessment period. Further, the US participant increases in alcohol consumption on Halloween and Election Day were significantly greater than reported changes in the non-US sample.
Correlations between metrics of Sleep and Public Mood
Given that the effects of the election reached their zenith on Election Day, we ran post hoc analyses correlating changes in indicators of public mood on Election Day with changes in sleep on Election Night. For each of the following metrics, change scores were calculated by subtracting their reports on Election Day/Night from the individual average across the baseline assessment period (October 1–13, 2020) for each metric: (1) sleep measures: TIB, TST, SE and (2) psychiatric measures: stress, depression, NA, PA, and alcohol consumption. Each sleep change score was then separately correlated with each “public mood” change score. Given the novelty of these analyses within the context of a major socio-political event, they were conducted in an exploratory manner.
Correlations are reported in Table 3. Decreases in TST the night of the election correlated with increases in stress, NA, and alcohol consumption reported on the day of the election, but not changes in PA or depression. Similarly, reductions in sleep efficiency on the night of the election correlated with increases in stress, depression, and NA, but not changes in PA or alcohol consumption the day of the election (see Supplementary Figure 1). Interestingly, reduced TIB the night of the election only correlated with increased alcohol consumption, and not with measures of Election Day stress, depression, NA, or PA (all ps > 0.4). Finally, change in alcohol consumption was not related to changes in any metric of public mood (see Supplementary Table 2).
Table 3.
Association between election-related change in sleep and change in mental health metrics. All variables involved in these correlations are difference scores: the difference between that variable on election day and the average of the early October period (Oct 1–13). Variables labeled “adj” are adjusted for day of the week (see Methods). TST = Total Sleep Time, TIB = Time in Bed, PANAS NA = Negative Affect subscale, PANAS PA = Positive Affect subscale, mPHQ9 = modified Patient Health Questionnaire-9 (depression scale without suicidality question), Bold p-values < .05 for exploratory analyses. An asterisk by the p-value indicates correlations that remained significant with a Benjamini and Hochberg (1995) false discovery rate (FDR) correction.
| Correlate | N | r | CI Lower | CI Upper | p-value | |
|---|---|---|---|---|---|---|
| TST (adj) | stress | <0.001* | ||||
| mPHQ9 | 0.137 | |||||
| PANAS NA | 0.003* | |||||
| PANAS PA | 0.177 | |||||
| alcohol (adj) | 0.002* | |||||
| Sleep Efficiency | stress | <0.001* | ||||
| mPHQ9 | 0.016 | |||||
| PANAS NA | <0.001* | |||||
| PANAS PA | 0.074 | |||||
| alcohol (adj) | 0.228 | |||||
| TIB (adj) | stress | 0.430 | ||||
| mPHQ9 | 0.825 | |||||
| PANAS NA | 0.467 | |||||
| PANAS PA | 0.479 | |||||
| alcohol (adj) | 0.041 |
Discussion
We conceptually replicated previous work indicating that major socio-political events, such as general elections, can have significant and deleterious effects on sleep and emotional well-being metrics related to “public mood”. Affect, stress, depression, and sleep metrics were all significantly worsened the day and night of the 2020 US election compared to typical functioning in a subset of the US population (see Limitations). Interestingly, the stress and affect measures in particular saw a steady rise and then a recovery in the days after the election, similar to findings from Hoyt and colleagues.15 In addition to these replications, we further extended this line of research in three directions.
First, this is the first study to find that there is a relationship between the previously reported changes in Election Day public mood and sleep the night of the election. Specifically, increases in day-of-Election stress, negative affect, and alcohol consumption correlated with reductions in sleep duration, and poorer election night sleep efficiency was associated with greater election day stress, negative affect, and depression. Interestingly, reduced TIB the night of the election only correlated with increased alcohol consumption, and not with measures of stress, depression, negative affect, or positive affect reported on the day of the election. This suggests that the relationship between changes in measures of public mood and subsequent sleep are not driven by bedtime behavior (i.e., spending more or less time in bed), but rather psychiatric health exerting influence on sleep duration and quality. Not only is this finding important for understanding how our health36 and functioning37 may be at risk in the wake of major elections and other national and societal events, but this adds ecologically relevant data to research associating daytime affect with subsequent nocturnal sleep.17 As the relationship between sleep and public mood are likely bidirectional, future research should explore how modulations in these factors work together to exert influence on each other over time leading up to and following divisive socio-political and other major societal events. Moreover, it is not just that elections may influence sleep, but evidence suggests that sleep and circadian differences may influence civic engagement and participation in elections as well.38,39 Thus, if the relationship between sleep and elections is also bidirectional, it will be important for future research to determine how public mood and stress effects on sleep leading up to an election may effect or even alter its outcome.
Second, previous theories of “public mood” have posited that its effects are limited to specific communities. While we did see greater effects in our cohort of US residents, non-US residents still reported a significant increase in stress on the day of the US election and decreases in negative affect and depression the day after the election was called compared to their average reports. Further, non-US residents showed a reduction in sleep duration the night of the US election that was of the same magnitude as US residents. This was similarly reported in Anýž et al,3 but they attributed it to the large proportion of US respondents on the averaged measures. Here, we found that sleep changes persisted even when separating US-respondents from those living outside of the US. These findings indicate that with continued globalization, the lines between national politics may be getting increasingly blurry, such that even those not directly governed by the policies of a particular government may still be impacted and share in sleep and affect changes resulting from major events and outcomes. The US may be a premier example of this given how interwoven it is in global politics. Additionally, while we attempted to collect a baseline period (October 1–13) that was relatively free from major sociopolitical events, there may have been other events that we did not take into consideration, in addition to potentially natural fluctuations in public mood. For instance, there was only one other night during the entire assessment period that showed a significant decrease in TST for both US and non-US residents, and that was October 7th. As astutely noticed by one of our reviewers, this was the night of the Vice-Presidential debate between Kamala Harris and Mike Pence. While speculative, it is certainly plausible that the debate had a seemingly global negative influence on sleep duration and opens intriguing questions about the types of events that can influence public mood and sleep. For instance, is it possible for seemingly smaller events to have a disproportionate influence on the mood and sleep of the public if they are linked to a more critical future event? This will be an interesting area for future research.
Finally, we investigated how alcohol consumption may be affected and related to these shifts in public mood and sleep. We found that, exclusively in our sample of US participants, there was a significant increase in alcohol consumption the night of the election among participants that ever-reported drinking across the entirety of our study. We further found significant spikes in alcohol consumption the Saturdays before and after the election, which were associated with Halloween and the day the election was called, respectively. Moreover, analyses were adjusted by day of week, indicating that the drinking was greater than typical Tuesday and Saturday drinking behavior. This preliminary finding mapping changes in alcohol consumption alongside changes in public mood and sleep highlights an intriguing avenue for future research.
Another unique contribution of this paper was exploring the impact of an acute political event in the midst of a long-term societal stressor (i.e., COVID-19). It could have been possible that stress levels were already so high due to the pandemic that not much change would have been apparent during the election, but that was clearly not the case here. This makes sense considering other research from this dataset that indicated a seemingly quick recovery from the peak effects of pandemic stress on public mood in the early weeks of the pandemic.22,23,30 There has been a flood of research on the effects of the pandemic over the last two years.1 The influence of the election provides important contextual information for the analysis and interpretation of public mood and sleep data collected with the intent of determining the effects of the pandemic, as it is clear that other short-term events, even beyond those mentioned here, could elicit major shifts in these measures as well. It will be critical for researchers and reviewers to consider the potential impact of other events throughout the pandemic period (e.g., US election and presidential/vice-presidential debates, death of George Floyd and the social justice movement that developed in its wake, etc.) that may influence the perception of how we were affected by the pandemic in the long-term, especially if responses are aggregated over time.
While our study benefits from several strengths, including a large sample size, domestic and international respondents, and baseline assessment of functioning prior to the onset of acute election stress, there are several notable limitations. The foremost limitation is that a majority of the sample is white, female, liberal leaning on political ideology, and primarily based in the Northeast region of the United States. Our participant pool was recruited as a convenience sample as part of a larger study investigating changes in sleep and mood during the COVID-19 pandemic, and given its non-representative characteristics when compared to the general demographics of the US, it substantially limits the degree to which the results can be generalized. The political nature of this work and the current climate of political polarization might make this particularly problematic, as the lasting effects of election stress on public mood and sleep may interact with the ultimate success or failure of your preferred political candidate (i.e., the sample here was likely more pleased with the final outcome of the 2020 election given its overall liberal composition). Though the protracted nature of the announcement of the winner of the 2020 election may have ameliorated this effect to some extent, it’s possible that survey responses interacted with the news as the results crystallized over the subsequent 4 days. As such, the interpretation of the results here are limited in that the experience of the majority of participants was the buildup of election stress and subsequent response when the election ultimately goes your way. A better understanding of this kind of political stress on public mood and sleep will need to better sample from both ends of the political spectrum.
Another sample limitation was that the US resident sample was approximately four times the size of the non-US resident sample. In addition to the sample size differences, certain qualities of the study may further limit the generalizability of the findings here to broader groups of non-US residents. For instance, the surveys were only offered in English and were conducted online. As such, it not only required participants to be English-speaking, but also required them to have access to functioning technology and internet. The access to technology may mean that they have easier access and are more attuned to US news, and the English-speaking requirement increases the likelihood that some participants may have been expatriated from the US, which also may increase their involvement with US politics. Additionally, the largest sub-group of non-US residents was participants from Canada, and it is intriguing to consider if they may have been more affected given their proximity to the US. The structure of the assessment and composition of the questions are limitations of the study as well. The study entirely relied on self-report, though notably most research suggests that the self-report measures of sleep used here typically have high agreement with objective measures of sleep.40 While the measures of sleep, affect, and depression used previously validated measures, assessment of stress and alcohol consumption were reduced to single-item questions to reduce participant burden during daily assessment. Similarly, while completion of the survey and the questions themselves were designed to be optional to reduce participant burden, this may have increased sampling bias into the study as perhaps only those that were the most emotionally affected by the election opted to respond on those key days, which may have artificially amplified the effect. Future research should focus on using more diverse and validated research tools and recruiting and understanding the impact of divisive socio-political events on a more diverse sample of US and non-US participants. In particular, it will be important to extend research to groups such as younger adults, women, and minority groups, in which the impact of elections and other related significant political events may be greater.8,15 It is also critical that follow-up work in this area more intentionally recruits participants from both sides of the political spectrum so we can determine if these effects overlap or diverge depending on if a person’s preferred political candidate is victorious or defeated.
Conclusion
Our findings highlight the fact that divisive political events negatively impact a wide variety of factors that may be considered relevant for public mood. Further, for the first time we found that changes in measures of public mood are related to subsequent sleep immediately following a political event, and that following the 2020 US election the shifts in public mood did not appear relegated to US residents alone. Not only are these findings important for considering the impact of future socio-political events on public well-being, but they also provide an important cautionary tale when interpreting research done on the impact of COVID-19 on emotional well-being. It will be critical for researchers studying public mood during the COVID-19 pandemic to retrospectively consider major public events such as elections and racial strife that were going on concurrently and may have influenced their metrics and take them into account to more accurately delineate the impacts of the pandemic from other pressures on society.
Supplementary Material
Acknowledgements/Funding
The authors TJC, ECF, and RB would like to thank their NIH T32 funding sources for supporting their work and training. At the time of data collection and processing, TJC and RB were funded by the Research Training Program in Sleep, Circadian and Respiratory Neurobiology (NIH T32 HL007901) through the Division of Sleep Medicine at Harvard Medical School and Brigham and Women’s Hospital. ECF was funded by NIH NRSA T32 NS007292 through Brandeis University. Additional funding for the project came from Boston College and a Small Research Grant from the Sleep Research Society Foundation. No sponsors had a direct influence on this work.
Footnotes
Publisher's Disclaimer: This is a PDF file of an unedited manuscript that has been accepted for publication. As a service to our customers we are providing this early version of the manuscript. The manuscript will undergo copyediting, typesetting, and review of the resulting proof before it is published in its final form. Please note that during the production process errors may be discovered which could affect the content, and all legal disclaimers that apply to the journal pertain.
Ethics approval and informed consent: Ethics approval and informed consent was confirmed through the Boston College Institutional Review Board with IRB Protocol # 20.212.01.
Consent for Publication: All images associated with this work are original and can be published.
Declaration of Conflicts of Interest: The authors have no financial or non-financial conflicts of interests to report with relation to this work.
A PubMed search on the terms “sleep and COVID-19” at the time of drafting this manuscript brings up 4,743 studies published over the last two years.
Data accessibility Statement
The study for the larger ongoing study examining affect, mental health, and sleep during the time of COVID-19 that this data collection was a part of was pre-registered here prior to the start of the data collection for this period (https://osf.io/tb4qv), but the specific analyses for this report were not pre-registered. The data used for this report and analysis scripts are available on the Open Science Framework (OSF) page for this project (https://osf.io/2dcsn/). All data collected as part of the larger study is also available on OSF (https://osf.io/gpxwa/).
REFERENCES:
- 1.American Academy of Sleep Medicine. AASM Sleep Prioritization Survey Monday after the Super Bowl. Published online 2019. Accessed April 13, 2021. https://j2vjt3dnbra3ps7ll1clb4q2-wpengine.netdna-ssl.com/wp-content/uploads/2020/01/sleep-prioritization-survey-2019-super-bowl-results.pdf
- 2.American Academy of Sleep Medicine. AASM Sleep Prioritization Survey After Election Night. Published online October 20, 2021. Accessed April 13, 2021. https://www.newswise.com/politics/nearly-one-in-three-americans-sacrifice-sleep-on-election-night2/?article_id=739832
- 3.Anýž J, Bakštein E, Dudysová D, et al. No wink of sleep: Population sleep characteristics in response to the brexit poll and the 2016 U.S. presidential election. Soc Sci Med. 2019;222:112–121. doi: 10.1016/j.socscimed.2018.12.024 [DOI] [PubMed] [Google Scholar]
- 4.Wright KP, Linton SK, Withrow D, et al. Sleep in university students prior to and during COVID-19 Stay-at-Home orders. Curr Biol. 2020;30(14):R797–R798. doi: 10.1016/j.cub.2020.06.022 [DOI] [PMC free article] [PubMed] [Google Scholar]
- 5.Comer JS, Golik A, Martin J. Children’s Mental Health After 9/11 and the Boston Marathon Bombing. In: Hoven CW, Amsel LV, Tyano S, eds. An International Perspective on Disasters and Children’s Mental Health. Integrating Psychiatry and Primary Care. Springer International Publishing; 2019:73–91. doi: 10.1007/978-3-030-15872-9_5 [DOI] [Google Scholar]
- 6.Fernquist RM. An aggregate analysis of professional sports, suicide, and homicide rates: 30 U.s. metropolitan areas, 1971–1990. Aggress Violent Behav. 2000;5(4):329–341. doi: 10.1016/S1359-1789(98)00012-3 [DOI] [Google Scholar]
- 7.Joiner TE, Hollar D, Orden KV. On Buckeyes, Gators, Super Bowl Sunday, and the Miracle on Ice: “Pulling Together” is Associated With Lower Suicide Rates. J Soc Clin Psychol. 2006;25(2):179–195. doi: 10.1521/jscp.2006.25.2.179 [DOI] [Google Scholar]
- 8.Scheibe S, Mata R, Carstensen LL. Age differences in affective forecasting and experienced emotion surrounding the 2008 US presidential election. Cogn Emot. 2011;25(6):1029–1044. doi: 10.1080/02699931.2010.545543 [DOI] [PMC free article] [PubMed] [Google Scholar]
- 9.Schwarz N, Strack F, Kommer D, Wagner D. Soccer, rooms, and the quality of your life: Mood effects on judgments of satisfaction with life in general and with specific domains. Eur J Soc Psychol. 1987;17(1):69–79. doi: 10.1002/ejsp.2420170107 [DOI] [Google Scholar]
- 10.Trovato F The Stanley Cup of Hockey and Suicide in Quebec, 1951–1992*. Soc Forces. 1998;77(1):105–126. doi: 10.1093/sf/77.1.105 [DOI] [Google Scholar]
- 11.Rahn WM, Kroeger B, Kite CM. A Framework for the Study of Public Mood. Polit Psychol. 1996;17(1):29–58. doi: 10.2307/3791942 [DOI] [Google Scholar]
- 12.Ringmar E What are public moods? Eur J Soc Theory. 2018;21(4):453–469. doi: 10.1177/1368431017736995 [DOI] [Google Scholar]
- 13.Smith ER. Chapter 13 - Social Identity and Social Emotions: Toward New Conceptualizations of Prejudice. In: Mackie DM, Hamilton DL, eds. Affect, Cognition and Stereotyping. Academic Press; 1993:297–315. doi: 10.1016/B978-0-08-088579-7.50017-X [DOI] [Google Scholar]
- 14.Abele A, Gendofla GHE, Petzold P. Positive Mood and In-Group-Out-Group Differentiation in a Minimal Group Setting. Pers Soc Psychol Bull. 1998;24(12):1343–1357. [Google Scholar]
- 15.Hoyt LT, Zeiders KH, Chaku N, Toomey RB, Nair RL. Young adults’ psychological and physiological reactions to the 2016 U.S. presidential election. Psychoneuroendocrinology. 2018;92:162–169. doi: 10.1016/j.psyneuen.2018.03.011 [DOI] [PubMed] [Google Scholar]
- 16.Haack M, Mullington JM. Sustained sleep restriction reduces emotional and physical well-being. Pain. 2005;119(1):56–64. doi: 10.1016/j.pain.2005.09.011 [DOI] [PubMed] [Google Scholar]
- 17.Vandekerckhove M, Weiss R, Schotte C, Exadaktylos V, Haex B, Cluydts R. The role of presleep negative emotion in sleep physiology. :7. [DOI] [PubMed] [Google Scholar]
- 18.Vandekerckhove M, lin Wang Y. Emotion, emotion regulation and sleep: An intimate relationship. AIMS Neurosci. 2017;5(1):1–17. doi: 10.3934/Neuroscience.2018.1.1 [DOI] [PMC free article] [PubMed] [Google Scholar]
- 19.Williams A, Clark D. Alcohol consumption in university students: the role of reasons for drinking, coping strategies, expectancies, and personality traits. Addict Behav. 1998;23(3):371–378. doi: 10.1016/S0306-4603(97)80066-4 [DOI] [PubMed] [Google Scholar]
- 20.Glindemann KE, Wiegand DM, Geller ES. Celebratory Drinking and Intoxication: A Contextual Influence on Alcohol Consumption. Environ Behav. 2007;39(3):352–366. doi: 10.1177/001391650290949 [DOI] [Google Scholar]
- 21.Cunningham TJ, Fields E, Kensinger EA. Boston College daily sleep and well-being survey data during early phase of the COVID-19 pandemic. Sci Data. Published online 2021. doi: 10.1038/s41597-021-00886-y [DOI] [PMC free article] [PubMed] [Google Scholar]
- 22.Cunningham TJ, Fields EC, Garcia SM, Kensinger EA. The relation between age and experienced stress, worry, affect, and depression during the spring 2020 phase of the COVID-19 pandemic in the United States. Emotion. Published online June 17, 2021. doi: 10.1037/emo0000982 [DOI] [PubMed] [Google Scholar]
- 23.Fields EC, Kensinger EA, Garcia SM, Ford JH, Cunningham TJ. With age comes well-being: older age associated with lower stress, negative affect, and depression throughout the COVID-19 pandemic. Aging Ment Health. 2021;0(0):1–9. doi: 10.1080/13607863.2021.2010183 [DOI] [PMC free article] [PubMed] [Google Scholar]
- 24.Ford JH, Garcia SM, Fields EC, Cunningham TJ, Kensinger EA. Older adults remember more positive aspects of the COVID-19 pandemic. Psychol Aging. 2021;36(6):694–699. doi: 10.1037/pag0000636 [DOI] [PMC free article] [PubMed] [Google Scholar]
- 25.Clark LA, Watson D. The PANAS-X: Manual for the Positive and Negative Affect Schedule - Expanded Form. Published online 1994. doi: 10.17077/48vt-m4t2 [DOI] [Google Scholar]
- 26.Kroenke K, Spitzer RL. The PHQ-9: A New Depression Diagnostic and Severity Measure. Psychiatr Ann. 2002;32(9):509–515. doi: 10.3928/0048-5713-20020901-06 [DOI] [Google Scholar]
- 27.Kroenke K, Strine TW, Spitzer RL, Williams JBW, Berry JT, Mokdad AH. The PHQ-8 as a measure of current depression in the general population. J Affect Disord. 2009;114(1):163–173. doi: 10.1016/j.jad.2008.06.026 [DOI] [PubMed] [Google Scholar]
- 28.Harris PA, Taylor R, Minor BL, et al. The REDCap consortium: Building an international community of software platform partners. J Biomed Inform. 2019;95:103208. doi: 10.1016/j.jbi.2019.103208 [DOI] [PMC free article] [PubMed] [Google Scholar]
- 29.Harris PA, Taylor R, Thielke R, Payne J, Gonzalez N, Conde JG. Research electronic data capture (REDCap)—A metadata-driven methodology and workflow process for providing translational research informatics support. J Biomed Inform. 2009;42(2):377–381. doi: 10.1016/j.jbi.2008.08.010 [DOI] [PMC free article] [PubMed] [Google Scholar]
- 30.Rodriguez-Seijas C, Fields EC, Bottary R, et al. Comparing the Impact of COVID-19-Related Social Distancing on Mood and Psychiatric Indicators in Sexual and Gender Minority (SGM) and Non-SGM Individuals. Front Psychiatry. 2020;11. Accessed May 27, 2022. https://www.frontiersin.org/article/10.3389/fpsyt.2020.590318 [DOI] [PMC free article] [PubMed] [Google Scholar]
- 31.Bottary R, Fields EC, Kensinger EA, Cunningham TJ. Age and chronotype influenced sleep timing changes during the first wave of the COVID-19 pandemic. J Sleep Res. 2022;31(2):e13495. doi: 10.1111/jsr.13495 [DOI] [PMC free article] [PubMed] [Google Scholar]
- 32.R Core Team. R: A Language and Environment for Statistical Computing. R Foundation for Statistical Computing; 2017. https://www.R-project.org/. [Google Scholar]
- 33.Bates D, Mächler M, Bolker B, Walker S. Fitting Linear Mixed-Effects Models Using lme4. J Stat Softw. 2015;67(1). doi: 10.18637/jss.v067.i01 [DOI] [Google Scholar]
- 34.Kuznetsova A, Brockhoff PB, Christensen RHB. lmerTest Package: Tests in Linear Mixed Effects Models. J Stat Softw. 2017;82(13). doi: 10.18637/jss.v082.i13 [DOI] [Google Scholar]
- 35.Singmann S, Bolker B, Westfall J, Aust F, Ben-Schachar MS. Afex: Analysis of Factorial Experiments (Version 0.28-1). [Computer Software].; 2021. https://CRAN.R-project.org/package=afex
- 36.Sandhu A, Seth M, Gurm HS. Daylight savings time and myocardial infarction. Open Heart. 2014;1(1):e000019. doi: 10.1136/openhrt-2013-000019 [DOI] [PMC free article] [PubMed] [Google Scholar]
- 37.Fairclough SH, Graham R. Impairment of Driving Performance Caused by Sleep Deprivation or Alcohol: A Comparative Study. Hum Factors. 1999;41(1):118–128. doi: 10.1518/001872099779577336 [DOI] [PubMed] [Google Scholar]
- 38.Holbein JB, Schafer JP, Dickinson DL. Insufficient sleep reduces voting and other prosocial behaviours. Nat Hum Behav. 2019;3(5):492–500. doi: 10.1038/s41562-019-0543-4 [DOI] [PubMed] [Google Scholar]
- 39.Schafer J, Holbein JB. When Time Is of the Essence: A Natural Experiment on How Time Constraints Influence Elections. J Polit. 2020;82(2):418–432. doi: 10.1086/706110 [DOI] [Google Scholar]
- 40.Zinkhan M, Berger K, Hense S, et al. Agreement of different methods for assessing sleep characteristics: a comparison of two actigraphs, wrist and hip placement, and self-report with polysomnography. Sleep Med. 2014;15(9):1107–1114. doi: 10.1016/j.sleep.2014.04.015 [DOI] [PubMed] [Google Scholar]
Associated Data
This section collects any data citations, data availability statements, or supplementary materials included in this article.
Supplementary Materials
Data Availability Statement
The study for the larger ongoing study examining affect, mental health, and sleep during the time of COVID-19 that this data collection was a part of was pre-registered here prior to the start of the data collection for this period (https://osf.io/tb4qv), but the specific analyses for this report were not pre-registered. The data used for this report and analysis scripts are available on the Open Science Framework (OSF) page for this project (https://osf.io/2dcsn/). All data collected as part of the larger study is also available on OSF (https://osf.io/gpxwa/).