

Abstract
The global value chain (GVC) literature has recognized the regional linkages of global production sharing while overlooking some regions across the globe. This gap may leave unanswered the question of how South American countries’ regional trade linkages have changed amid the acceleration of globalization. This study, thus, investigates the regional linkages of global production sharing of South America by relying on value-added trade measures. Additionally, we develop a pioneering value-added hubness measure to illustrate the degree of relative market dependence between countries. The findings suggest that intra-regional forward linkages in South America have increased over time, but there are signs of a re-orientation towards Asia. China’s influence extended beyond Asia, and together with the United States, China became an important hub-nation for South America. Brazil appears as a potential regional hub, mainly through its domestic market and not domestic production. Therefore, the study adds to GVC literature with insights about a missing region, reveals signs of changes in the interconnections between regional blocs, and enriches the research on the hub-and-spoke trade systems.
Keywords: Global value chains, Regional linkages, Vertical specialization, Value-added trade, South America, Hubness Index
Introduction
The future of hyperglobalization has been shaken by a series of political, technological, and economic turmoil. Dani Rodrik coined the term ‘hyperglobalization’ in 2011 and described hyperglobalization in trade and finance as a type of globalization that intended to create seamlessly integrated world markets and tore domestic societies apart (Rodrik 2011, 2016). Rodrik (2011, p. 23) argued that “the most significant external constraint that developing nations face as a consequence of hyperglobalization are the restrictions on industrial policies that make it harder for countries in Latin America, Africa, and elsewhere to emulate the development strategies that East Asian countries have employed to such good effect.” The term has also been used by Subramanian and Kessler (2013), which describes hyperglobalization according to the following aspects: (i) the rapid rise in trade integration since the 1990s (“hyperglobalization”); (ii) the importance of services (“dematerialization of globalization); (iii) the widespread embrace of openness (“democratic globalization”); (iv) the similarity of North-to-South trade and investment flows with flows in the other direction (“crisscrossing globalization”); (v) the rise of China as mega-trader; vi) the proliferation of regional trade agreements; and vii) the decline of barriers to trade in goods, although barriers to trade in services remain high. More recently, ECLAC (2016) included the surge in cross-border data flows since the late 1990s as an essential feature of hyperglobalization.
The notion of how the international fragmentation of global value chains (GVCs) has occurred occupies a center stage in recent development research. In the early 1990s, scholars expected that the surge of fragmented and geographically dispersed value chains increased opportunities for new entrants (economies and firms) to participate in GVCs. Unfortunately, there is currently a general perception that the slicing up of global value chains failed to involve every country or region across the globe. The backlash against international trade has fueled political debates over regional strategic autonomy in developed economies and regional development objectives in less developed economies. The sluggish growth in trade flows has slowed the pace of the allocation of components production among different countries, and it may trigger far-reaching consequences for developing countries. More recently, the COVID-19 pandemic could lead to a policy push for a higher degree of national or regional self-sufficiency in production and supply-chain resilience (see UNCTAD 2020).
We are especially interested, in this paper, in the dynamics of regional value chains in the age of hyperglobalization. Despite the ongoing resistance to globalization, insights into the regional linkages of global production sharing throughout accelerated globalization may introduce new pathways of economic transformation. Existing literature (Baldwin 2012; Baldwin and Forslid 2014, Baldwin and Lopez-Gonzalez 2013; Ito and Vézina 2016, Los et al. 2013) recognizes that global production networks are marked by regional blocs, usually known as Factory Asia, Factory North America, and Factory Europe. It should be noted, however that little has been discussed about trade specialization patterns in South America as a regional bloc, which here will be named Factory South America.
This paper examines the changing dynamics of regional linkages of global production sharing, focusing on the case of Factory South America amid the acceleration of globalization in the late 1990s. For this purpose, we investigate the regional bloc of South America by employing value-added trade inter and intra-regional blocs. The availability of international input–output (IIO) tables made it possible to analyze production fragmentation and specialization patterns in a way that was not previously feasible. From a GVC literature perspective, a country participates in GVCs in two ways: using imported intermediate inputs to produce exports and exporting intermediate goods used by others to produce their own exports (Koopman et al. 2014). Therefore, the traditional picture of a country’s participation in GVCs disregards the exported products consumed or processed for consumption in the first country importing them. Despite the spurt of interest in regional value chains, scholars have not yet investigated the geographic distribution of South American countries’ final consumption and production value-added. Meanwhile, much is discussed about the expansion of China within bilateral trade of South American countries in the 2000s, although without further considerations about how, in the context of fragmented production and internationally dispersed value networks, this means strengthening other intra-regional bloc value-added trade linkages. Our analysis of Factory South America’s case will have implications for a better understanding of countries and regions’ integration in the world production system through trade, export capacity on the supply side, and relative market dependence on the demand side.
We use the Trade in Value-Added (TiVA) data last updated in December 2016,1 which is a joint OECD-WTO initiative, to add evidence from regional blocs’ intra and inter-linkages of value-added from 1995 to 2011. In our study, we investigate Factory North America (United States, Canada, and Mexico), Factory Asia (Association of Southeast Asian Nations—ASEAN,2 and Eastern Asia—EASIA3), Factory Europe (European Union—EU284) for comparisons, and more importantly for our purposes, Factory South America (Argentina, Brazil, Chile, Colombia, Brazil, and Peru).5
Our analysis focuses on the integration pattern of South American countries, not Latin America (which would incorporate both Mexico and Costa Rica6), for three reasons. First, Mexico is commonly listed as one of the countries of Factory North America. Second, Mexico and Costa Rica are more connected with North American supply chains in downstream stages, reflecting country-specific features quite different from South American countries. In other words, the regional blocs portrayed by the GVC literature reflect a series of region-specific characteristics, ranging from geographic distance, natural barriers, and the existence of regional integration agreements. Third, South America is usually considered a missing region in the era of global value chains, along with Sub-Saharan Africa, while several emerging markets are joining and taking advantage of becoming more integrated into international production networks. Therefore, considering the proximity and similarity of the South American countries’ characteristics and the potential benefits usually associated with GVC integration, it seems reasonable to advance in studies about the GVC integration pattern of the region and its shifts over time. However, this is the first study based on IIO tables that we are aware of that deals specifically with the countries of South America as a regional bloc.
In our empirical work, we consider a set of measures in value-added terms to illustrate intra and inter-linkages of regional blocs. First, we characterize the GVC participation of Factory South America and compare it with other regional blocs based on the overall levels of participation and their regional, global, and sectoral dimensions. Then we investigate the origin and destination of value-added trade through backward and forward linkages across different countries or regions. Further, we advance the understanding of the interdependence between countries and regions by constructing a new version of the hubness indicator developed by Baldwin (2004),7 offering a novel perspective on the regionalization of GVCs. Our contribution to the hub-and-spoke trade literature is that we employ value-added trade data to perform a comprehensive empirical analysis of how hub-and-spoke arrangements have changed the degree of each country’s relative market dependence on other countries within and across regions. The findings from this paper suggest that inter-regional linkages between Factory South America and Factory Asia, especially China but also with other Asian countries, have increased importance during the acceleration of globalization. The more significant inter-regional linkages between Factory Asia and Factory South America were followed by stronger trade linkages within Asian countries, with China as a hub. Additionally, China expanded its influence beyond Factory Asia and acted as a hub-nation for Factory South America. Our findings also suggest that Brazil is the leading South American country with the potential to become a regional hub, and the Brazilian domestic market played a crucial role in deepening its integration into global and regional value chains.
This paper is organized as follows. “What About Regional Value Chains?” section presents a brief survey of the regional dynamics of global value chains. “Evidence from Trade Linkages Intra and Inter-regional Blocs: “Factory South America”?” section shows empirical results on intra and inter-regional trade linkages and the hubness measure from value-added trade to investigate the relative market interdependence across countries. “Conclusions” section summarizes our discussion and concludes.
What About Regional Value Chains?
This section cultivates some common ground for approaching the regional segmentation of global value chains by tracking the development of relevant studies. While this section was not designed to be an exhaustive literature survey, it focuses only on studies that consider the input–output relations of cross-border production sharing, which is the backbone of GVC studies. Faced with the international fragmentation of value chains, a key research question is to what extent this process is mainly regional or global.
Los et al. (2015) investigated the contrasting forces toward regionalization versus globalization in the organization of production networks. To this end, they extended the fragmentation measure by Feenstra and Hanson (1999) and applied it to the World Input–Output Database (2013 release) for 1995–2011. The authors found a dominant tendency of increasing global fragmentation instead of more segmentation into regional blocs. This means that international fragmentation has occurred mainly within countries outside the regional blocs, which they named “Factory World.”
Conversely, the growing body of literature on GVCs provides valuable insights indicating strong regional dynamics in global production sharing. Baldwin (2006, 2011) suggests that the global dispersion of production stages, i.e., the second unbundling of globalization,8 is a regional process, and not global as it could be expected by taking the concept of “global value chains.” According to the author, geography matters for joining a supply chain, which has become regionalized rather than globalized, while more complex and interconnected over time. The geographical configuration of the second unbundling is not constant, and its spatial scale may change over time (Gereffi 2014). In this sense, the author pointed to a possible change of orientation from global toward more regionally oriented supply chains since the 2008 global economic crisis and the following “great trade collapse,” with emerging economies becoming an important end market. Furthermore, Degain et al. (2017) calculated the weight of intra-regional exports and imports in trade in intermediate and final manufactured goods between 1995 and 2015 for three regional blocs,9 and the rest of the world, and also found that GVCs are mainly organized at the regional level, despite the upsurge in globalization tendency before the recent global financial crisis. Johnson and Noguera (2012) also support that geographical distance matters for bilateral trade in value-added across countries, as well as trade agreements. In further studies, Baldwin and Lopez-Gonzalez (2013, 2015) describe “global value chains” as a buzzword that is inaccurate in aggregate and claim that proximity matters enormously even within regions.
Bear in mind that the architecture of production networks on a regional basis will be in line with strategies of multinational corporations (MNCs) of strengthening local or regional linkages rather than global ones. As argued by Yun (2003), the production networks and foreign direct investment (FDI) operated by MNCs from US, Japan, and Western Europe have shown how the phenomenon of “globalization of production” should actually be recognized as “global regionalization.”
Baldwin and Lopez-Gonzalez (2015) found that Factory North America is responsible for the most intensive supply-chain trade relationships, while it is mainly a simple hub-spoke structure and the I2P10 is mostly bilateral. In contrast, Factory Asia is not taken as a hub-and-spoke but as a network pattern, in which processing commonly occurs in multiple nations and generates the so-called “triangle trade.” Overall, the US, Germany, and China act as hubs in their respective regions. Even though Japan shows a more regionalized supply trade than the US, Germany, and China, it is not considered a hub in Factory Asia. When looking at the changes between 1995 and 2009, the authors found that supply-chain trade has changed heavily towards Factory Asia and away from Factory North America and Europe, with China increasing its role both as seller and buyer.11
Baldwin and Forslid (2014) draw some facts concerning the development of Factory Asia. Regardless of whether it is measured in gross or value-added terms, the first noteworthy fact is the rapid (and uneven) growth of exports from the emerging East Asian countries. Second, most economies in Factory Asia saw their value-added export growth being driven by manufactured exports, while only three countries (Hong Kong, Singapore, and Japan) had services exports and other three countries (Brunei Darussalam, Vietnam, and Cambodia) had natural resource-based export playing an important role in VA export growth. Overall, they show that Factory Asia has been deepening its participation in international supply chains, in a process that includes new nations such as Vietnam, and changing what was once a simple triangle trade (especially between low-wage nations) to a much more complex interconnection between Asian economies, where the “factory economies” became both makers and buyers of intermediate inputs. Moreover, Walmsley et al. (2014) illustrated that almost 75 percent of intra-regional trade within Asia is composed by intermediate goods, while intermediates constitute almost half of Asian exports to outside Asia. This picture is in accordance with the general characterization of Factory Asia by Baldwin and Forslid (2014).
More recently, Ito and Vézina (2016) investigated the geographic extension of the value-added fragmentation of Factory Asia by decomposing the value-added content of its exports and also dissecting all of its final production, even if the final product is not exported. Their results show that the share of foreign value added embedded in Factory Asia’s final production rose between 1990 and 2005, and that China’s production of final goods is composed by a smaller share of foreign value added than any other Factory Asia country. Apparently, China turned to be one of the main sources of value added to other countries’ production among Factory Asia countries. They also found that country industries at the upstream and downstream extremities of the value chain actually embed larger shares of value added compared to intermediate stages, confirming the smile curve format at multi-sector international level. Despite not using IIO tables, Zebregs’ (2004) study on the key factors behind the rapid growth in intra-regional trade is worth mentioning. It is shown that intra-regional trade in emerging Asia is mostly the outcome of the ongoing geographical dispersion of production processes, in which higher-wage countries are specializing in the production of components and low-wage countries become responsible for most of the assembly operations. This has risen trade in intermediate goods among emerging Asian countries, even though the EU, Japan, and the United States remain as the main export markets for final goods.
Another important lesson extracted from Baldwin and Lopez-Gonzalez (2015) is that there are important differences in the global patterns of intermediate industrial goods, raw materials, and services. More specifically, there is a greater regionalization of intermediate industrial goods’ trade compared to the pattern of intermediate services, which is still more regionalized than the global pattern for raw materials. This adds important insights to thinking about the specialization pattern of Factory South America.
Cadestin et al. (2016) analyzed the extent of GVC participation of a set of selected Latin American countries, including Mexico and Costa Rica. These authors aimed to investigate how the GVC integration of the region is affected by some trade policy-related measures and, in that sense, the first step was to characterize GVC participation in Latin America and compare it with other regions. The authors showed that the nature and degree of GVC participation across the region are quite heterogeneous. This recognition is in some degree related to the inclusion of the two countries that are more specialized in processing and exporting inputs as well as more integrated with North American supply chains in their analysis, i.e., Mexico and Costa Rica, while the rest of the pool of countries is more specialized in upstream mining and agricultural inputs that are mainly exported to Asian markets. The results are in agreement with those of other studies that find lower shares of intra-regional GVC participation compared to extra-regional links and particularly weak intra-regional links when compared to the rest of the developing world (Blyde 2014). These studies argued that Latin American countries strongly rely on natural resource-based inputs to integrate into GVCs, becoming considerable vulnerable to external shocks. Overall, Latin American countries seem to be below their potential for GVC integration, although it is important to note that measures of GVC participation and comparisons with other regions are not enough to conclude whether a country with higher participation index is doing better or worse in GVCs.
Recently, some studies have shown the limits of the GVC approach to tackle how local, national, or regional institutions influence upgrading opportunities in GVCs. An alternative theoretical framework is under development to address international competitiveness by integrating the GVC approach and the innovation systems perspective (Pietrobelli and Rabellotti 2011; De Marchi et al. 2018; Lee et al. 2018; Lundvall 2016). For instance, Kejser and Iizuka (2018) showed that, in some cases, regional and local value chains may offer more accessible opportunities to learn and acquire initial production capabilities.
Building from these theoretical perspectives, one may question whether the organization of regional production networks may increase the ability of underdevelopment countries to become innovation leaders to some extent. There is no simple and universal answer to this question. However, a potential answer will undoubtedly involve the effects of the proximity between the manufacturing process and the ability to innovate (Berger 2013), the unequal distribution of Intellectual Property Rights (IPR) rents (Durand and Milberg 2020), learning mechanisms within and outside the value chains (De Marchi et al. 2018; Park and Gachukia 2021), and the characteristics of the relevant knowledge base, as well as its cumulative and collective character (Dosi and Nelson 2018).
Evidence from Trade Linkages Intra and Inter-regional Blocs: “Factory South America”?
Stylized Facts
This section presents some of the most striking features regarding intra and inter-linkages in value-added trade of regional blocs. The section draws on the OECD Trade in Value-Added (TiVA) database for the period 1995–2011, which is the full span of the TiVA database, to characterize the pattern of participation of Factory South America in global and regional value chains and compare it with other regional blocs. As already explained in the introduction, we chose this database version because it portrays the investigated period of globalization acceleration. The pattern of vertical specialization presented by the countries of South America did not show considerable changes over the period, and therefore, we chose to present only the years that mark the beginning and end of the time series.
Figure 1 shows the overall participation in GVCs through backward and forward linkages across regional blocs in 1995 and 2011.12 Compared to other regional blocs, Factory South America is the least integrated to global value chains. Chile is the country with the strongest GVC links in 1995 and 2011 (33.9% and 52.1%) and is followed by Peru (48.7% in 2011), Colombia (38.6%), Brazil (35.6%), and Argentina (30.8%). However, Factory South America is also the regional bloc that has increased the most its total participation in GVCs considering both intra and inter-regional trade over the analyzed period. While region specialization in Factory Europe and Factory Asia is mainly in backward linkages, Factory South America acts as a supplier of inputs, especially primary products, to other countries’ exports. Abundant in natural resources, South America has also been impacted by China’s search for food security, as the Chinese economy has experienced unprecedented levels of development, with changes in demographics and consumption habits that turned the country increasingly dependent on food imports (Cáceres and Ear 2011). Although South America continues to lag behind in GVC participation, its forward linkages (i.e., the share of domestic value-added embodied in foreign exports) has increased more than any other region, and more than its backward linkages.
Fig. 1.
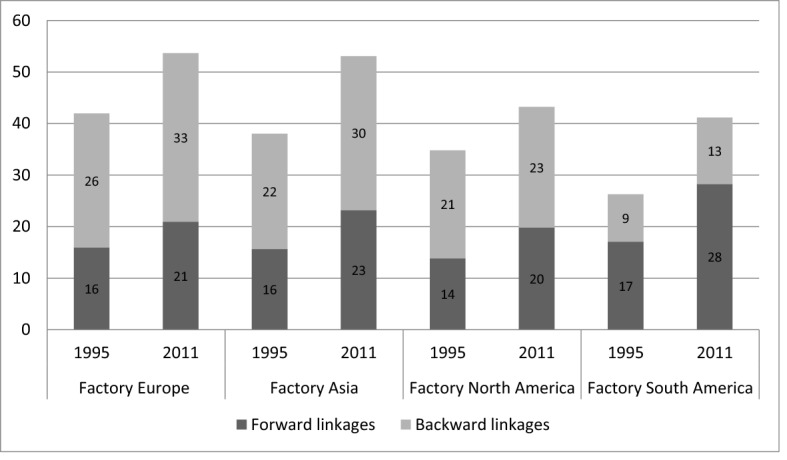
Participation in global value chains through backward and forward linkages, regional blocs (in average), 1995 and 2011 (percentage of total gross exports).
Source Own elaboration based on OECD-WTO TiVA database (December 2016)
We found a similar pattern across the region while assessing backward and forward linkages of each South American country separately (Fig. 2). All countries had higher forward linkages compared to backward linkages in 1995 and 2011. In contrast to the other countries in the region, Argentina presented a higher rate of growth of backward than forward linkages, revealing changes in its specialization pattern towards downstream activities of GVCs. Chile and Argentina are the countries with the highest GVC participation through backward linkages (20.2% and 14.1%, respectively), while Peru and Chile showed the highest forward participation ratios (36.9% and 31.9%, respectively) in 2011.
Fig. 2.
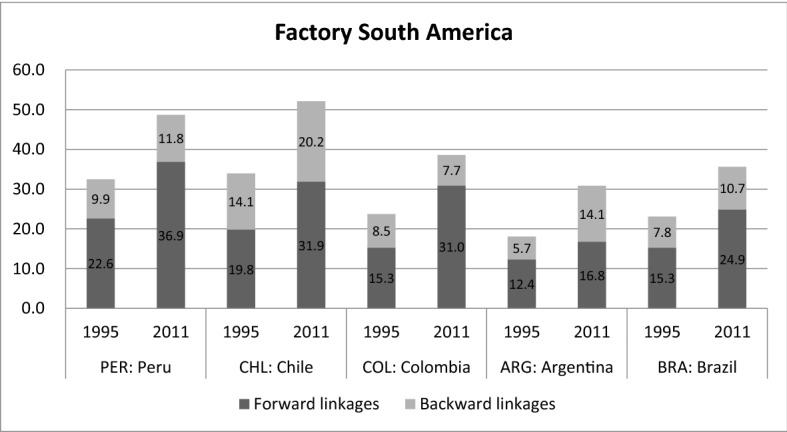
Backward and forward linkages of Factory South America’s countries, 1995 and 2011 (percentage of total gross exports).
Source Own elaboration based on OECD-WTO TiVA database (December 2016)
Figure 3 depicts the decomposition of value-added export growth from 1995 to 2011 by broad sector—focusing on primary, manufactured, and service exports. The up-left panel shows a wide diversity among the countries of Factory Asia, although manufactured exports remain as the main source of growth for most of them. In general, some emerging markets expanded their export growth mostly relying on the booming demand for commodities, while others accomplished it via manufactured goods (Baldwin and Forslid 2014). Primary exports account for a large share of the value-added export growth of ASEAN countries, except for Singapore, while the Eastern Asian countries—Japan, Korea, China, Hong Kong (China), and Chinese Taipei (Taiwan)—have seen their services exports playing an important role together with those of manufactured in VA export growth.13 Compared to other regional blocs, Factory South America is the one with the lowest diversity of sources of growth. In that sense, the importance of primary exports is visible, and, in addition to that of manufactured, these exports account for about three quarters or more of value-added export growth.
Fig. 3.

Decomposition of value-added export growth by broad sector, regional blocs, 1995–2011.
Source Own elaboration based on OECD-WTO TiVA database (December 2016)
Factory South America is the regional bloc where services exports are less significant, on average, to explain VA export growth. The opposite is true for Factory Europe countries, for which services exports account for most of the VA export growth, as is the case in smaller economies such as Luxembourg, Cyprus, and Malta. Looking in detail at Factory North America, the contribution of services and manufacturing exports was very similar in the United States (almost half and half), while primary and manufacturing exports together account for more than two thirds of the VA export growth of Mexico and Canada.
Beyond portray different patterns of specialization across the four regional blocs, Fig. 3 illustrates a reflection of very different production structures and technological capacities. In that sense, as technology and production structures interact, the countries of Factory South America become more vulnerable to falling into a “low-growth trap.” This means that the heterogeneity of production structures and building capacities creates imbalances in international trade. While deficit countries, particularly of less diversified structures adverse to innovation, such as the case of South American countries, respond with fiscal austerity and lowering real wages, aggregate demand and employment rates collapse, resulting in greater inequality and reinforcing the recessionary bias in a vicious circle (ECLAC 2016).
The regional and global dimensions of GVC participation through backward and forward linkages are evident when the origin and destination of value-added trade is considered (Tables 3, 4, 5, and 6 in Appendix). As our particular interest concerns the trade linkages of South America and, as previously discussed in the introduction, the expansion of China’s bilateral trade with South American countries may trigger other trade linkages within Asian countries, we choose to look at the origin and destination of VA trade in details for Factory South America and Factory Asia. At the same time, Factory North America and Factory Europe were represented by their respective hubs, USA and Germany.
Table 3.
Backward linkages across countries or regions, 1995

Source Own elaboration based on OECD-WTO TiVA database (December 2016). Note red-marked entries indicate backward linkages higher than 5.0%, and null linkages are shown in blank
Table 4.
Backward linkages across countries or regions, 2011

Source Own elaboration based on OECD-WTO TiVA database (December 2016). Note red-marked entries indicate backward linkages higher than 5.0%, and null linkages are shown in blank
Table 5.
Forward linkages across countries or regions, 1995

Source Own elaboration based on OECD-WTO TiVA database (December 2016). Note red-marked entries indicate backward linkages higher than 5.0%; and null linkages are shown in blank
Table 6.
Forward linkages across countries or regions, 2011

Source Own elaboration based on OECD-WTO TiVA database (December 2016). Note red-marked entries indicate backward linkages higher than 5.0%, and null linkages are shown in blank
Tables 3 and 4 in Appendix present the GVC participation through backward linkages across different countries or regions for the years 1995 and 2011. Each entry represents the origin of VA embodied in column nation’s gross exports—for instance, where row country Brazil meets column (partner) country Argentina the 0.9% indicates the share of value-added that Argentina uses from Brazil to produce a unit of gross exports and 5.7% is the total foreign value-added embodied in Argentina’s gross exports, while 94.3% accounts for its domestic value-added (Table 3 in Appendix).
In 1995, South American countries showed generally weaker backward linkages within the region, mainly from Argentina and Brazil, than with other regional blocs. Most of the foreign value-added used by Factory South America to produce a gross exports unit comes from Factory North America, more specifically the United States, and from Factory Europe. In some cases, such as in Argentina and Brazil, the United States represented more than 85% of the value-added from Factory North America. But this picture has changed. Brazil's intra-regional links as a source of foreign value-added within the region has increased considerably during the period analyzed. For example, Brazil provided 0.9% and 0.7% of value-added to Argentina and Chile’s exports in 1995, respectively, and these shares have risen to 3.4% and 2.4% in 2011. In the case of Argentina, this increase is so significant that Brazil is then placed as the leading supplier of foreign VA incorporated to a unit of Argentina’s gross exports. Overall, the whole group of South American countries has increased their presence as sources of foreign VA within the region, apart Argentina.
Considering the role of Factory Asia as a supplier of inputs for export processing across the South American region, the backward links with the Eastern Asian countries are higher compared to ASEAN countries (see the empty quadrant between ASEAN and South American countries). Among the Asian countries, Japan is no longer the leading supplier of value-added to Factory South America, a role now occupied by China. The rise of China as an input provider is a significant development at the global level over 1995 and 2011, as addressed by Cadestin et al. (2016), and it is also significant at the regional level, as shown here. It is worth noting that South American countries, on average, still use larger shares of foreign value-added from Brazil than from China to produce a unit of gross exports in 2011. But individually, Peru and Colombia started to use more Chinese value-added than Brazilian value-added in their exports.
Considering the role of Factory South America as a supplier of inputs for export processing across Factory Asian countries, it is evident that both regions have become more interconnected. The role played by Factory South America as a source of foreign value-added to Asian gross exports is more relevant than the contrary, which partially reflects the composition of production and trade of both regions and their GVC positions. Furthermore, Factory Asia has also showed strong GVC links through backward participation within the region. As can be seen by the red highlight14 marked in Tables 3 and 4 in Appendix, Japan was the main hub of backward participation for Factory Asia as a whole in 1995, while China has become the country with the highest GVC participation through backward linkages within Factory Asia’s countries in 2011. Thereby, the greater inter-regional linkages between Factory Asia and Factory South America were followed by stronger intra-regional value-added linkages in Asia with China as a hub.
Tables 5 and 6 in Appendix show the GVC participation through forward linkages with regional and global partners. Each entry represents the destination of VA embodied in row nation’s gross exports—for instance, where row country Brazil meets column (partner) country China the 4.8% indicates the share of Brazilian value-added embodied in Brazil’s gross exports that is used by China for China’s own exports, and 24.9% for row country Brazil indicates the share of Brazilian value-added that is used by all its trading partners for their exports, i.e., the overall forward linkage, while the 75.1% is Brazil’s value-added that is directly exported (Table 6 in Appendix). Following Cadestin et al. (2016), we also find signs of the continuing expansion of GVC trade, as the shares of exports for further processing and export have increased and the share of direct exports15 are falling worldwide. Among the regional blocs, this decline was even greater within the countries of Factory South America, illustrating the expansion of GVC trade in the region.
The forward linkages within South American countries are weaker than with other regional blocs, of which Factories Europe and North America used to be the main partners though Factory Asian countries, mainly China, have taken an increasingly important place. But the share of exporting intermediate goods from Factory South America that is used as inputs by South American countries to produce their own exports—intra-regional forward linkages—has increased between 1995 and 2011, on average. By looking by the lenses of forward linkages, the only exception is Argentina. This loss of forward and backward linkages of Argentina with other countries of its own region bloc acted as a sign to investigate more deeply the relationship between South American and Asian countries and its changes over time. While Argentina became more distant from its South American partners, the country has strengthened its forward linkages with the Asian economies, and relatively more than with other regional blocs, such as Factory North America and Factory Europe.
Actually, this re-orientation towards Asia is comparable to all countries of Factory South America. Our findings show that the South American regional bloc is becoming more engaged in GVCs as suppliers of value-added to Asian countries’ exports than for countries within its own region or from the European Union. All South American countries showed higher increases in their forward links with Factory Asia as a whole (not only China but also East and Southeast Asia), whether compared to the growth with Factory Europe and Factory North America, respectively, although Factory Europe remains as an important hub of forward participation for the region. For instance, the shares of domestic value-added embodied in Peru and Chile’s gross exports that is used by China as inputs for China's exports is 6.6% and 9.3%, respectively, in 2011 (Table 6 in Appendix), while it was 1.0% and 1.3% in 1995 (Table 5 in Appendix).
Even if compared to the countries within Factory Asia, the growth of the shares of South American countries value-added embodied in South American gross exports that are used by Asian countries’ exports is higher, on average. Despite this trend, it is not possible to overlook the magnitude of the forward linkages between Asian countries and China, as highlighted by the red marking in China’s column. Therefore, the Chinese role in shaping the GVC participation through forward linkages of not only Asian but also South American countries has become more pronounced over time. This means that China has been acting as a “headquarter” economy, and its influence overcomes regional boundaries (Baldwin and Lopez-Gonzalez 2013), and as shown here, China’s influence has reached South America. Korea and Japan have also increased their capacity to coordinate regional production of the Asian region—especially of the ASEAN countries—and the South American economies. Finally, although it cannot be said that Factory South America is becoming less integrated in GVCs through backward and forward linkages within the region, the regional bloc has become more and more oriented towards Asian countries, especially from a supplier perspective (i.e., forward GVC participation). In that sense, the rise of inter-regional linkages with Factory Asia, especially China but also with other Asian countries, is an important sign of the changing interconnections between regional blocs.
Hubness Measure from the Perspective of Value-Added Trade
The concept of hub-and-spoke trade systems is not new to the trade literature but, according to Alba et al. (2008), empirical analysis has been limited to a few country-specific studies. An alternative approach to hubness would be to apply social network analysis (SNA) to value-added international trade flows and then calculate measures of density and centrality of intra and inter-regional trade. This possibility is certainly promising and will be explored in future research. However, for the purposes of this article, our hubness measure takes a local perspective on hubness (analogously to degree centrality in network terms).
Originally, Baldwin (2004) developed a hubness measure to illustrate the degree of relative market interdependence between countries from the perspective of international trade, as follows:
| 1 |
where is the hubness of nation B from A’s point of view, is the exports from A to B as a share of A’s total exports, and is B’s imports from A as a share of its total imports. Ranging from 0 to 1, the closer this proxy is to 1, the deeper the dependence of A’s exports on B’s market. This measure was used by Chen and De Lombaerde (2014) to compare the hubness between the BRICS (Brazil, Russia, India, China, and South Africa) and their neighbor countries.
With that in mind, we developed a new version of this proxy to illustrate the degree of relative market interdependence between countries within and across Factory Asia, Factory Europe, Factory North America, and Factory South America from the perspective of value-added trade. This means that, instead of using exports and imports in gross terms, we use variables that can be interpreted as “exports of value-added” and the “imports of value-added”. In other words, our choice reflects the amount of value-added that industries export/import both directly, through exports/import of final goods or services and, indirectly via exports/import of intermediates that reach foreign/domestic final consumers (households, government, business investment) through other countries. This new proxy also varies from 0 to 1, and the closer this proxy is to 1, the deeper the dependence of A’s exports of value-added on B’s market.
| 2 |
where is the hubness of nation B from A’s point of view in value-added terms, shows domestic value added generated by industry i in country A embodied in final demand of country B as a percentage of total domestic value added from industry i in total foreign final demand, i.e., , and gives a value-added perspective of domestic industries’ relative connectedness with other countries and regions, independently of whether domestic (upstream) industries are (or not) direct exporters. In particular, captures the domestic value added of country A embodied in foreign (country B) final demand both directly, through exports of final goods or services, and indirectly via exports of intermediates that encompass foreign final consumers through other countries, and, putting it simply, can be interpreted as “exports of value added.”
Compared to B’s imports from A as a share of its total imports in gross terms, its value-added equivalent,, shows foreign value added generated by industry i in country A embodied in domestic final demand of country B as a percentage of total foreign value added from industry i in B’s domestic final demand, i.e., , indicating a domestic economy’s relative connectedness to production in other countries and regions, whether or not there are direct import from foreign (upstream) industries. In particular, can be interpreted as “imports of value-added,” as it shows how industries abroad (upstream in a value chain) are connected to consumers at home, even when no direct trade relationship exists.
Tables 1 and 2 present a matrix with hubness measures between countries based on the value-added trade flows of total industries in 1995 and 2011, respectively. We combined all economies within Factory South America and with Factory Asia, as well as Factory North America’s countries and the main hub-nation of Factory Europe, Germany. For example, where the country-line Argentina finds the country-column (partner) Brazil, “0.16” (for the year of 2011, Table 2) indicates the relative dependence on Argentina’s exports concerning Brazil’s domestic market. As it will be seen, Brazil is the only candidate hub in South America, showing the highest degrees of relative market interdependence. It is interesting to note that the two South American countries that have the highest participation rates in global value chains, Chile and Peru, also find the highest degree of interdependence of their exports concerning the Chinese domestic market (up from 0.02 in 2005 to 0.15 and 0.17 in 2011, respectively). Furthermore, the level of mutual interdependence considering the US domestic market is high, especially in the case of Colombian exports. However, it is worth noting the loss of influence of the United States in the case of Brazilian, Argentine, and Chilean exports over the period portrayed.
Table 1.
Hubness index in value-added trade flows between countries, 1995

Source Own elaboration based on OECD-WTO TiVA database (December 2016). Note Red-marked entries indicate > 0.1; and values lower than 0.005 are blank
Table 2.
Hubness index in value-added trade flows between countries, 2011

Source Own elaboration based on OECD-WTO TiVA database (December 2016). Note Red-marked entries indicate > 0.1; and values lower than 0.005 are blank. The indices in bold indicate values higher than 0.1 in 1995 and which fell in 2011
One of the most striking developments is the emergence of China as a hub-nation. In 1995, the Chinese market influence was mostly limited to a single neighbor country, Hong Kong (Table 1). Over time, China was able to expand its influence across all Factory Asia countries, dominating a space that was occupied regionally by Japan and globally by the United States during the 1990s.
Similar to Chen and De Lombaerde (2014)’s results based on gross trade values, our findings show that the United States has decreased its influence in the Asian region, in a process that has contributed to the two-hub formation of regionalism especially in the Eastern Asia. Except for Japan, China has overtaken the United States as their most important trade partner. Looking at the regional production sharing network of Factory Asia, Table 2 corroborates Baldwin (2004)’s “bicycle” system of hub-and-spoke arrangements composed of a “Chinese wheel” and a “Japanese wheel.” However, our results point to a loss of Japan’s influence and an increase in the importance of China as a hub over time. Considering the relative market mutual interdependence between the two-hub nations, Japan is no longer a hub-nation from China’s perspective, though China became a hub from Japan’s perspective in 2011. Another important finding is that China’s influence has overflowed beyond the Asian region, and together with the United States, it has been acting as an important hub-nation for Factory South America and positioning itself as a second hub in the region (in some cases, such as Chile, China is already positioned as first hub).
As in Baldwin and Lopez-Gonzalez (2015), we also found that the supply-chain trade relationships across countries of Factory North America are mainly in the form of a hub-to-spoke structure. More importantly, our findings show that the United States has slightly diminished its influence as the main hub-nation over time.
Considering the hubness index calculated for each pair of South American countries, the intra-regional mutual interdependence in Factory South America is weaker than in Factory Asia. Brazil has the most significant influence within the region, acting as a hub for Argentina, which showed the most considerable dependence on the Brazilian domestic market. Meanwhile, Brazil has shown the highest degrees of relative market interdependence when considering the trade connections between South American and Asian economies.
Overall, most countries worldwide have increased its relative dependence on Brazil’s domestic market. Comparing Brazil’s column with its row, our results indicate that the country has more significant relative influence in GVCs from the importance of its domestic market than from its exports. Linking the hubness findings to our characterization of the pattern of participation of Factory South America in global and regional value chains, it seems likely that Brazil has become more integrated because of the importance of its domestic market and not simply through its production of goods that are further exported by a partner country or even by using imports to promote its own exports. This finding is even more interesting if we consider that, at the end of the period of acceleration of globalization, the federal government of Brazil had already implemented several policies that revitalized the domestic market, such as increasing formalization in the labor market and income transfer policies such as the Bolsa Família.
As previously showed, the Brazilian pattern of participation in GVCs is characterized by forward linkages as a primary product supplier and low backward linkages. According to Callegari et al. (2018), even though Brazil has been one of the leading destinations of Foreign Direct Investments (FDI) since the 1990s and has imported considerable quantities of high value-added products, the country has been incapable of enhancing the dynamism of the industry and service sectors. By considering the measure of mutual interdependence between markets in value-added terms, the analysis developed in this paper shows that Brazil’s participation in GVCs is more peculiar than what is usually portrayed by GVC indicators, as such participation in GVCs occurs mainly through the mutual dependence of its domestic market and not through its domestic production of goods and services.
Conclusions
This paper has analyzed the regional dynamics in global production sharing, adding evidence from the geography of global value chains and their regionalization. For the purposes of this study, we have investigated the different regional patterns in GVCs, outlining the regional bloc of South America and its changing structures regarding value-added exports and relative market dependence.
Apart from the opportunities for developing countries to participate in global and regional systems created by the slicing up of value chains, the degree of trade integration of Factory South America is considerably lower compared to the other regional blocs. However, the empirical results show that the South American region has diminished this gap during the late 1990s and 2000s. The degree of participation, of course, varies between sectors and between countries. However, Factory South America has been acting mainly as a supplier of inputs, especially primary products, to other countries’ exports. The absence of a diversified production structure, together with poor technological capacities, has turned the regional bloc more exposed to falling into a “low-growth trap” than other regional blocs.
The findings support that GVC trade has taken the place of direct exports, expanding even more considerably between South American countries. Concerning the origin and destination of value-added trade, most South American countries have been using more and more foreign value-added from other South American countries to produce a unit of gross export, i.e., the intra-regional trade through backward linkages has grown stronger over time. However, compared to the growth of inter-regional links, we have found lower intra-regional backward links, except for Chile and Argentina that have been using increasingly higher shares of Brazilian value-added in their gross exports. Surprisingly, we have found that the inter-regional backward linkages between Factories Asia and South America with the former as a user of South American value-added to produce a unit of gross exports has grown more substantial than the intra-Factory Asian links. One of the most striking features is the upsurge of China as a source of foreign value-added at the global and regional level, becoming the main source of value-added within Factory Asia and lagging behind only from the United States in the relationship with Factory South America.
Meanwhile, we have also found signs of stronger forward linkages within Factory South America, and more importantly, the regional bloc has become more and more oriented towards Asian countries. In addition, the Chinese role in shaping the GVC participation through forward linkages of not only Asian but also South American countries has become more pronounced over time. Thereby, the stronger inter-regional forward linkages between Factory South America and Factory Asian countries were followed by strengthening intra-regional bloc value-added linkages in Asia with China as a main source of inputs. In that sense, one of the most striking developments was the increasing Chinese influence on the production arrangements within its regional partners and beyond its regional boundaries. The role played by China in this changing scenario hides two crucial movements: the strengthening of intra-regional trade links among Asian countries, with economic benefits in terms of productivity, diversification, and sophistication of production; and the rupture of South America intra-regional interconnections, with the decrease in the densification of its production structure without the economic benefits associated with GVCs participation.
Although we cannot say that there is a trend of weakening the South American back and forward intra-linkages in absolute terms, we found that the inter-regional links were much stronger, providing insights to a possible change in the regional dynamics of global production towards Asia with China as a main hub in the context of vertically fragmented production.
Finally, we have looked at the interconnection through trade linkages across countries beyond the traditional indicators of participation in the GVCs. In that sense, we have created a proxy of the degree of relative market interdependence from the value-added perspective. As we addressed the hierarchical organization of production networks around “hubs,” we believe that the analysis of global and regional value chains configuration can gain from the development of this new hubness measure, given its simplicity compared to applying social network analysis. Our findings confirm the rise of China as a hub-nation at the regional and global level. China has deepened its relative market interdependence mainly with other Asian economies but also with South American countries. At the same time, the United States have lost importance as a hub with both regions. Overall, the intra-regional market dependence within South American countries was weaker than that of Factory Asia.
A closer look at the South American region shows that Brazil is the main country with potential to become a regional hub. In fact, when looking at the Brazilian pattern of participation in GVCs and its relative importance in intra-regional trade, our findings support that the forward and backward linkages of its value-added exports have been overshadowed by the relative importance of its domestic market. The peculiar importance of the Brazilian domestic market occurs in an international scenario of hyperglobalization and, in the domestic sphere, of expanding Brazilians’ purchasing power, advancing the formalization of the labor market and income transfer policies. Additionally, our findings contributed to illustrating the complexity behind the political discourse that advocates for increasing participation in GVCs, as the greater possibilities of gains for countries from regions typically taken as poorly integrated in GVCs may come from the creation of regional value chains, which does not appear to be a process that is guided by natural forces independent of domestic policies.
Appendix
Declarations
Conflict of interest
On behalf of all authors, the corresponding author states that there is no conflict of interest.
Footnotes
The 2018 edition of the TIVA database covers the period 2005 to 2015, with preliminary projections to 2016 for some indicators. That said, we choose to use the previous edition (December 2016) since it allows us to analyze the period 1995–2011, coinciding with the acceleration of globalization trends.
Indonesia, Cambodia, Malaysia, Philippines, Brunei Darussalam, Singapore, Thailand, and Vietnam (not included here Lao PDR and Myanmar).
Japan, Korea, China, Hong Kong (China), and Chinese Taipei (Taiwan).
Following TiVA, we considered both EU 15 and EU13 member countries, i.e., Austria, Belgium, Denmark, Finland, France, Germany, Greece, Ireland, Italy, Luxembourg, Netherlands, Portugal, Spain, Sweden, United Kingdom, and Czech Republic, Estonia, Hungary, Poland, Slovak Republic, Slovenia, Bulgaria, Cyprus, Croatia, Lithuania, Latvia, Malta, Romania.
The countries that build the South American regional bloc are in agreement with the list of TiVA countries and represent together 350 millions of people and about 87% of the GDP of all South American countries for the year 2016 (excluding Venezuela due to the absence of data for that year) (calculation based on the World Bank national accounts data, and OECD National Accounts data files).
Considering the list of all Latin American countries available in TiVA database.
Baldwin (2004) discusses hubness from the perspective of how attractive a country is for other nations in the region to be desiring preferential access. He develops a measure of hubness that is based on how much a country’s exports would increase if it would gain access to the hub’s market.
Baldwin (2006) characterizes globalization as two great unbundlings. The first one occurs up to the mid or late 1980s and is considered a linear process driven by lower trade costs, in which consumption and production can be separated by great distances. The second unbundling is driven by the ICT revolution, which turned economically possible to unbundling factories in stages of production that are geographically separated and dispersed to low-wage economies.
Although not based on IIO tables, this study worth mentioning because is the only one that considers the regional bloc “the Americas,” including both North and South America.
The authors consider three basic supply-chain trade concepts: (i) importing to produce (I2P), which encompasses all imported intermediate inputs used in the production of domestic goods; (ii) importing to export (I2E), which considers the intermediates related to exporting; and (iii) value-added trade, which is factor-content trade, i.e., the origin of all primary factor inputs in exports is identified as in Koopman et al. (2014), and Johnson and Noguera (2012), and differently from the previous concepts, it shows where the value was added along a supply chain.
In another study, Baldwin (2012) analyze the contrasting performance of intra-regional trade within Factory Asia and the almost complete absence of formal economic cooperation in the region. The author uses sequencing theory to draw the historical narrative of Europe and Asia’s sequencing, and extract some lessons from the integration sequences.
There are two broad measures of GVC participation: (i) VS: measures the value of imported contents embodied in a country’s exports, and (ii) VS1: measures the value of intermediate exports sent indirectly through other countries to final destinations, i.e., the percentage of exported intermediate goods and services that are used as inputs to produce other countries’ exports (Hummels et al. 2001). On the one hand, the VS share estimate the importance of upstream links, providing a metric of the involvement of a country or industry as a user of foreign inputs (i.e., backward participation). On the other hand, the VS1 share estimates the importance of downstream links, measuring the involvement in GVCs from a supplier perspective (i.e., forward participation) (see Marcato 2018).
Fig. 3 shows that the VA export growth of Hong Kong was driven by services activities (106.4%), while manufacturing contributed negatively with 6.3%. In the case of Cambodia, primary products contributed negatively by almost 1%.
Backward linkages ratios larger than 5% are marked by red highlight.
I.e., exported products that are consumed or processed for consumption in the first country that is importing them.
Publisher's Note
Springer Nature remains neutral with regard to jurisdictional claims in published maps and institutional affiliations.
References
- Alba, J.D., J. Hur, and D. Park. 2008. Effects of hub-and-spoke free trade agreements on trade: Panel data analysis (No. 127). ADB Economics Working Paper Series.
- Baldwin, R. 2004. The spoke trap: Hub and spoke bilateralism in East Asia. CNAEC Research Series 4(2). Seoul.
- Baldwin, R. 2006 Globalisation: The great unbundling(s). Globalisation Challenges for Europe and Finland, 1–51.
- Baldwin, R. 2011. Trade and industrialisation after globalisation’s 2nd unbundling: How building and joining a supply chain are different and why it matters. NBER Working Paper Series, No. 17716. Cambridge.
- Baldwin R. Sequencing Asian regionalism: Theory and lessons from Europe. Journal of Economic Integration. 2012;27(1):1–32. doi: 10.11130/jei.2012.27.1.1. [DOI] [Google Scholar]
- Baldwin R, Forslid R. The development and future of factory Asia. In: Ferrarini B, Hummels D, editors. Asia and Global Production networks: Implications for trade, incomes and economic vulnerability. Cheltenham: Edward Elgar Publishing; 2014. [Google Scholar]
- Baldwin, R., and J. Lopez-Gonzalez. 2013. Supply-chain trade: A portrait of global patterns and several testable hypotheses. NBER Working Paper Series, No. 18957. Cambridge.
- Baldwin R, Lopez-Gonzalez J. Supply-chain trade: A portrait of global patterns and several testable hypotheses. World Economy. 2015;38(11):1682–1721. doi: 10.1111/twec.12189. [DOI] [Google Scholar]
- Berger S. Making in America from innovation to market. Cambridge: MIT Press; 2013. [Google Scholar]
- Blyde J. Synchronized factories: Latin America and the Caribbean in the era of global value chains. Washington: Springer; 2014. [Google Scholar]
- Cadestin, C., Gourdon, J., and P. Kowalski. 2016. Participation in global value chains in Latin America. OECD Trade Policy Papers, no. 192.
- Cáceres SB, Ear S. China’s natural resource appetite in Brazil. Asian Journal of Latin American Studies. 2011;24(2):69–89. [Google Scholar]
- Callegari J, Melo TM, Carvalho CE. The peculiar insertion of Brazil into global value chains. Review of Development Economics. 2018;22(3):1321–1342. doi: 10.1111/rode.12386. [DOI] [Google Scholar]
- Chen L, De Lombaerde P. Testing the relationships between globalization, regionalization and the regional hubness of the BRICs. Journal of Policy Modeling. 2014;36(1):111–131. doi: 10.1016/j.jpolmod.2013.10.011. [DOI] [Google Scholar]
- De Marchi V, Giuliani E, Rabellotti R. Do global value chains offer developing countries learning and innovation opportunities? The European Journal of Development Research. 2018;30(3):389–407. doi: 10.1057/s41287-017-0126-z. [DOI] [Google Scholar]
- Degain C, Meng B, Wang Z. Recent trends in global trade and global value chains, measuring and analyzing the impact of GVCs on economic development. Washington: World Bank Publications; 2017. pp. 37–68. [Google Scholar]
- Dosi G, Nelson R. Technological advance as an evolutionary process. In: Nelson R, Dosi G, Helfat CE, Pyka A, Saviotti PP, Lee K, Winter SG, Dopfer K, Malerba F, editors. Modern evolutionary economics: An overview. Cambridge: Cambridge University Press; 2018. pp. 35–73. [Google Scholar]
- Durand C, Milberg W. Intellectual monopoly in global value chains. Review of International Political Economy. 2020;27(2):404–429. doi: 10.1080/09692290.2019.1660703. [DOI] [Google Scholar]
- ECLAC - Economic Commission for Latin America and The Caribbean . Latin America and the Caribbean in the World Economy. Santiago: United Nations Publication; 2016. p. 168. [Google Scholar]
- Feenstra RC, Hanson GH. The impact of outsourcing and high-technology capital on wages: estimates for the United States, 1979–1990. The Quarterly Journal of Economics. 1999;114(3):907–940. doi: 10.1162/003355399556179. [DOI] [Google Scholar]
- Gereffi G. Global value chains in a post-Washington Consensus world. Review of International Political Economy. 2014;21(1):9–37. doi: 10.1080/09692290.2012.756414. [DOI] [Google Scholar]
- Hummels D, Ishii J, Yi K. The nature and growth of vertical specialisation in world trade. Journal of International Economics. 2001;54(1):75–96. doi: 10.1016/S0022-1996(00)00093-3. [DOI] [Google Scholar]
- Ito T, Vézina P. Production fragmentation, upstreamness, and value added: Evidence from Factory Asia 1990–2005. Journal of the Japanese and International Economies. 2016;42:1–9. doi: 10.1016/j.jjie.2016.08.002. [DOI] [Google Scholar]
- Johnson RC, Noguera G. Accounting for intermediates: Production sharing and trade in value added. Journal of International Economics. 2012;86(2):224–236. doi: 10.1016/j.jinteco.2011.10.003. [DOI] [Google Scholar]
- Keijser C, Iizuka M. Looking beyond global value chains in capacity development: The case of the IT-enabled service (ITES) sector in South Africa. The European Journal of Development Research. 2018;30(3):442–461. doi: 10.1057/s41287-017-0110-7. [DOI] [Google Scholar]
- Koopman R, Wang Z, Wei S. Tracing value-added and double counting in gross exports. American Economic Review. 2014;104(2):459–494. doi: 10.1257/aer.104.2.459. [DOI] [Google Scholar]
- Lee K, Szapiro M, Mao Z. From global value chains (GVC) to innovation systems for local value chains and knowledge creation. The European Journal of Development Research. 2018;30(3):424–441. doi: 10.1057/s41287-017-0111-6. [DOI] [Google Scholar]
- Los, B., M. Timmer, and G. Vries. 2013. Made in Europe? Trends in international production fragmentation. GGDC Research Memorandum, no 131. Groningen.
- Los B, Timmer M, De Vries GJ. How global are global value chains? A new approach to measure international fragmentation. Journal of Regional Science. 2015;55(1):66–92. doi: 10.1111/jors.12121. [DOI] [Google Scholar]
- Lundvall B. The learning economy and the economics of hope. London: Anthem Press; 2016. [Google Scholar]
- Marcato, M.B. 2018. Trade integration in a vertically fragmented production structure. PhD thesis, University of Campinas, Brazil.
- Park E, Gachukia MKE. The role of the local innovation system for inclusive upgrading in the global value chain: The case of KenyaGAP in the Kenyan Horticultural Sector. The European Journal of Development Research. 2021;33(3):578–603. doi: 10.1057/s41287-020-00285-w. [DOI] [Google Scholar]
- Pietrobelli C, Rabellotti R. Global value chains meet innovation systems: Are there learning opportunities for developing countries? World Development. 2011;39(7):1261–1269. doi: 10.1016/j.worlddev.2010.05.013. [DOI] [Google Scholar]
- Rodrik D. The globalization paradox: Democracy and the future of the world economy. New York: WW Norton & Company; 2011. [Google Scholar]
- Rodrik, D. 2016. The abdication of the left. Project Syndicate 11.
- Subramanian, A., and M. Kessler. 2013. The hyperglobalization of trade and its future. Working Paper: Peterson Institute for International Economics 41(202):1–66.
- Walmsley TL, Hertel T, Hummels D. Developing a GTAP-based multi-region, input–output framework for supply chain analysis. In: Ferrarini B, Hummels D, editors. Asia and global production networks: Implications for trade, incomes and economic vulnerability. Northampton: Edward Elgar Publishing; 2014. pp. 16–80. [Google Scholar]
- Yun C. International production networks and the role of the state: Lessons from East Asian developmental experience. The European Journal of Development Research. 2003;15(1):170–193. doi: 10.1080/09578810312331287425. [DOI] [Google Scholar]
- Zebregs, H. 2004. Intraregional trade in emerging Asia. IMF Policy Discussion Paper, IMF Policy Discussion Paper Asia, no 4. Washington, D.C.