Abstract
Head and neck squamous cell carcinoma (HNSC) is a widely known malignancy which is usually diagnosed late and has a poor prognosis. This study focuses on finding a new gene linked with CD8+ T cell infiltration as a prognostic marker for patients with HNSC. Differential analysis of transcriptomic data was performed between HNSC and control tissues from TCGA and GEO database. The CD8+ T cell infiltration score was quantified using single-sample gene set enrichment analysis (ssGSEA). Weighted gene co-expression network analysis (WGCNA) algorithms were used to identify key modules associated with CD8+ T cell infiltration. Kaplan-Meier (K-M) survival analysis was used to compare overall survival (OS) between the 2 groups. Univariate and multivariate Cox analyses were used to assess independent prognostic markers. The results showed CD8+ T cell infiltration score was an independent favorable prognostic marker in HNSC. Differential analysis and WGCNA identified 93 differential gene related to high CD8+ T infiltration. Amog the 93 genes, ALDH2 was an independent favorable prognostic marker in HNSC. ALDH2 expression was found to be much lower in HNSC, and patients with low ALDH2 expression had higher T stage and N stage. The correlation analysis showed that ALDH2 was linked with immune cell infiltration in the tumor microenvironment of HNSC. Patients having increased expression of ALDH2 tend to be sensitive to immune checkpoint inhibitors (ICIs). In addition, we showed the relationship between ALDH2 expression and chemotherapeutic drug sensitivity. In conclusion, this study identified ALDH2 as a prognostic marker, associated with CD8+ T cell infiltration in HNSC.
Keywords: ALDH2, CD8+ T cell, HNSC, prognostic marker, tumor microenvironment, bioinformatics
Introduction
Head and neck squamous cell carcinoma (HNSC) is the sixth most common cancer worldwide.1 There are 890 000 new cases of HNSC and 450 000 deaths reported annually around the world, as per the 2018 Global Cancer Report.1 The overall incidence of the disease continues to rise due to an increase in the subset of cancers caused by human papillomavirus (HPV). Moreover, up to 66% of these HNSC patients are diagnosed at the advanced (III or IV) stage, and about 10% of the HNSC patients develop distant metastases.2 Surgery, radiotherapy, and chemotherapy are currently used as the comprehensive treatment regime for this disease. However, the success rate of radiotherapy in locally advanced patients remains low. Patients with recurrent or metastatic disease have a poor prognosis and considerably few treatment options.3 Consequently, treatments that are less toxic and have a high efficacy are urgently required, along with the search for reliable prognostic biomarkers to help in the timely diagnosis of HNSC patients. Immunotherapy can increase the effectiveness of the anti-tumor response via the immune system while remaining relatively non-invasive compared to conventional therapies.4 CD8+ T cells can be activated to cytotoxic CD8+ T lymphocytes (CTL) in a process named tumor immune circulation. CTL is an important component of the body’s anti-cancer immune machinery. They are the immune cells of the first choice for targeting tumors. The density of CD8+ T cells at the site of tumor invasion is a predictor of immune checkpoint inhibitors (ICIs) therapy outcome.5
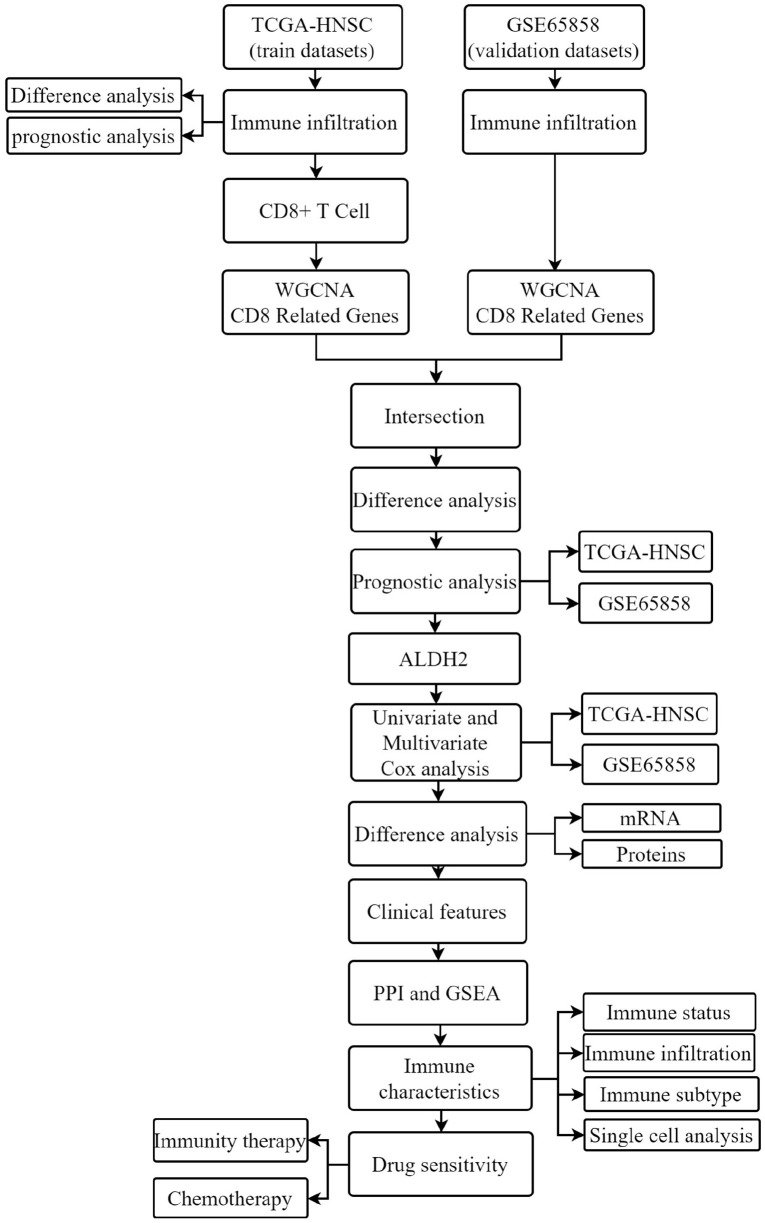
Increased CTL activity can produce a durable anti-tumor response, indicating a positive prognostic marker in various solid tumors. In contrast, tumors can hijack this system by up-regulating immune checkpoint receptors and their ligands, thereby inhibiting CTL activity.6 T cell depletion may be a major limitation to the long-term efficacy of therapies that activate the human immune system. Therefore, understanding its development while searching for core genes associated with high CD8+ T cell infiltration is essential to advancing immunotherapy.7 In this study, biomarkers closely associated with CD8+ T cell infiltration in HNSC were identified by bioinformatics analysis, and ALDH2 was found to be the core gene for this study. Research has shown that ALDH2 dysfunction is closely associated with cancer development. ALDH2 is double-edged, showing anti-cancer effects by simultaneously reducing the damaging effects of aldehydes and promoting drug resistance and signal transduction cell survival.8 However, its relationship with clinicopathological factors and the prognostic value of HNSCC has not yet been elucidated. For this purpose, an in-depth understanding of the relationship between ALDH2 and HNSC could provide new strategies for targeting ALDH2 to treat HNSC patients. Figure 1 shows the flow chart of this study.
Figure 1.
Flow chart of this research.
Methods
Data download
The RNA sequencing and clinical data of 501 HNSC and 41 control tissues were included in this TCGA-HNSC project. The data was obtained from the UCSC Xena website (http://www.genome.ucsc.edu/index.html). The transcriptome and clinical data of 270 HNSCs were taken from the GEO database using the dataset number GSE65858 (https://www.ncbi.nlm.nih.gov/).
Differential analysis
The “Limma” package in R software 4.1.1 was employed to perform differential analysis of transcriptome data comparing the 2 groups (501 HNSC and 41 control tissues). The significant differences in analysis results were considered as expression fold change (FC) ⩾ 2, and the P value (FDR) ⩽ .05 was corrected.
Immune infiltration
The immune infiltration and immune status scores of patients with HNSC were evaluated by the ssGSEA algorithm in TCGA and GSE65858 datasets. The immune, stromal, and Estimate scores of TCGA-HNSC samples were measured using the ESTIMATE algorithm. Furthermore, with the help of the TISCH database, the expression of ALDH2 in different subclasses of immune cells was explored at the single-cell level (http://tisch.comp-genomics.org).9 The correlation between immune subtypes and ALDH2 expression was analyzed and visualized by the TISIDB database (http://cis.hku.hk/TISIDB).10
Survival analysis
Overall survival (OS), progression-free interval (PFI), and disease-specific survival (DSS) were the prognostic indicators. Kaplan-Meier survival analysis and long rank test was used to compare survival outcomes between 2 groups. Univariate and multivariate Cox analyses were used to identify independent prognostic factors.
Weighted gene co-expression analysis (WGCNA)
The WGCNA package in R software version 4.1.1 was used to develop the co-expression network. Initially, the samples were grouped to identify any major outliers. Secondly, the co-expression network was developed by the automatic network construction function. The R function pickSoftThreshold was used to measure the soft threshold power β, for which the co-expression similarity was proposed to calculate the adjacency. Afterward, the modules were detected using hierarchical clustering and the Link Cut Tree function. Furthermore, the gene significance and module affiliation were calculated to link the modules with CD8+ T cell infiltration. Genes from corresponding module were extracted for further assessment.
Functional enrichment analysis
Functional enrichment analysis was performed by Metascape, a website designed to provide annotation of genes.11 For the GSEA enrichment analysis, the gmt file “c2 KEGG gene set” was downloaded from the MSigDB database (https://www.gsea-msigdb.org/gsea/msigdb/index.jsp) that has canonical pathways taken from the KEGG database. Then, based on c2 KEGG, the GSEA analysis was completed using the “clusterProfiler” package in R software version 4.1.1 (significant enrichment was determined by P-value < .05 and q-value < 0.25).
Drug therapy sensitivity analysis
Tumor Immune Dysfunction and Exclusion (TIDE) algorithm was used to predict ICIs sensitivity in HNSC patients in the TCGA database. In general, patients with high TIDE scores lack sensitivity to ICIs.12 Furthermore, based on gene expression patterns, the ImmuCellAI database could accurately predict the responsiveness of cancer patients to immunotherapy. The database was further utilized to estimate the immunotherapy sensitivity of 501 HNSC patients in the TCGA database.13 The Gene Set Cancer Analysis (GSCA) database was used to observe the link between ALDH2 expression levels and chemotherapeutic drug susceptibility.
UALCAN database
The UALCAN (http://ualcan.path.uab.edu) database can analyze the proteomic data in the CPTAC database.14 In this study, UALCAN was employed to analyze the differential expression of ALDH2 between HNSC and normal tissues at the protein level.
GeneMANIA database
The GeneMANIA database (http://genemania.org/) was used for the assessment of the protein-protein interaction (PPI) network and functional annotation of the proteins in the network.15
Statistical analysis
In this research, a paired-samples t-test was employed to compare the differences between paired samples. A t-test or Mann-Whitney U-test was used to compare continuous variables in 2 data groups based on the normal distribution. Kruskal Wallis test was employed to compare continuous variables in the 3 groups of samples. Correlation analyses adopted Spearman analysis. All analysis was done in R software, and P values ⩽ .05 were considered significant (*, P < .05; **, P < .01; ***, P < .001).
Results
Association of CD8+ T cells with OS in HNSC
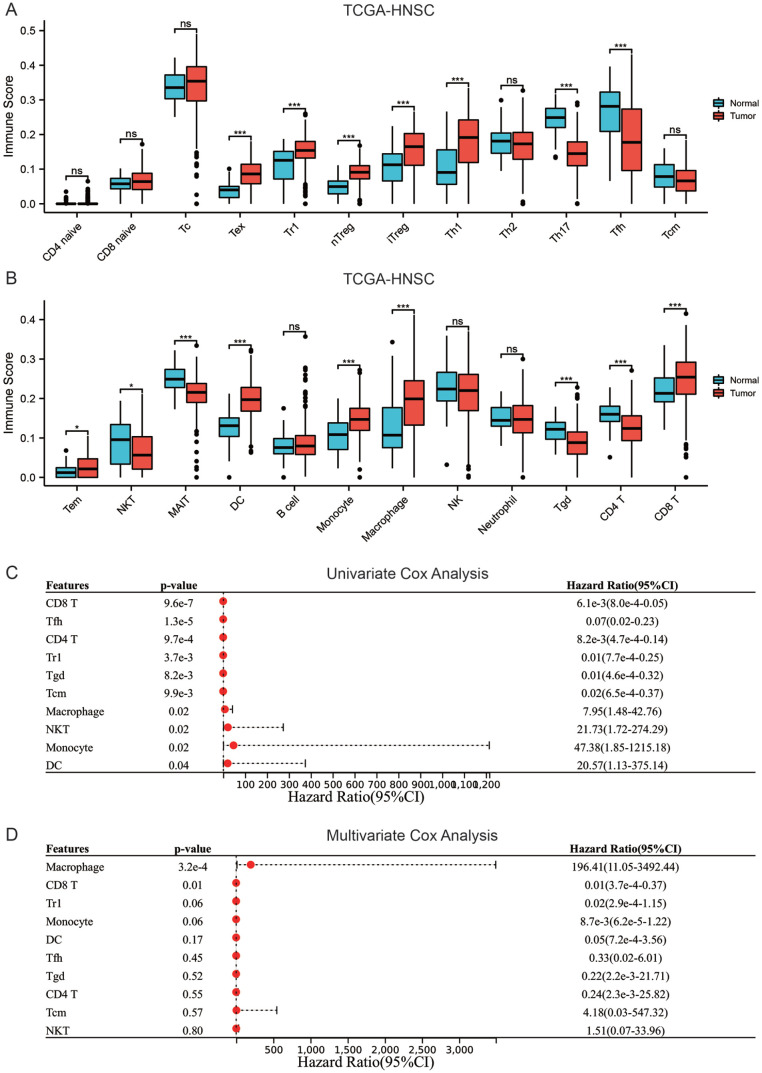
There was a considerable difference between the HNSC and control group in the number of immune cells that infiltrated the tumor microenvironment. In comparison with normal tissues, the TME of HNSC showed higher infiltration of exhausted T Cells (Tex), Type 1 regulatory cells (Tr1), nature Treg (nTreg), adaptive regulatory T cells (iTreg), Th1 cells, Dendritic cells (DC), effector memory T cells (Tem), monocytes, macrophages, and CD8+ T cells, and fewer infiltration of Th17, follicular helper T cells (Tfh), Natural killer T cells (NKT), mucosal-associated invariant T cells (MAIT), γδ T cells (Tgd), and CD4+ T cells (Figure 2A and B). Univariate Cox analysis indicated that CD8+ T cells, Tfh, Tr1, CD4+ T cells, Tgd, and Tcm were associated with better OS (HR < 1), while monocytes, macrophages, NKT, and DC cells were associated with poor OS (HR > 1) (Figure 2C). Multivariate Cox analysis showed that CD8+ T cells and macrophages are independent prognostic markers of OS (Figure 2D). Afterward, the macrophages, CD8+ T cells, and clinical characteristics such as gender, age, and the stage of TNM were included in univariate and multivariate analyses. The results revealed that CD8+ T cells, age, M, and N stages were independent predictors of OS in patients with HNSC, with CD8+ T cells being a low-risk factor (HR < 1), while age, M, and N stages being high-risk factors (HR > 1) (Table 1). The results suggested that CD8+ T cells are associated with OS in HNSC patients and are an independent prognostic biomarker of HNSC.
Figure 2.
CD8+ T cells are linked with OS in HNSC (A and B) content comparison of immune cells infiltrating the tumor microenvironment in HNSC and control group, (C) univariate cox analysis of immune cells for OS in patients with HNSC, and (D) multivariate cox analysis of immune cells for OS in patients with HNSC.
Table 1.
Univariate and multivariate Cox analysis according to OS integrating CD8+ T cells, macrophages, gender, age, clinical stage, T stage, N stage, M stage.
| Characteristics | Univariate analysis |
Multivariate analysis |
||
|---|---|---|---|---|
| Hazard ratio (95% CI) | P value | Hazard ratio (95% CI) | P value | |
| Age | 1.02 (1.01-1.04) | <.001 | 1.03 (1.02-1.04) | <.001 |
| Gender | ||||
| Female | Reference | |||
| Male | 0.76 (0.57-1.03) | .07 | ||
| Clinical stage | ||||
| Stage I | Reference | |||
| Stage II & Stage III & Stage IV | 1.11 (0.95-1.30) | .19 | ||
| T stage | ||||
| T1 | Reference | |||
| T2 & T3 & T4 | 1.10 (0.95-1.27) | .22 | ||
| N stage | ||||
| N0 | Reference | |||
| N1 & N2 & N3 | 1.18 (1.01-1.37) | .04 | 1.23 (1.05-1.44) | <.01 |
| M stage | ||||
| M0 | Reference | |||
| M1 | 4.50 (1.66-12.23) | <.01 | 6.73 (2.73-18.64) | <.001 |
| Histologic grade | ||||
| G1 | Reference | |||
| G2 & G3 & G4 | 1.10 (0.89-1.36) | .37 | ||
| CD8 T | 0.01 (0.001-0.08) | <.001 | 0.003 (0.0003-0.03) | <.001 |
| Macrophage | 6.23 (1.10-35.42) | .04 | 3.97 (0.70-22.35) | .12 |
Screening for differential genes associated with CD8+ T cell hyper infiltration
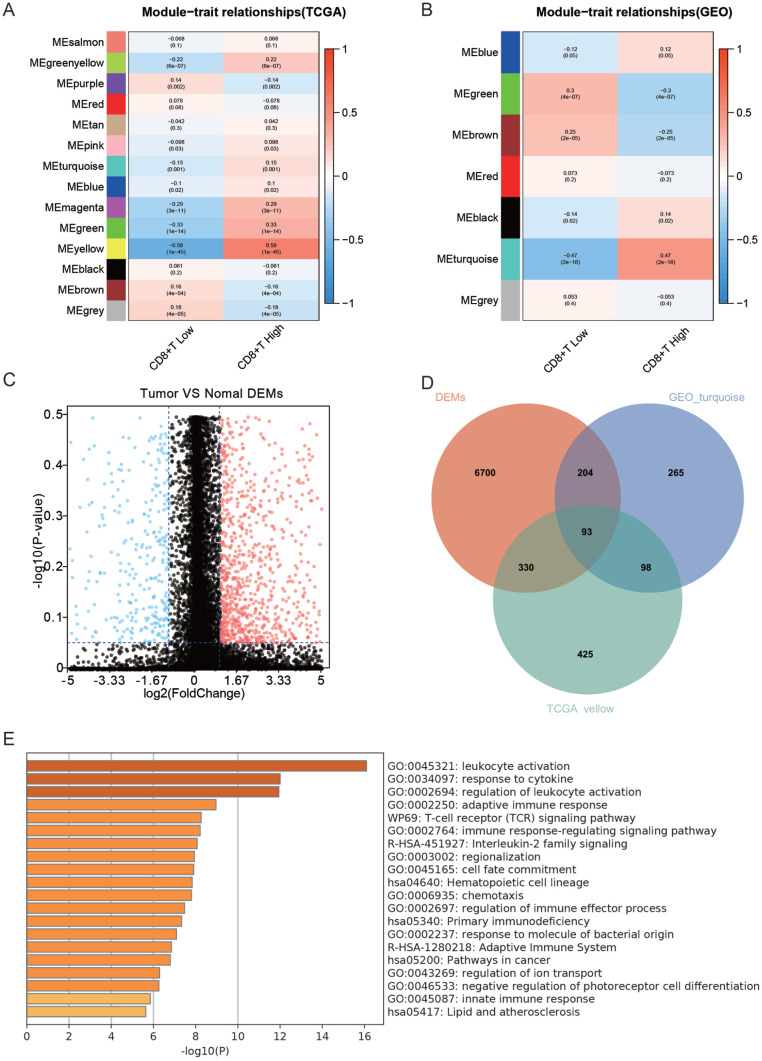
Given that CD8+ T cells were an independent prognostic marker for HNSC patients, screening for genes strongly associated with high CD8+ T infiltration was done using WGCNA in the TCGA and GEO datasets. The yellow module in the TCGA dataset and the cyan module in the GEO dataset was significantly and positively linked with high infiltration of CD8+ T cell (Figure 3A and B). The yellow module from TCGA samples contained 946 genes, while the cyan module from GEO samples contained 660 genes. There were 7328 differential genes between the HNSC and normal groups, with 1965 down-regulated and 5362 up-regulated genes in the HNSC group (Figure 3C). The yellow module, cyan module, and differential genes were intersected to find 93 genes related to high infiltration of CD8+ T cells (Figure 3D). According to functional enrichment analysis, these 93 genes depicted a role in immune-associated biological processes such as leukocyte activation, regulation, cytokine response, and immunological response (Figure 3E). Overall, 93 genes that are dysregulated in HNSC and associated with high CD8+ T cell infiltration were screened.
Figure 3.
Screening of differential genes linked with elevated CD8+ T cell infiltration (A) WGCNA analysis of modules linked with CD8+ T cell infiltration in TCGA dataset, (B) WGCNA analysis of modules linked with CD8+ T cell infiltration in GEO dataset, (C) volcano plot of differential genes between HNSC and normal tissues, (D) intersection of the green module in TCGA, purple module in GEO and of differential genes Wenn plot, and (E) functional enrichment analysis of intersecting genes.
Association of ALDH2 with the prognosis of HNSC
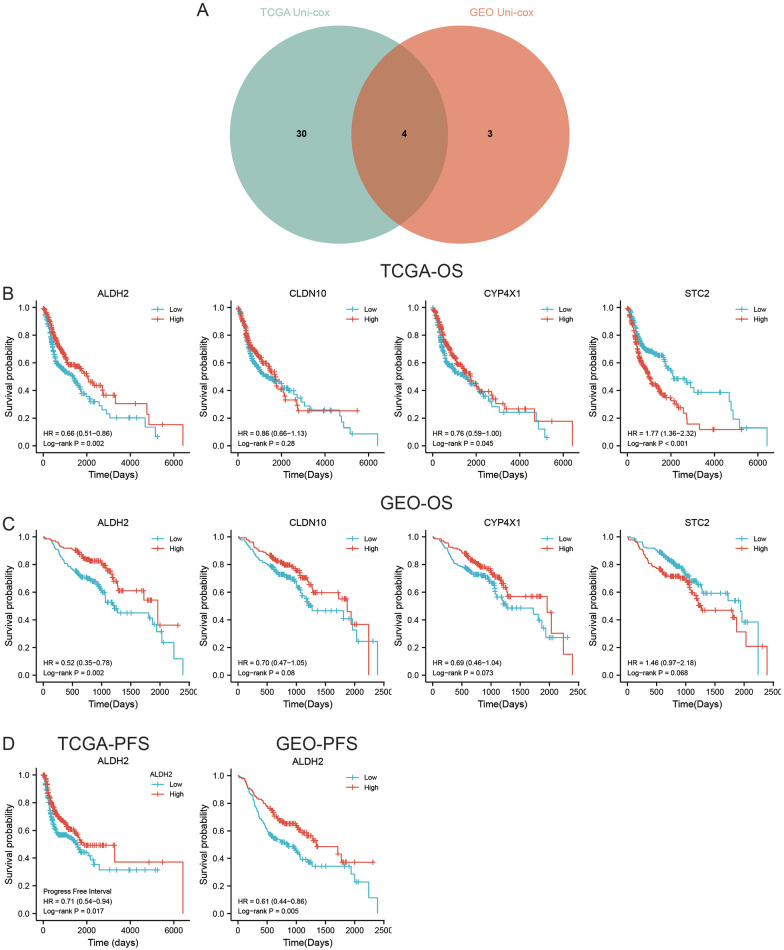
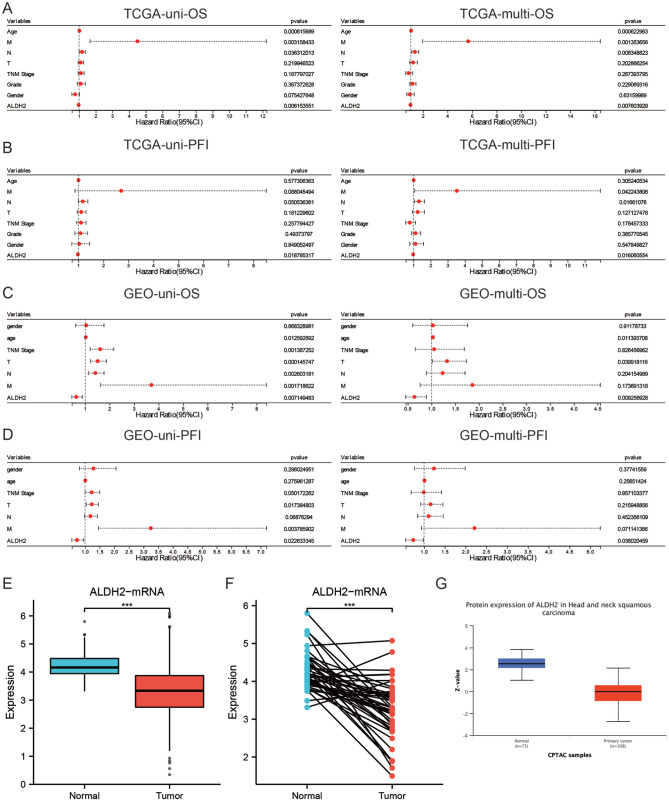
Subsequently, a univariate Cox analysis was performed on 93 genes in the TCGA and GEO cohorts. In the TCGA cohort, 35 gene expressions were associated with OS (Supplemental Material 1); in the GEO cohort, 7 gene expressions were linked with OS (Supplemental Material 2). In both cohorts, STC2, ALDH2, CYP4X1, and CLDN10 were associated with OS (Figure 4A). KM survival analysis showed that the expression levels of CYP4X1, ALDH2, and STC2 were associated with OS in the TCGA cohort (Figure 4B), whereas only ALDH2 expression was associated with OS in the GEO cohort (Figure 4C). Furthermore, HNSC patients with high ALDH2 expression had longer PFS in both the TCGA and GEO cohorts (Figure 4D). Univariate and multivariate Cox analyses were performed to confirm whether ALDH2 could independently predict the prognosis of HNSC patients. The results showed that in the TCGA cohort, ALDH2 independently served as a prognostic biomarker for OS and PFS (Figure 5A and B). The same results were obtained with the GEO cohort (Figure 5C and D). In conclusion, the findings revealed that a CD8+ T cell-related gene, ALDH2, independently predicted the prognosis of HNSC patients.
Figure 4.
ALDH2 is linked with HNSC prognosis (A) intersection of key genes after univariate Cox analysis on OS for differential genes in TCGA and GEO datasets, (B) K-M survival curves of genes in TCGA cohort and OS-related genes, (C) K-M survival curves of genes in GEO cohort and OS-related genes, and (D) K-M survival curves of ALDH2 in TCGA dataset and GEO dataset associated with PFS.
Figure 5.
The low expression of ALDH2 in HNSC and its correlation with clinical features: (A) Univariate and multivariate Cox regression analysis integrated ALDH2 and clinical feature as a prognostic biomarker of OS in TCGA data set, (B) Univariate and multivariate Cox regression analysis integrated ALDH2 and clinical feature as a prognostic biomarker of PFS in TCGA data set, (C) Univariate and multivariate Cox regression analysis integrated ALDH2 and clinical characteristics as the prognostic biomarker of OS in GEO data set, (D) Univariate and multivariate Cox regression analysis integrated ALDH2 and clinical characteristics as the prognostic biomarker of PFS in GEO data set, (E)In the unpaired samples of TCGA data set, ALDH2 in the adjacent group was significantly higher than that in HNSC tissue. (F) In the paired samples of TCGA data set, ALDH2 in the adjacent group was significantly higher than that in HNSC tissue. (G) The differential expression of ALDH2 in HNSC tissue and adjacent tissues was compared by UALCAN tool.
Lower expression of ALDH2 in HNSC and association with clinical features
The expression level of ALDH2 was downregulated in HNSC compared to paraneoplastic tissues, as per the transcriptome data from the TCGA database (Figure 5E). The results of the investigation in paired tissues were also consistent with these findings (Figure 5F). Moreover, a protein-level study of the UALCAN database revealed that ALDH2 expression was lower in HNSC than in adjacent tissues (Figure 5G). Logistic regression analysis found that low ALDH2 expression was associated with advanced T-stage and N-stage (Table 2) but not with other clinical features. Overall, the study found that ALDH2 showed less expression in HNSC tissues, and patients with low ALDH2 expression had higher T and N stages.
Table 2.
Logistic regression analysis between ALDH2 and clinical properties of HNSC.
| Characteristics | Total(N) | Odds ratio (OR) | P value |
|---|---|---|---|
| T stage (T3 & T4 vs T1 & T2) | 485 | 0.672 (0.462-0.974) | .037 |
| N stage (N1 & N2 & N3 vs N0) | 478 | 0.691 (0.481-0.990) | .044 |
| M stage (M1 vs M0) | 475 | 1.475 (0.242-11.272) | .672 |
| Clinical stage (Stage III & Stage IV vs Stage I & Stage II) | 486 | 0.714 (0.466-1.088) | .119 |
| Gender (Male vs Female) | 500 | 0.866 (0.582-1.288) | .479 |
| Age (>60 vs ⩽60) | 499 | 1.058 (0.745-1.503) | .753 |
| Histologic grade (G3 & G4 vs G1 & G2) | 481 | 1.161 (0.769-1.756) | .478 |
| Alcohol history (Yes vs No) | 489 | 0.722 (0.492-1.056) | .094 |
| Smoker (Yes vs No) | 490 | 0.858 (0.561-1.311) | .480 |
| Lymphovascular invasion (Yes vs No) | 339 | 1.066 (0.683-1.665) | .778 |
| Radiation therapy (Yes vs No) | 439 | 0.975 (0.658-1.444) | .900 |
| Lymphnode neck dissection (Yes vs No) | 497 | 0.952 (0.602-1.504) | .832 |
PPI and GSEA
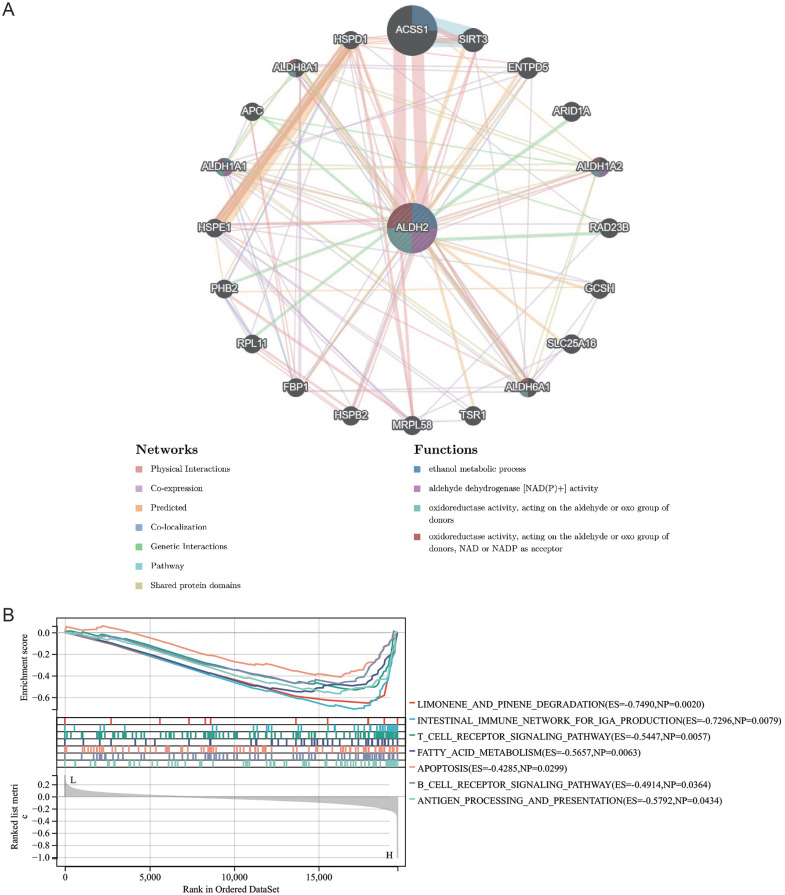
The GenenMANIA database helped us find 20 genes that may interact with ALDH2. These include ACSS1, HSPE1, PHBS, RPL11, FBP1, HSPB2, MRPL58, HPSD1, ALDH8A1, APC, ALDH1A1, TSR1, ALDH6A1, SLC25A16, GCSH, RAD23B, ALDH1A2, ARID1A, ENTPD5, and SIRT3. These genes are primarily associated with aldehyde dehydrogenase [NAD(P)+] activity, ethanol metabolic process, oxidoreductase activity, acting on the aldehyde or oxo group of donors, and oxidoreductase activity, acting on the aldehyde or oxo group of donors, or NAD and NADP as acceptor (Figure 6A). KEGG-based GSEA enrichment analysis indicated that ALDH2 was positively linked with limonene and pinene degradation, the intestinal immune network for IgA production, T cell receptor signaling pathway, fatty acid metabolism, apoptosis, B cell receptor signaling pathway, and antigen processing and presentation (Figure 6B). Collectively, the results uncovered a molecular mechanism that may be relevant to ALDH2 in HNSC.
Figure 6.
PPI and GSEA (A) PPI network consisting of 20 genes interacting with ALDH2 explored by GeneMANIA tool (B) KEGG-based GSEA enrichment analysis of ALDH2.
Association of ALDH2 with HNSC immune characteristics
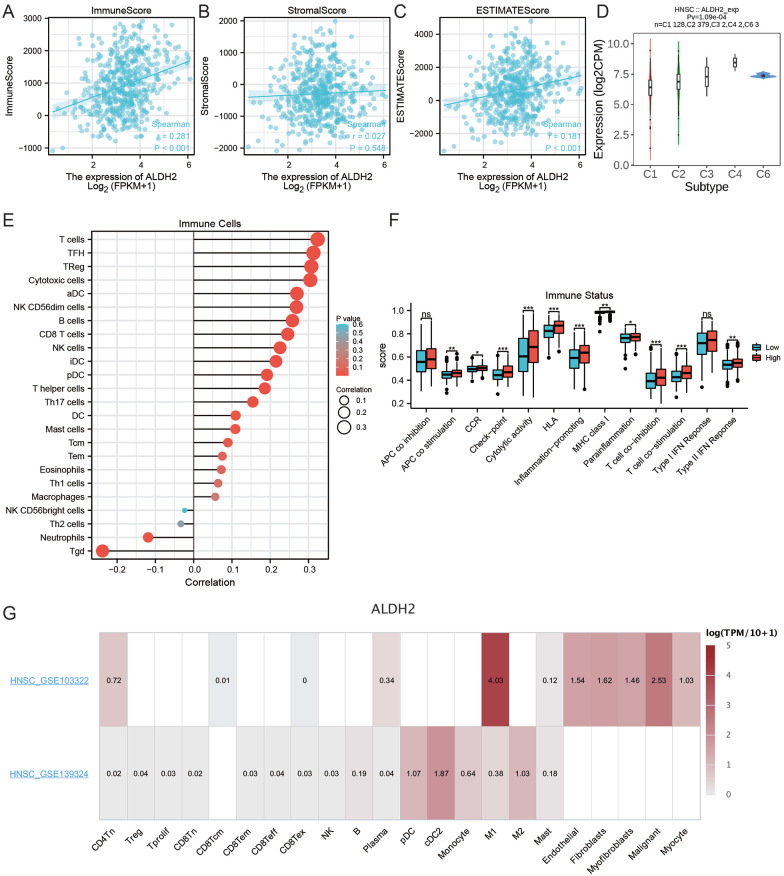
Based on the ESTIMATE algorithm, ALDH2 positively correlated with immune and estimate scores but not stromal scores (Figure 7A–C). Available immune subtypes included C1 to C6 (C1: wound healing, C2: mainly ifn-γ, C3: inflammation, C4: lymphocyte depletion, C5: immune calm, and C6: TGF-b dominant). Through the TISIDB database, it was found that ALDH2 was most highly expressed in the C4 subtype, lowest in the C1 subtype, and not expressed in the C5 subtype (Figure 7D). The immune cell infiltration and the immune status score in the HNSC tumor microenvironment were assessed by the ssGSEA algorithm. Correlation analysis indicated that ALDH2 was positively linked with TFH, Treg, T cells, cytotoxic cells, B cells, CD8+ T cells, NK, NK CD56dim cells, iDC cells, pDC cells, helper T cells, Th17, DC, mast cells, Tcm cells, and negatively correlated with neutrophils and TGD cells (Figure 7E). The APC co-stimulation, CCR, immune checkpoint, inflammation-promoting, MHC Class Ⅰ, T cell co-stimulation, cytotoxicity activity, HLA, and type Ⅱ IFN response scores were elevated in the ALDH2 high expression group in comparison with the ALDH2 low expression group (Figure 7F). The TISCH database was employed to understand which cell types express ALDH2 in the HNSC tumor microenvironment. Interestingly, the GSE103322 dataset revealed that ALDH2 was primarily expressed in tumor cells, endothelial cells, M1 macrophages, and fibroblasts but not in T and B cells. In the GSE103322 dataset, ALDH2 was primarily expressed in macrophages, monocytes, and dendritic cells but not in T cells (Figure 7G). This suggested that ALDH2 may associate with CD8+ T cells through high expression in other cell types. In summary, it was found that ALDH2 is associated with the tumor microenvironment of HNSCs.
Figure 7.
Link between ALDH2 and immune features of HNSC (A) Relationship between ALDH2 and immune scores, (B) correlation between ALDH2 and matrix scores, (C) link between ALDH2 and estimate scores, (D) link analysis between immune cells and ALDH2, (E) association of immune status scores between groups with high and low ALDH2 expression, (F) determining the expression of ALDH2 in HNSC immune cells using TISCH tool at the single-cell level, (G)To show which cell types express ALDH2 in the HNSC tumor microenvironment In GSE103322 and GSE139324.
Association of ALDH2 with HNSC drug sensitivity
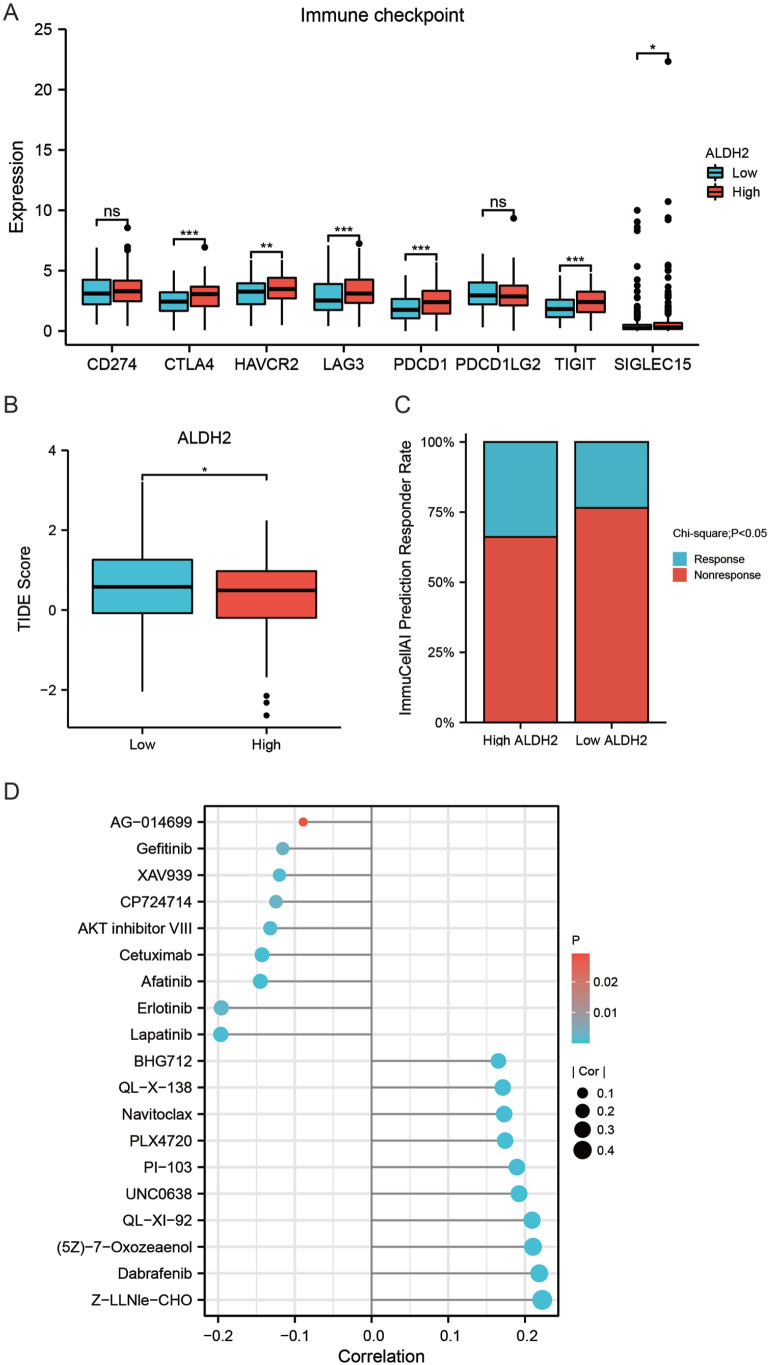
In HNSC patients with high ALDH2 expression, immune checkpoints such as CTLA4, HAVCR2, LAG3, PDCD1, TIGIT, and SIGLEC15 were overexpressed (Figure 8A), suggesting that HNSC patients with high ALDH2 expression were more likely to receive ICIs therapy. The TIDE algorithm was used to predict the sensitivity of HNSC patients to ICIs treatment to see whether patients with high ALDH2 expression were more suitable for ICIs. Patients with high TIDE scores were less sensitive to ICIs. According to the findings of this study, TIDE scores were higher in HNSC patients with high ALDH2 expression (Figure 8B). The results from the ImmunCellAI database showed that HNSC patients in the ALDH2 high expression group were more susceptible to ICIs treatment than those in the ALDH2 low expression group (Figure 8C).
Figure 8.
ALDH2 is linked with HNSC drug sensitivity (A) Comparison of immune checkpoint-related gene expression at high and low ALDH2 expression, (B) comparison of TIDE scores in high and low ALDH2 expression groups, (C) proportion of treatment response to ICIs in high and low ALDH2 expression groups, (D) finding mRNA expression of ALDH2 by GSCALite tool with GDSC database to explore the correlation between the mRNA expression of ALDH2 and the IC50 of chemotherapeutic agents.
The GSCA database was then used to investigate the relationship between ALDH2 mRNA expression and the chemotherapeutic drug IC50 in the GDSC database. The results indicated that the expression of ALDH2 was positively associated with the IC50 of Z-LLNle-CHO, Dabrafenib, (5Z)-7-Oxozeaenol, QL-XI-92, UNC0638, PI-103, PLX4720, Navitoclax, and QL-X-138, showing that individuals with high ALDH2 expression were resistant to these medications. In contrast, ALDH2 was negatively associated with the IC50 of Lapatinib, Erlotinib, Afatinib, Cetuximab, AKT inhibitor VIII, CP724714, XAV939, Gefitinib, and KIN001-135, indicating that HNSC patients with high ALDH2 expressions were more sensitive to these drugs (Figure 8D). Therefore, these results suggested that ALDH2 may serve as a biomarker to predict the sensitivity of HNSC patients to drug therapy.
Discussion
HNSC is a malignant tumor with a high death rate and poor 5-year survival rate. While researchers have discovered a huge number of molecular markers, only a few biomarkers are used for the diagnosis and prognosis of the disease and as targets for immunotherapy in HNSC.16 It has been revealed that CD8+ T cells in the tumor immune microenvironment are a key component of the tumor-acquired immune system, with a role in presenting antigen, apoptosis, angiogenesis, tumor cell cycle inhibition, and induction of macrophage killing activity. Decreased CD8+ T cells numbers in the HNSC tumor microenvironment predicts a poor prognosis.17 Nevertheless, recent research on the pathological role of CD8+ T cell infiltration in HNSC progression is limited, and only a few studies have involved in-depth screening with CD8+ T cell infiltration-linked genes to look for immune-related prognostic and predictive evaluation biomarkers. In this report, ALDH2 was identified as a gene linked with enhanced infiltration of CD8+ T cells through systematic screening. ALDH2 was down-regulated in HNSC tissues both in the transcript and protein levels, and low ALDH2 expression associated with higher T and N stages of HNSC. Moreover, ALDH2 was an independent favorable prognostic marker in HNSC. ALDH2, known as acetaldehyde dehydrogenase 2, is involved in detoxifying ROS generated by acetaldehyde and ethanol metabolism, which is consistent with the findings of our GSEA result.8 Based on the above results, we speculate that ALDH2 may act as a tumor suppressor gene whose expression is inhibited in HNSC.
Previous research has shown that ALDH2 malfunction is linked to many human disorders, for instance, diabetes, cardiovascular disease, Fanconi anemia, pain, osteoporosis, and cancer.18-23 ALDH2 research has gotten a lot of attention in the biological, medical, and chemical communities because around 30% to 40% of Asians are genetically deficient in this enzyme and are exposed to high levels of the catalytically active form of acetaldehyde.23,24 Alcohol consumption and smoking are definite risk factors for HNSC in the oral cavity, pharynx, and larynx. Ethanol and its main metabolite acetaldehyde can cause gene mutations that greatly increase the risk of HNSC.25 The conversion of acetaldehyde to acetate is largely dependent on the ALDH2 enzyme encoded by the ALDH2 gene. Low ALDH2 expression impairs cellular detoxification mechanisms, contributing to the accumulation of aldehyde products that lead to a cellular redox state, which is associated with a high incidence of cancer.26,27 The heavy drinking group of HNSC patients has lower levels of ALDH2 expression and decreased OS results.28 According to the findings of recent studies, low ALDH2 expression affects cancer cells via translocating extracellular vesicles rich in oxidized mitochondrial deoxyribonucleic acid.29
Additionally, ALDH2-mediated immune system dysfunction was also hypothesized to be a cancer-causing mechanism. Our results revealed that ALDH2 expression was positively associated with T cells, cytotoxic cells, NK CD56dim cells, B cells, CD8+ T cells, NK, iDC cells, pDC cells, TFH, Treg, helper T cells, Th17, DC, Tcm, and mast cells, but negatively correlated with neutrophils and TGD cells. Moreover, APC co-stimulator, CCR, immune checkpoint, cytotoxicity, HLA, pro-inflammatory response, type 1 MHC, T cell co-stimulator, and type 2 IFN response scores were higher in ALDH2 high expression group than in ALDH2 low expression. Assessment of our research at the single-cell level highlighted that ALDH2 was not increasingly expressed in T cells but rather in macrophages and fibroblasts, indicating that ALDH2 may promote T cell infiltration by acting in macrophages or fibroblasts.
Programed cell death receptor 1 (PD-1), a key inhibitory receptor located on the surface of tumor-infiltrating lymphocytes (TILs), promotes T cell depletion and weakens the immune response when bound to programed death ligand-1 (PDL1), a major ligand expressed in tumor cells.30 ICIs have recently been a key breakthrough in cancer therapy, with ICIs targeting PD-1, CTLA-4, and its ligand PD-L1 demonstrating significant and persistent survival advantages.31 However, response rates are low, with total remission rates for ICIs monotherapy ranging from 20% to 40%.31 This shows that many patients may not benefit from ICIs therapy. Hence, finding effective indicators which can filter appropriate patients for optimum benefit from ICIs therapy is crucial. According to these findings, HNSC patients with high ALDH2 expression tend to have better sensitivity to ICIs treatment, which has important clinical significance. Finally, this study predicted the drugs that might target alDH2. The drug sensitivity analysis revealed that HNSC patients with high ALDH2 expression were more susceptible to Lapatinib, Erlotinib, Afatinib, Cetuximab, AKT inhibitor VIII, CP724714, XAV939 Gefitinib, and KIN001-135. A promising therapeutic method for patients with variable gene expression is precision-tailored medicine. In conclusion, ALDH2 differential expression was linked to the infiltration of various immune cells in HNSC, particularly CD8+ T cells. The link between ALDH2 and various immune cells emphasized ALDH2’s importance in the immunological milieu of HNSC tumors. Meanwhile, ALDH2 has been linked to immunological characteristics and immunotherapy, suggesting that it could be a novel biomarker for predicting HNSC prognosis. However, this research is limited by the paucity of validation models and in-vivo, in-vitro ALDH2 expression experiments. Therefore, more research is required to accomplish breakthroughs in HNSC immunotherapy which will be aided by a better knowledge of the processes of ALDH2-associated immune infiltration.
Conclusions
A CD8+ T cell infiltration-associated gene ALDH2 was identified, which could serve as a biomarker to assess the prognosis and sensitivity to ICIs for HNSC patients. However, further clinical and functional research is required before these findings can be used in clinical settings.
Supplemental Material
Supplemental material, sj-xls-1-cix-10.1177_11769351221139252 for Identifying the Therapeutic and Prognostic Role of the CD8+ T Cell-Related Gene ALDH2 in Head and Neck Squamous Cell Carcinoma by Hongmei Zhang, Zhaozheng Li and Yan Zheng in Cancer Informatics
Supplemental material, sj-xls-2-cix-10.1177_11769351221139252 for Identifying the Therapeutic and Prognostic Role of the CD8+ T Cell-Related Gene ALDH2 in Head and Neck Squamous Cell Carcinoma by Hongmei Zhang, Zhaozheng Li and Yan Zheng in Cancer Informatics
Acknowledgments
Not applicable.
Footnotes
Funding: The author(s) received no financial support for the research, authorship, and/or publication of this article.
The author(s) declared no potential conflicts of interest with respect to the research, authorship, and/or publication of this article.
Authors’ Contributions: Hongmei Zhang designed the study and analyzed the data, Zhaozheng Li wrote the manuscript, and Yan Zheng supervised the entire study.
Availability of Data and Materials: The data of this study are all from public databases, and data numbers are provided in the method part.
Supplemental Material: Supplemental material for this article is available online.
References
- 1. Bray F, Ferlay J, Soerjomataram I, Siegel RL, Torre LA, Jemal A. Global cancer statistics 2018: GLOBOCAN estimates of incidence and mortality worldwide for 36 cancers in 185 countries. CA Cancer J Clin. 2018;68:394-424. [DOI] [PubMed] [Google Scholar]
- 2. Patel JJ, Levy DA, Nguyen SA, Knochelmann HM, Day TA. Impact of PD-L1 expression and human papillomavirus status in anti-PD1/PDL1 immunotherapy for head and neck squamous cell carcinoma-systematic review and meta-analysis. Head Neck. 2020;42:774-786. [DOI] [PMC free article] [PubMed] [Google Scholar]
- 3. Yokota T, Homma A, Kiyota N, et al. Immunotherapy for squamous cell carcinoma of the head and neck. Jpn J Clin Oncol. 2020;50:1089-1096. [DOI] [PubMed] [Google Scholar]
- 4. Newton HS, Gawali VS, Chimote AA, et al. PD1 blockade enhances K+ channel activity, Ca2+ signaling, and migratory ability in cytotoxic T lymphocytes of patients with head and neck cancer. J Immunother Cancer. 2020;8:e000844. [DOI] [PMC free article] [PubMed] [Google Scholar]
- 5. Farhood B, Najafi M, Mortezaee K. CD8+ cytotoxic T lymphocytes in cancer immunotherapy: a review. J Cell Physiol. 2019;234:8509-8521. [DOI] [PubMed] [Google Scholar]
- 6. Hossain MA, Liu G, Dai B, et al. Reinvigorating exhausted CD8+ cytotoxic T lymphocytes in the tumor microenvironment and current strategies in cancer immunotherapy. Med Res Rev. 2021;41:156-201. [DOI] [PubMed] [Google Scholar]
- 7. Farlow JL, Brenner JC, Lei YL, Chinn SB. Immune deserts in head and neck squamous cell carcinoma: a review of challenges and opportunities for modulating the tumor immune microenvironment. Oral Oncol. 2021;120:105420. [DOI] [PMC free article] [PubMed] [Google Scholar]
- 8. Zhang H, Fu L. The role of ALDH2 in tumorigenesis and tumor progression: targeting ALDH2 as a potential cancer treatment. Acta Pharm Sin B. 2021;11:1400-1411. [DOI] [PMC free article] [PubMed] [Google Scholar]
- 9. Sun D, Wang J, Han Y, et al. TISCH: a comprehensive web resource enabling interactive single-cell transcriptome visualization of tumor microenvironment. Nucleic Acids Res. 2021;49:D1420-D30. [DOI] [PMC free article] [PubMed] [Google Scholar]
- 10. Ru B, Wong CN, Tong Y, et al. TISIDB: an integrated repository portal for tumor-immune system interactions. Bioinformatics. 2019;35:4200-4202. [DOI] [PubMed] [Google Scholar]
- 11. Zhou Y, Zhou B, Pache L, et al. Metascape provides a biologist-oriented resource for the analysis of systems-level datasets. Nat Commun. 2019;10:1523. [DOI] [PMC free article] [PubMed] [Google Scholar]
- 12. Jiang P, Gu S, Pan D, et al. Signatures of T cell dysfunction and exclusion predict cancer immunotherapy response. Nat Med. 2018;24:1550-1558. [DOI] [PMC free article] [PubMed] [Google Scholar]
- 13. Miao YR, Zhang Q, Lei Q, et al. ImmuCellAI: a unique method for comprehensive T-Cell subsets abundance prediction and its application in cancer immunotherapy. Adv Sci. 2020;7:1902880. [DOI] [PMC free article] [PubMed] [Google Scholar]
- 14. Chandrashekar DS, Bashel B, Balasubramanya SAH, et al. UALCAN: a portal for facilitating tumor subgroup gene expression and survival analyses. Neoplasia. 2017;19:649-658. [DOI] [PMC free article] [PubMed] [Google Scholar]
- 15. Franz M, Rodriguez H, Lopes C, et al. GeneMANIA update 2018. Nucleic Acids Res. 2018;46:W60-W4. [DOI] [PMC free article] [PubMed] [Google Scholar]
- 16. Zhang G, Li T, Tan G, et al. Identity of MMP1 and its effects on tumor progression in head and neck squamous cell carcinoma. Cancer Med. 2022;11:2516-2530. [DOI] [PMC free article] [PubMed] [Google Scholar]
- 17. Zhang Y, Li L, Zheng W, Zhang L, Yao N. CD8+ T-cell exhaustion in the tumor microenvironment of head and neck squamous cell carcinoma determines poor prognosis.. Ann Transl Med. 2022;10:273. [DOI] [PMC free article] [PubMed] [Google Scholar]
- 18. Jiang Q, Li X, Chen R, Wang C, Liu X, Wang X. Association of functional variant of aldehyde dehydrogenase 2 with acute myocardial infarction of Chinese patients. BMC Cardiovasc Disord. 2022;22:303. [DOI] [PMC free article] [PubMed] [Google Scholar]
- 19. Xu F, Chen Y, Lv R, et al. ALDH2 genetic polymorphism and the risk of type II diabetes mellitus in CAD patients. Hypertens Res. 2010;33:49-55. [DOI] [PubMed] [Google Scholar]
- 20. Mu A, Hira A, Matsuo K, Takata M. [Aldehyde degradation deficiency (ADD) syndrome: discovery of a novel fanconi anemia-like inherited BMF syndrome due to combined ADH5/ALDH2 deficiency]. Rinsho Ketsueki. 2021;62:547-553. [DOI] [PubMed] [Google Scholar]
- 21. Zambelli VO, Gross ER, Chen CH, Gutierrez VP, Cury Y, Mochly-Rosen D. Aldehyde dehydrogenase-2 regulates nociception in rodent models of acute inflammatory pain. Sci Transl Med. 2014;6:251ra118. [DOI] [PMC free article] [PubMed] [Google Scholar]
- 22. Hoshi H, Hao W, Fujita Y, et al. Aldehyde-stress resulting from aldh2 mutation promotes osteoporosis due to impaired osteoblastogenesis. J Bone Miner Res. 2012;27:2015-2023. [DOI] [PubMed] [Google Scholar]
- 23. Wang LS, Wu ZX. ALDH2 and cancer therapy. Adv Exp Med Biol. 2019;1193:221-228. [DOI] [PubMed] [Google Scholar]
- 24. Yao S, Yin X, Chen T, et al. ALDH2 is a prognostic biomarker and related with immune infiltrates in HCC. Am J Cancer Res. 2021;11:5319-5337. [PMC free article] [PubMed] [Google Scholar]
- 25. Tu X, Ren J, Zhao Y. [Advances in risk factors and genetic risk of head and neck squamous cell carcinoma]. Lin Chung Er Bi Yan Hou Tou Jing Wai Ke Za Zhi. 2022;36:391-396. [DOI] [PMC free article] [PubMed] [Google Scholar]
- 26. Yoval-Sánchez B, Rodríguez-Zavala JS. Differences in susceptibility to inactivation of human aldehyde dehydrogenases by lipid peroxidation byproducts. Chem Res Toxicol. 2012;25:722-729. [DOI] [PubMed] [Google Scholar]
- 27. Heymann HM, Gardner AM, Gross ER. Aldehyde-induced DNA and protein adducts as biomarker tools for alcohol use disorder. Trends Mol Med. 2018;24:144-155. [DOI] [PMC free article] [PubMed] [Google Scholar]
- 28. Lee DJ, Lee HM, Kim JH, Park IS, Rho YS. Heavy alcohol drinking downregulates ALDH2 gene expression but heavy smoking up-regulates SOD2 gene expression in head and neck squamous cell carcinoma. World J Surg Oncol. 2017;15:163. [DOI] [PMC free article] [PubMed] [Google Scholar]
- 29. Seo W, Gao Y, He Y, et al. ALDH2 deficiency promotes alcohol-associated liver cancer by activating oncogenic pathways via oxidized DNA-enriched extracellular vesicles. J Hepatol. 2019;71:1000-1011. [DOI] [PMC free article] [PubMed] [Google Scholar]
- 30. Zhang H, Xia Y, Wang F, et al. Aldehyde dehydrogenase 2 mediates alcohol-induced colorectal cancer immune escape through stabilizing PD-L1 expression. Adv Sci. 2021;8:2003404. [DOI] [PMC free article] [PubMed] [Google Scholar]
- 31. Wang HC, Yeh TJ, Chan LP, Hsu CM, Cho SF. Exploration of feasible immune biomarkers for immune checkpoint inhibitors in head and neck squamous cell carcinoma treatment in real world clinical practice. Int J Mol Sci. 2020;21:7621. [DOI] [PMC free article] [PubMed] [Google Scholar]
Associated Data
This section collects any data citations, data availability statements, or supplementary materials included in this article.
Supplementary Materials
Supplemental material, sj-xls-1-cix-10.1177_11769351221139252 for Identifying the Therapeutic and Prognostic Role of the CD8+ T Cell-Related Gene ALDH2 in Head and Neck Squamous Cell Carcinoma by Hongmei Zhang, Zhaozheng Li and Yan Zheng in Cancer Informatics
Supplemental material, sj-xls-2-cix-10.1177_11769351221139252 for Identifying the Therapeutic and Prognostic Role of the CD8+ T Cell-Related Gene ALDH2 in Head and Neck Squamous Cell Carcinoma by Hongmei Zhang, Zhaozheng Li and Yan Zheng in Cancer Informatics


