

Summary
Around birth, globin expression in human red blood cells (RBCs) shifts from γ-globin to β-globin, resulting in fetal hemoglobin (HbF, α2γ2) being gradually replaced by adult hemoglobin (HbA, α2β2) 1. This process has motivated innovative approaches to treating sickle cell disease (SCD) and β-thalassemia by increasing HbF in postnatal RBCs2. Here we provide therapeutically relevant insights into globin gene switching obtained through a CRISPR/Cas9 screen for ubiquitin–proteasome components that regulate HbF expression. In RBC precursors, depletion of the von Hippel–Lindau (VHL) E3 ubiquitin ligase stabilized its ubiquitination target, hypoxia-inducible factor 1-alpha (HIF1α) 3,4, to induce γ-globin gene transcription. Mechanistically, HIF1α–HIF1β heterodimers bound cognate DNA elements in BGLT3, a long noncoding RNA gene located 2.7 kb downstream of the tandem γ-globin genes HBG1 and HBG2. This was followed by recruitment of transcriptional activators, chromatin opening, and increased long-range interactions between the γ-globin genes and their upstream enhancer. Similar induction of HbF occurred with hypoxia or with inhibition of prolyl hydroxylase domain enzymes that target HIF1α for ubiquitination by the VHL E3 ubiquitin ligase. Our findings link globin gene regulation with canonical hypoxia adaptation, provide a mechanism for HbF induction during stress erythropoiesis, and suggest a novel therapeutic approach for β-hemoglobinopathies.
Sickle cell disease (SCD) and β-thalassemia are common life-threatening disorders caused by autosomal-recessive mutations in the HBB gene, which encodes the β-globin subunit of HbA5,6. Although medical progress has improved and extended the lives of patients with these conditions, there are no ideal treatments. Clinical and laboratory observations that expression of fetal hemoglobin (HbF) can ameliorate either disease by enhancing the survival of circulating red blood cells (RBCs) and their bone marrow precursors have given rise to promising new therapeutic approaches1,2,7,8. Mutually exclusive expression of γ-globin or β-globin in the β-like globin gene cluster is regulated by competition for the locus control region (LCR), a powerful upstream enhancer9. Although recent insights have revealed the mechanisms regulating this competition, it remains unclear how various conditions associated with accelerated RBC production induce γ-globin and HbF postnatally in humans10–14 and in non-human primates15,16. These conditions, collectively referred to as “stress erythropoiesis,” include hypoxia caused by high-altitude exposure or cardiopulmonary disease and various forms of anemia.
Physiologic responses to hypoxia are controlled by a canonical oxygen-sensing pathway that regulates the stability of hypoxia-inducible factors (HIFs) HIF1α and HIF2α/EPAS13,4. At high oxygen levels, oxygen-dependent prolyl hydroxylase domain (PHD) enzymes hydroxylate HIFα proteins, thereby targeting them for ubiquitination by the von Hippel–Lindau (VHL) E3 ubiquitin ligase complex, followed by proteasomal degradation. At low oxygen tension, PHD enzyme activity is reduced, causing HIFα proteins to accumulate, dimerize with constitutively expressed HIF1β, and bind hypoxia-response elements (HREs) in noncoding regulatory DNA to activate genes that facilitate hypoxic adaptation. Canonical HIF target genes encode the erythropoietic cytokine erythropoietin, glycolytic enzymes, and vasculogenic proteins. Here we show that HIF1α activates γ-globin genes directly in RBCs, supporting the concept that HbF induction represents an adaptive response to hypoxia during stress erythropoiesis and suggesting a new therapy for β-hemoglobinopathies.
VHL disruption induces HbF expression
Reasoning that protein ubiquitination regulated gene expression17, we performed a genetic screen to identify ubiquitin–proteasome system components that induced HbF in human umbilical cord blood–derived erythroid progenitor 2 (HUDEP-2) cells, an immortalized erythroblast line that expresses mainly HbA but that can be induced to express HbF by manipulating the genes that control developmental globin gene switching18,19. Cas9-expressing HUDEP-2 cells were transduced with a lentiviral vector library encoding 3143 single-guide RNAs (sgRNAs) targeting 776 ubiquitin–proteasome system genes20, fractionated according to HbF expression, and analyzed by next-generation sequencing (NGS) for sgRNA sequences in genomic DNA (Extended Data Fig. 1a). Control sgRNAs targeting coding or noncoding DNA regions that are known to inhibit γ-globin expression were enriched in HbFhigh RBCs21–24. Additionally, sgRNAs targeting VHL and TCEB1, which encode members of the same ubiquitin ligase complex, were associated with HbF expression (Fig. 1a and Supplementary Table 1), consistent with the results of a recently reported genetic screen25. Lentiviral vector expression of Cas9 and two different VHL sgRNAs in HUDEP-2 cells caused efficient suppression of VHL and an approximately 5-fold increase in γ-globin expression (Fig. 1b, c). To validate these findings further, we transfected normal peripheral blood mobilized human donor CD34+ hematopoietic stem and progenitor cells (HSPCs) with ribonucleoprotein (RNP) complexes consisting of VHL or control sgRNAs (nontargeting or AAVS1 sgRNA) then induced in vitro erythroid differentiation. Suppression of VHL caused increases in the number of cells that were positive for HbF by immunostaining (“F-cells”), γ-globin mRNA, and HbF protein, with a reciprocal decline in β-globin mRNA (Fig. 1d–f and Extended Data Fig. 1b–d) but no effect on erythroblast expansion, expression of maturation markers, or cell morphology (Extended Data Fig. 1e–g). The VHL protein interacts with elongin B, elongin C (VBC), and cullin-2 to form an E3 ubiquitin ligase complex3,4. Transduction of Cas9-expressing HUDEP-2 cells with lentiviral vectors targeting TCEB1 (encoding elongin B) or CUL2 (encoding cullin-2) caused increases in γ-globin mRNA, γ-globin protein, and F-cells (Extended Data Fig. 2a–c). Therefore, the VHL protein probably regulates HbF expression through its canonical function as a ubiquitin ligase that destabilizes certain proteins. Upon the depletion of VHL protein, its relevant ubiquitylation substrates could accumulate with no changes in their corresponding mRNAs. To identify these substrates, we used mass spectrometry and RNA-seq to compare differences in protein and mRNA abundances in erythroblasts generated from VHL protein–depleted and control CD34+ HSPCs (Fig. 1g and Supplementary Tables 2 and 3). We identified a total of 10,491 proteins and 17,025 mRNA transcripts. Depletion of VHL protein resulted in the induction of 602 mRNAs, with upregulation of most of the corresponding proteins. However, the levels of the HIF1α and MYOM1 proteins were significantly increased, with no change in the corresponding mRNAs (Fig. 1g). Pathway analysis showed the induced mRNAs to be enriched for HIF-regulated genes that control glycolysis, gluconeogenesis, and the metabolism of other carbohydrates (Extended Data Fig. 2d). Disruption of VHL did not alter the expression of BCL11A or ZBTB7A, γ-globin gene repressor proteins that mediate the perinatal γ-globin to β-globin switch (Fig. 1g and Extended Data Fig. 2e) 23.
Fig. 1. VHL regulates γ-globin expression.
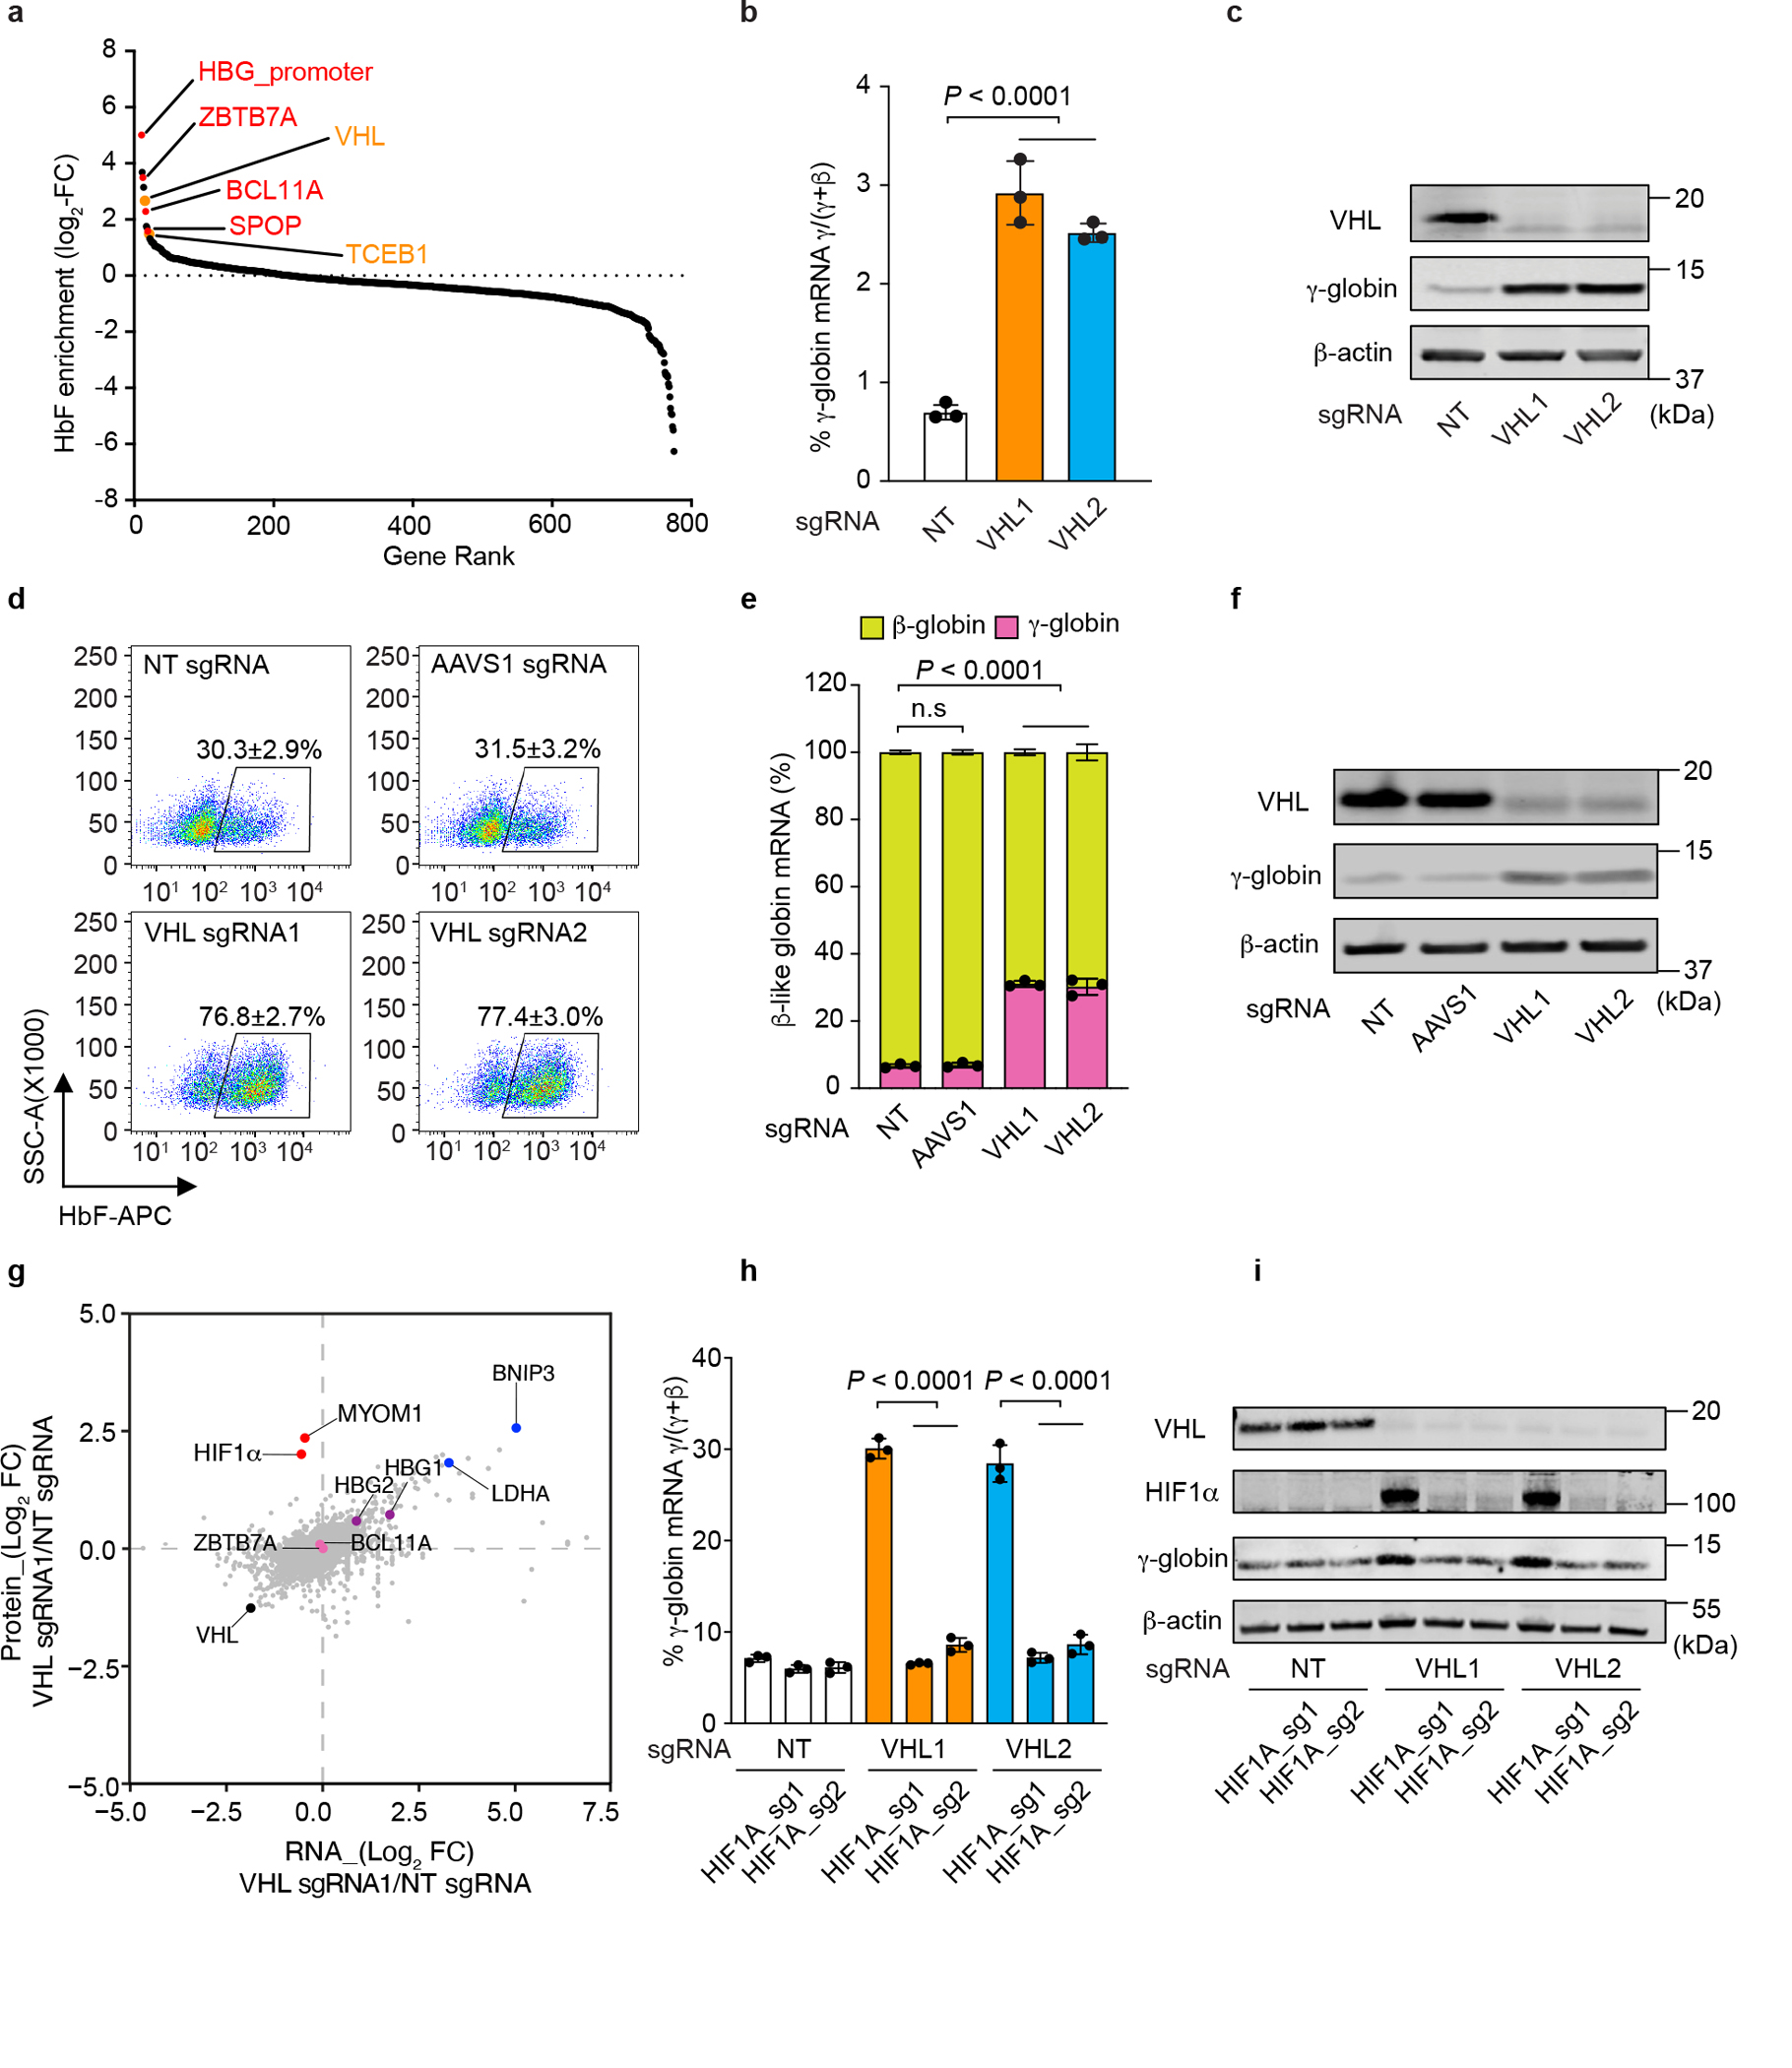
a, The results of a CRISPR/Cas9 screen showing sgRNAs that are enriched in HUDEP-2 cells expressing high levels of HbF (see Methods for details). The y-axis shows log2 fold-change (FC) in sgRNAs. Dots represent average for four sgRNAs targeting the same gene. BCL11A, ZBTB7A, SPOP or a BCL11A repressor binding element in the γ-globin promoter (HBG_promoter) (red) and VHL, TCEB1(orange) are highlighted. b, Cas9-expressing HUDEP-2 cells were transduced with vectors encoding sgRNAs targeting VHL or with non-targeting (NT) sgRNA. The chart shows %γ-globin mRNA measured by RT-qPCR on day 5 (d5) of erythroid maturation (mean ± s.d., n = 3 independent experiments). c, Western blot of cells in b. d, CD34+ HSPCs were transfected with ribonucleoproteins (RNPs) consisting of Cas9 + VHL sgRNAs or control sgRNAs (NT or AAVS1) and induced to undergo erythroid differentiation. Flow-cytometry plots show %HbF-immunostaining “F-cells” at d15 (mean ± s.d., n = 3). e, %γ- and β-globin mRNAs in d13 erythroblasts (mean ± s.d., n = 3). f, Western blot of d13 erythroblasts from d. g, Erythroblasts generated from CD34+ HSPCs transfected with NT or VHL-targeting RNP were analyzed by quantitative proteomics and RNA-seq. Graph shows log2 FCs in protein (y-axis) and mRNA (x-axis). Dots represent single genes. Pink dots: BCL11A or ZBTB7A; red dots: potential VHL substrates with log2 FCs in protein ≥ 2 and minimal change in corresponding mRNAs. BNIP3 and LDHA are HIF targets. h, CD34+ HSPCs were co-transfected with RNPs targeting VHL and HIF1A, followed by induced erythroid differentiation. Graph shows %γ-globin RNA at d13 (mean ± s.d., n = 3). i, Western blot of cells in h. Multiplicity-adjusted P-values by one-way ANOVA with Dunnett’s multiple comparison test (MCT) against NT for b, e; and by Šídák’s MCT for h. n=3 independent experiments with different donor CD34+ cells for d, e, h.
Our data suggest that VHL disruption induces HbF through an HIF-regulated pathway. The oxygen-dependent PHD enzymes PHD1, PHD2, and PHD3 hydroxylate HIF1α and HIF2α/EPAS1 to stimulate their degradation by the VHL E3 ubiquitin ligase complex3,4. Erythroblasts with intact VHL genes expressed mainly EGLN2 (PHD1) mRNA, and the HIF1 target genes EGLN1 (PHD2) and EGLN3 (PHD3) 26 were upregulated after VHL disruption (Extended Data Fig. 2f). The results of RNA-seq, proteomic studies, and Western blot analyses indicated that VHL protein–depleted erythroblasts express mainly HIF1α but not the related proteins HIF2α or HIF3α (Extended Data Fig. 2g, h and Supplementary Tables 2 and 3).
Stress erythropoiesis is associated with fetal RBC–specific gene expression, including that of γ-globin14. However, transcripts induced by VHL protein depletion in adult erythroblasts were enriched for both adult-specific and fetal-specific genes (Extended Data Fig. 2i, j). The embryonic β-like globin gene HBE was upregulated 2-fold, although its absolute expression was only approximately one thousandth of that of HBB or HBG (Extended Data Fig. 2k). The embryonic α-like globin gene HBZ, also expressed at very low levels, was downregulated by 2-fold after VHL disruption. Overall, the results of RNA-seq and proteomic studies indicate that the disruption of VHL in adult-type erythroid cells results in the stabilization of HIF1α protein and the activation of an HIF transcriptional program that includes both adult-like and fetal-like changes in gene expression, with the major effect on hemoglobin synthesis being HbF induction.
HIF1α activates γ-globin transcription
In contrast to targeting the VHL gene alone, co-transfecting CD34+ cells with RNPs targeting VHL and HIF1A failed to induce γ-globin mRNA or HbF expression in erythroid progeny (Fig. 1h, i and Extended Data Fig. 3a). Similarly, γ-globin expression was reduced by HIF1A sgRNA in two independent VHL−/− HUDEP-2 clonal lines (Extended Data Fig. 3b–d and Supplementary Table 4a). In contrast, transducing VHL−/− HUDEP-2 clones 1 and 2 with lentiviral vectors encoding Cas9 with MYOM1 sgRNAs had no effect on γ-globin expression (Extended Data Fig. 3e, f), despite targeting frequencies of 62% to 94% (Supplementary Table 4b). Thus, VHL disruption induces γ-globin expression by stabilizing HIF1α and not by stabilizing MYOM1.
As expected, CD34+ HSPC–derived erythroblasts grown in 1% oxygen had increased expression of HIF1α, γ-globin, and HbF when compared to similar cells grown in ambient oxygen, although these effects were modest compared to those observed with VHL disruption (Extended Data Fig. 3g–i). In contrast, EGLN3 and BNIP3 were induced more strongly after exposure to 1% oxygen, indicating that the activation threshold for γ-globin transcription is higher than that for some other HIF1-regulated genes. We investigated whether HIF1 regulated the γ-globin genes directly in erythroid cells by using the Cleavage Under Targets and Release Using Nuclease (CUT&RUN) assay, which detects native protein–DNA interactions27. As expected, HIF1α chromatin occupancy was relatively low in wild-type HUDEP-2 cells and in primary erythroblasts grown in ambient oxygen (Fig. 2a). However, HIF1α occupancy was extensive after VHL protein depletion, with 7766 peaks being detected in HUDEP-2 cells and 8268 peaks being detected in CD34+ cell–derived primary erythroblasts. On a genome-wide level, HIF1α occupancy was most enriched at its cognate HRE motifs RCGTG (Fig. 2b), including those present in the target genes LDHA and BNIP3 (Extended Data Fig. 4a) 28. Of the 602 genes that were induced after VHL disruption (Supplementary Table 2), 94 contained HIF1α CUT&RUN peaks with an underlying HRE motif, suggesting direct regulation by HIF1. Of these 94 genes, 25 are included in a set of 6490 genes that are upregulated during erythropoiesis (Supplementary Table 5) 29. These findings reveal an extensive HIF1-regulated program of erythroid gene expression and are consistent with the concept that HIF proteins regulate both generally expressed genes and genes whose expression is tissue-specific genes3,30.
Fig. 2. HIF1α binds to the BGLT3 locus.
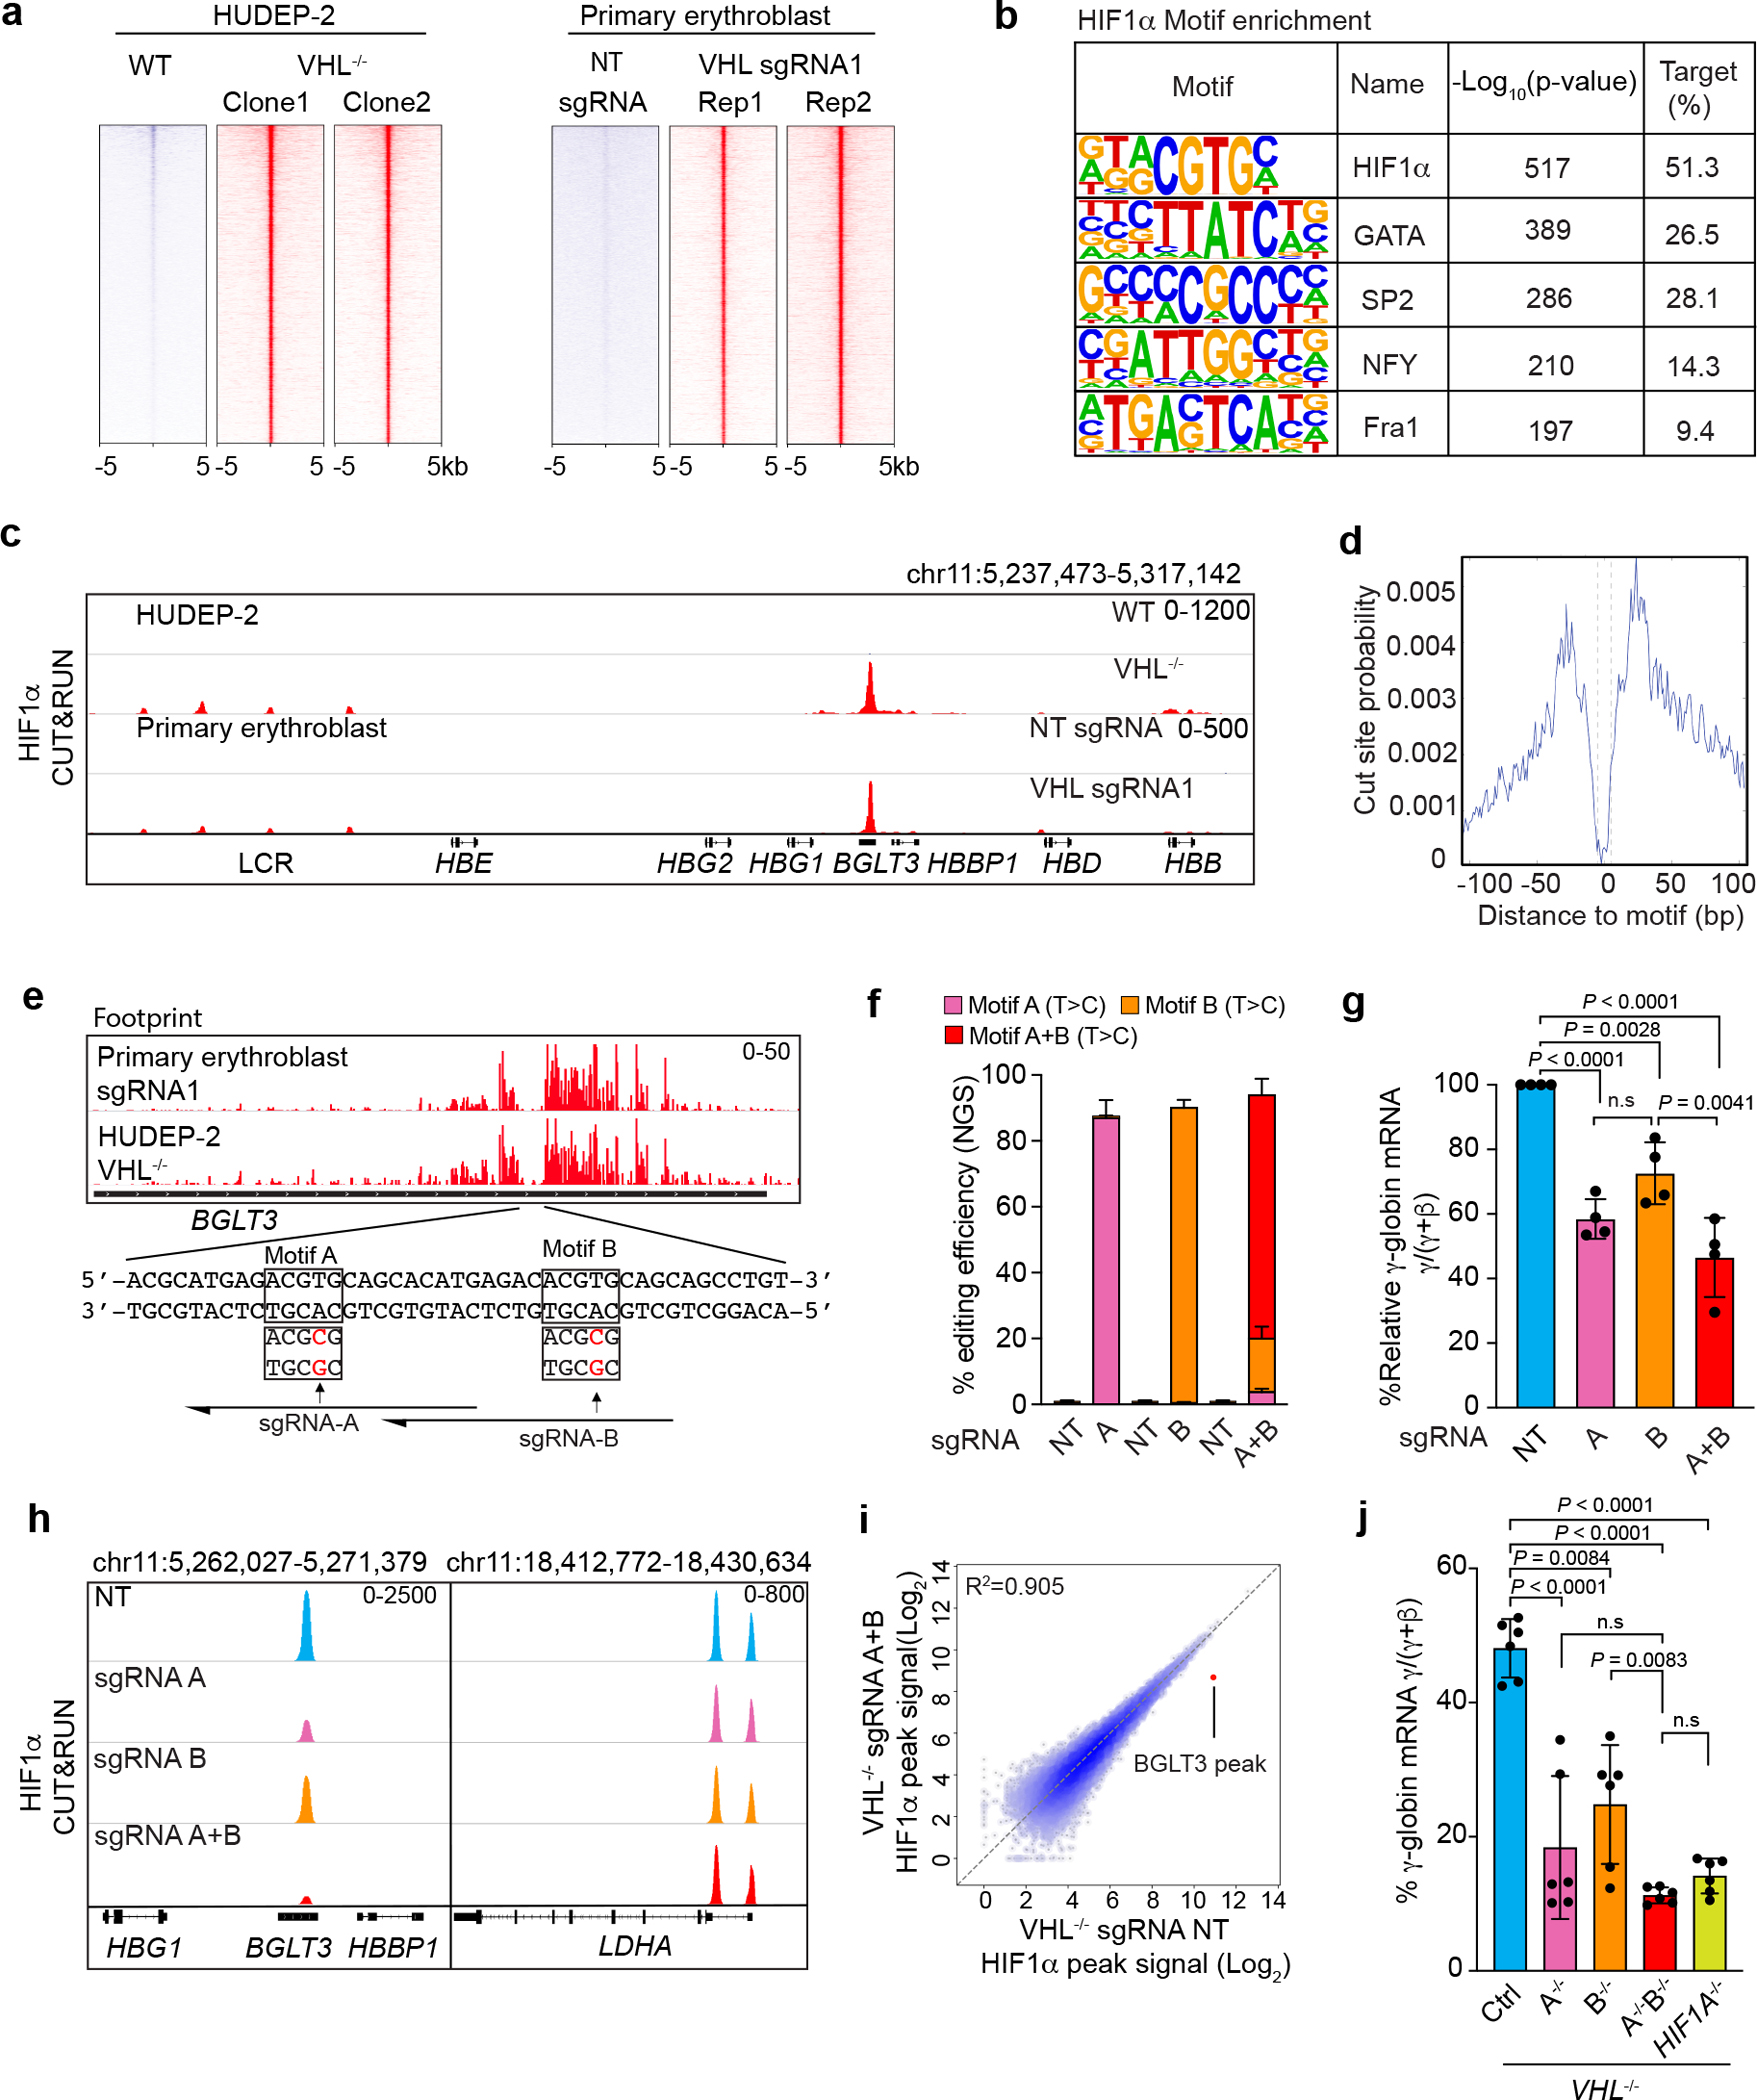
a, Heatmaps showing high-confidence CUT&RUN peaks for HIF1α occupancy in VHL−/− HUDEP-2 cells and primary erythroblasts generated by differentiation of CD34+ HSPCs transfected with Cas9 + VHL sgRNA RNP. b, DNA-motif enrichment analysis within HIF1α CUT&RUN peaks. Homer motif P-value (unadjusted) is based on a hypergeometricic distribution. c, HIF1α CUT&RUN analysis of the β-like globin gene cluster, showing BGLT3 occupancy. d, Genome-wide targeted-motif footprint analysis of HIF1α CUT&RUN data, showing cut probabilities of bases at HIF-binding hypoxia-response elements (HRE). e, CUT&RUN footprint analysis of HIF1α peaks at BGLT3. Consensus HRE motifs are boxed. f–i, VHL−/− HUDEP-2 cells (clones 1–4) were transduced with lentiviral vectors encoding ABE8-NG and sgRNAs targeting HRE motifs A or/and B, or nontargeting (NT) sgRNA and analyzed after 7 days. f, Editing efficiencies determined by NGS (mean ± s.d., n = 4 individual clones). g, Effects of BGLT3 HRE motif disruption on γ-globin expression (relative %γ-globin mRNA, normalized to NT sgRNA for each of four VHL−/− clones) (mean ± s.d., n = 4 individual clones). h, CUT&RUN analysis of HIF1α occupancy at BGLT3 (left) or the HIF target LDHA (right) in bulk base-edited cells derived from VHL−/− HUDEP-2 (clone 1). i, Genome-wide CUT&RUN analysis of HIF1α in bulk VHL−/− HUDEP-2 cells (clone 1) edited with NT sgRNA (x-axis) or sgRNAs targeting BGLT3 motifs A and B (y-axis). Dots represent high-confidence HIF1α peaks; red dot indicates the BGLT3 HIF1α occupancy peak. j, VHL−/− HUDEP-2 cells (clone 2) were treated with ABE8NG to disrupt HRE motifs A and/or B; or with Cas9 to disrupt HIF1A. Six clones of each indicated genotype were analyzed for %γ-globin mRNA (mean ± s.d.). Multiplicity-adjusted P-values between genotypes by one-way ANOVA with Tukey’s MCT in g, j.
Within the extended β-like globin gene cluster, a single HIF1α occupancy site was detected at the BGLT3 long noncoding RNA locus, a positive regulator of γ-globin expression31 (Fig. 2c). The BGLT3 HIF1α binding region contains two closely spaced HRE consensus motifs (referred to as A and B) that were resistant to micrococcal nuclease digestion, consistent with their being protected by bound HIF1α–HIF1β heterodimer (Fig. 2d, e). Across the genome, HIF1-bound chromatin exhibited a characteristic footprint of DNA cleavage by micrococcal nuclease in the CUT&RUN assay (Fig. 2d).
CUT&RUN analysis of HIF2α in VHL-disrupted erythroblasts revealed few sites of occupancy that lacked underlying DNA footprints (Extended Data Fig. 4b). In contrast, VHL-disrupted A549 cells contained extensive HIF1α and HIF2α peaks with strong DNA footprints. These findings are consistent with our gene expression studies indicating that HIF1α is the major family member expressed in erythroid cells (see Extended Data Fig. 2g, h).
To test the BGLT3 HRE motifs functionally, we created disrupting point mutations by using the adenosine base editor ABE8-NG. Four different VHL−/− HUDEP-2 cell clones were transfected with lentiviral vectors encoding ABE8-NG and sgRNA targeting motifs A and/or B (Fig. 2e). Adenosine base editors convert A to G (T to C on the opposite strand). Efficient (>80%) disruption of motif A or B separately caused reductions of 50% and 40%, respectively, in γ-globin mRNA (Fig. 2f, g). Simultaneous mutations at both motifs at an efficiency of approximately 70% caused a 60% reduction in γ-globin mRNA. CUT&RUN analysis showed that mutations in motifs A and/or B caused additive reductions in HIF1α occupancy at BGLT3, with no effects on HIF1α occupancy at other genes (Fig. 2h, i and Extended Data Fig. 4c–e). Next, we generated and examined VHL−/− HUDEP-2 cell clones with homozygous disruptions in motifs A and/or B, or HIF1A (Fig. 2j). Similar to our findings in bulk-edited cells, disruption of motif A or B inhibited γ-globin expression. Loss of motif A alone or of motifs A and B together reduced γ-globin mRNA by a similar extent as loss of HIF1A. Therefore, the induction of γ-globin by HIF1α is mediated exclusively through its binding to BGLT3 HRE motifs, which exhibit partially redundant activities, with motif A being the more potent.
The developmental regulation of γ-globin expression is similar in humans and in Old-World monkeys32, and their HIF-binding BGLT3 HRE motifs are conserved (Extended Data Fig. 5a). However, baboons and rhesus macaques harbor high-frequency single-nucleotide polymorphisms (SNPs) that are predicted to disrupt HIF binding and its induction of HbF (Extended Data Fig. 5b, c). This finding may explain the variability of HbF induction during stress erythropoiesis, which has been observed in baboons and has been attributed to genetic factors15,16. In contrast, genetic variants in the human BGLT3 HREs are rare (Extended Data Fig. 5d).
HIF1α-induced epigenetic changes at BGLT3
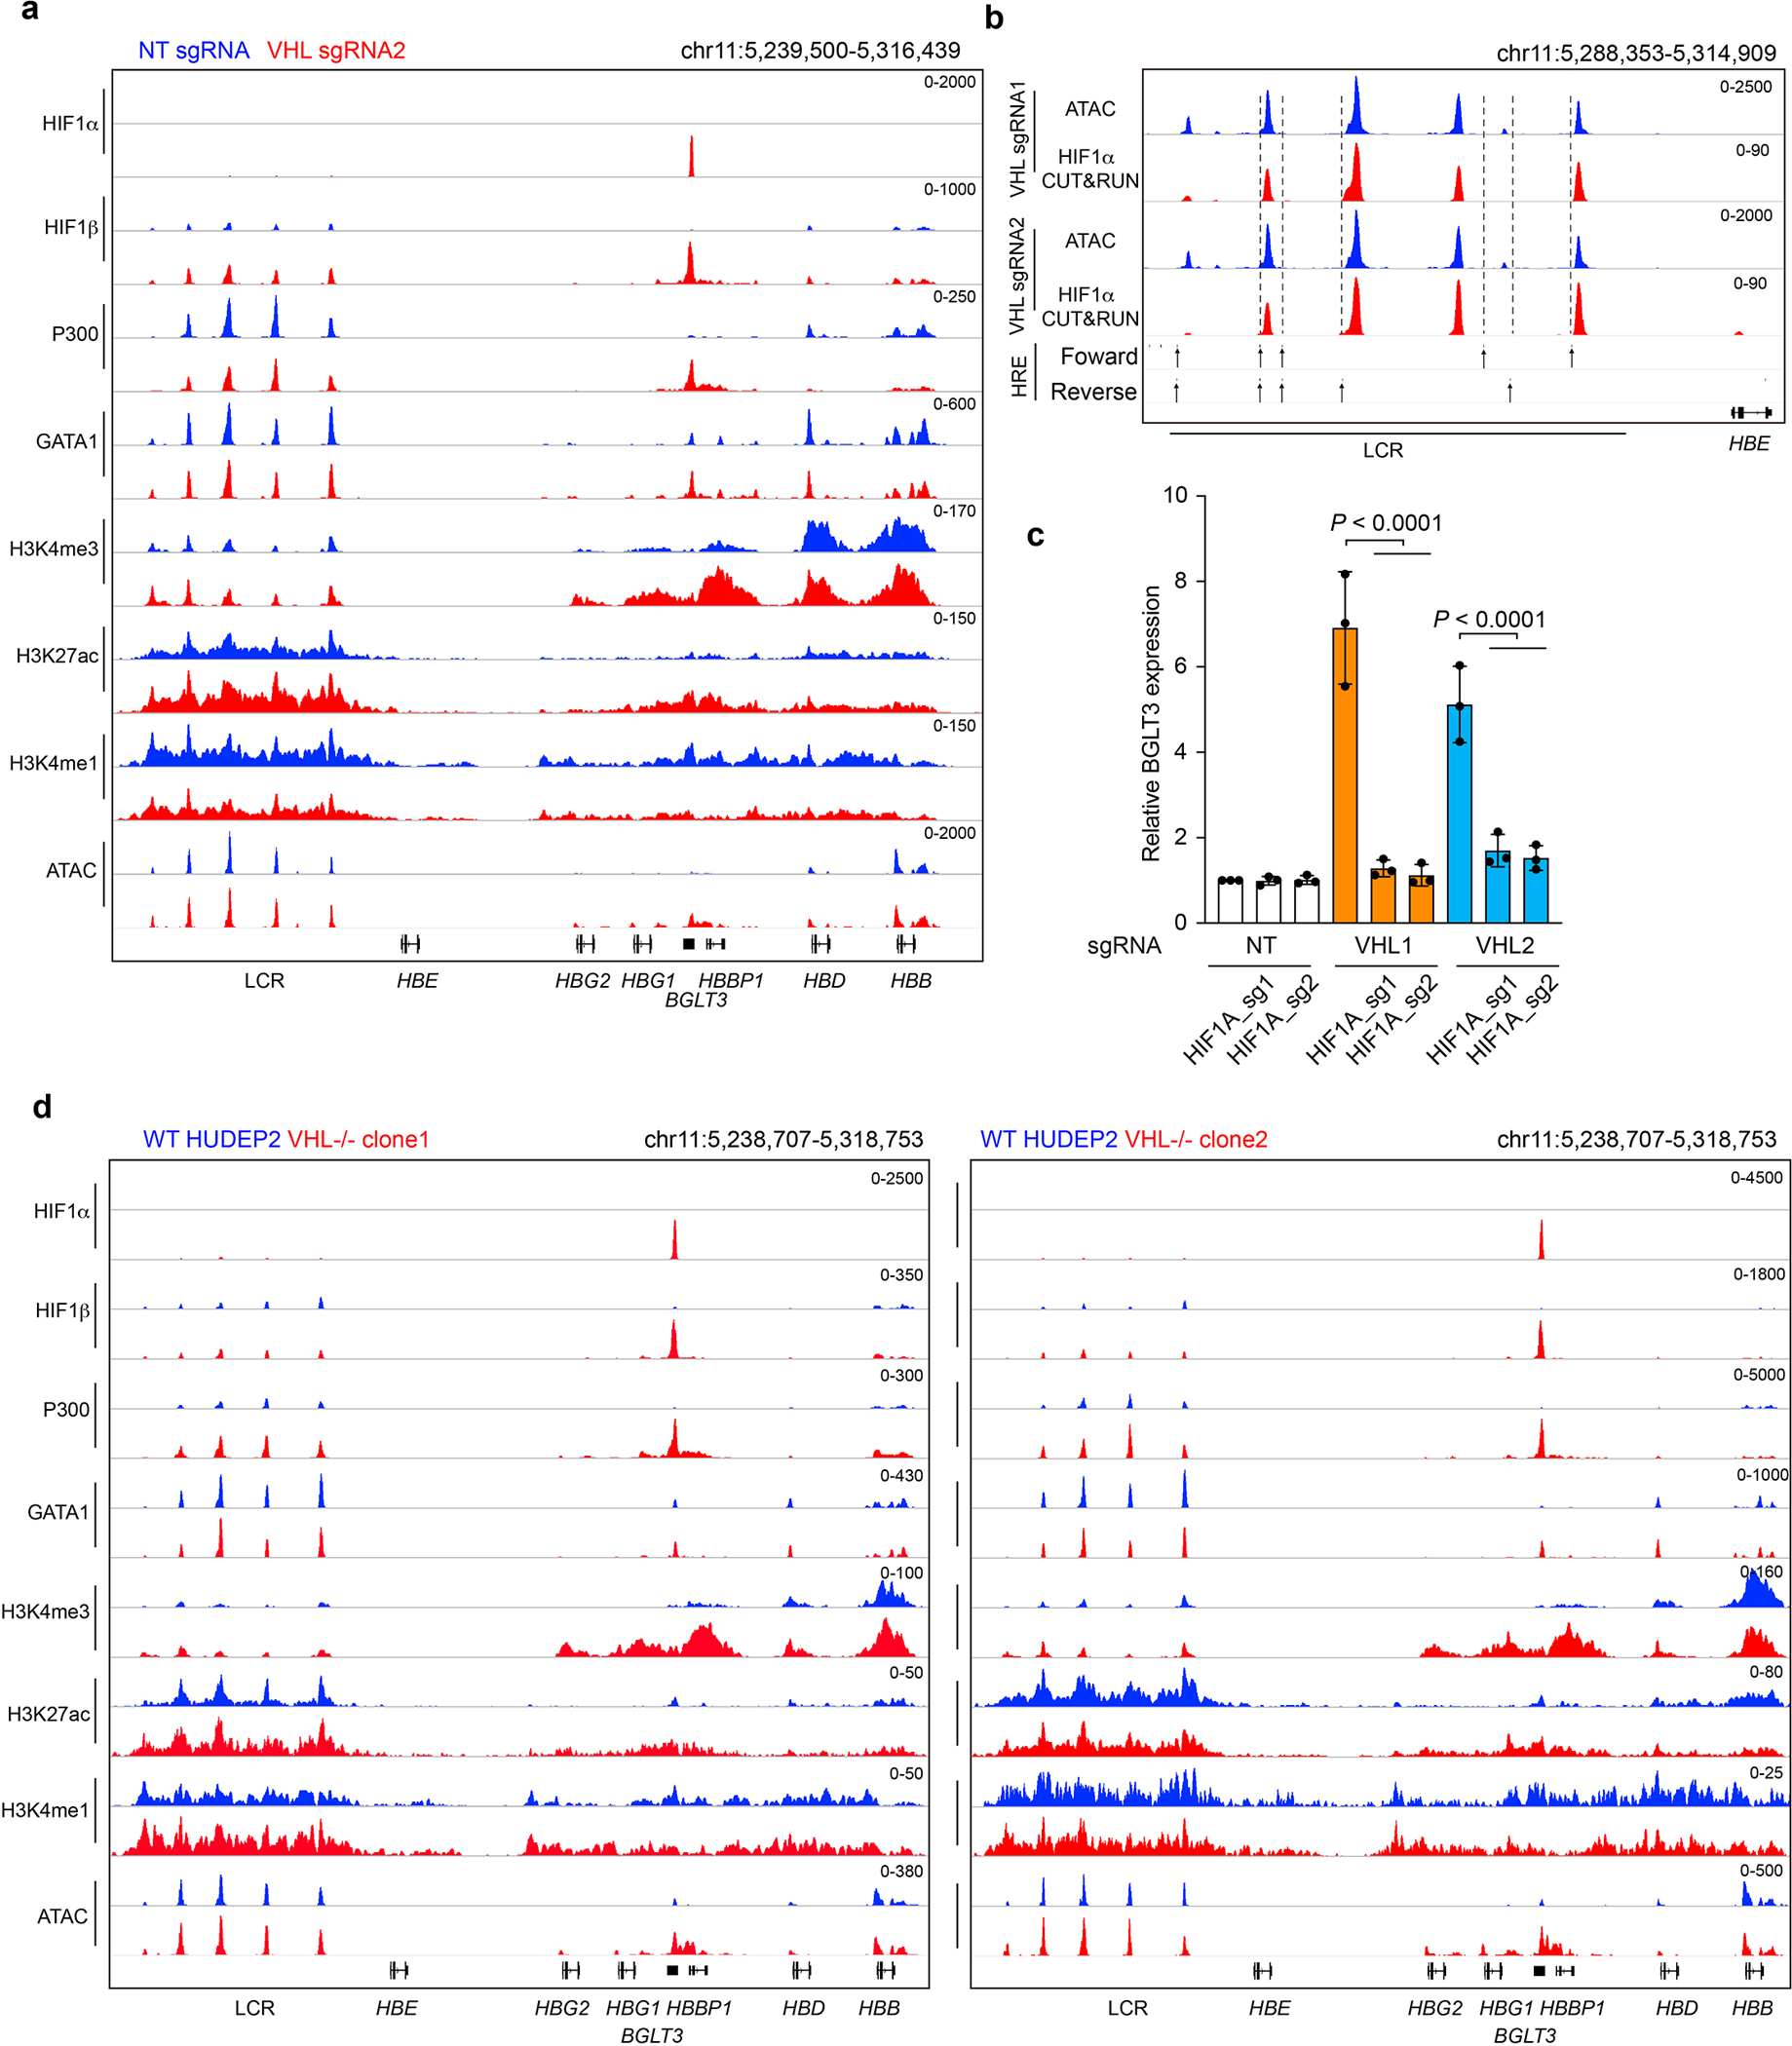
The BGLT3 gene is thought to activate γ-globin gene expression in cis by serving as an enhancer and in trans through its long noncoding RNA31. We used CUT&RUN to analyze protein occupancy and epigenetic marks of enhancer activity at BGLT3 after VHL protein depletion. We obtained similar results in erythroid cells generated from CD34+ HSPCs that were treated with Cas9 and two different VHL sgRNAs, analyzed separately, and in two different VHL−/− HUDEP-2 cell clones (Fig. 3a and Extended Data Figs. 6 and 7). Depletion of VHL protein resulted in strong signals for HIF1α and HIF1β occupancy at BGLT3. We observed low-magnitude HIF1α and HIF1β CUT&RUN peaks within open chromatin regions of the LCR (Extended Data Fig. 6b). These peaks lack underlying HREs and are unlikely to be bound by HIF122. Binding of HIF1 to BGLT3 was accompanied by regional recruitment of GATA1 and p300, increased histone marks in the form of H3K4me3 and H3K27ac, ATAC-seq signals reflecting open chromatin, and induction of BGLT3 long noncoding RNA. Many of these features are characteristic of active erythroid enhancers33. As expected, H3K4me1, which marks poised and active enhancers34, was unchanged at the γ-globin promoters and was decreased slightly at BGLT3 after VHL disruption. These findings indicate that the HIF1α–HIF1β heterodimer induces a shift from β-globin to γ-globin expression by activating enhancer-like features of BGLT3. Two other erythroid genes (the α-like globin locus and ZBTB7A) in VHL-disrupted erythroblasts showed low-level CUT&RUN signals for HIF1α or HIF1β with no underlying HRE motifs and minimal changes in the occupancy of other transcription factors or histone modifications, suggesting that these loci are not regulated directly by HIF1 (Extended Data Fig. 7a, b).
Fig. 3. HIF1α-induced transcription factor binding and epigenetic changes at the β-like globin gene cluster in primary erythroblasts.
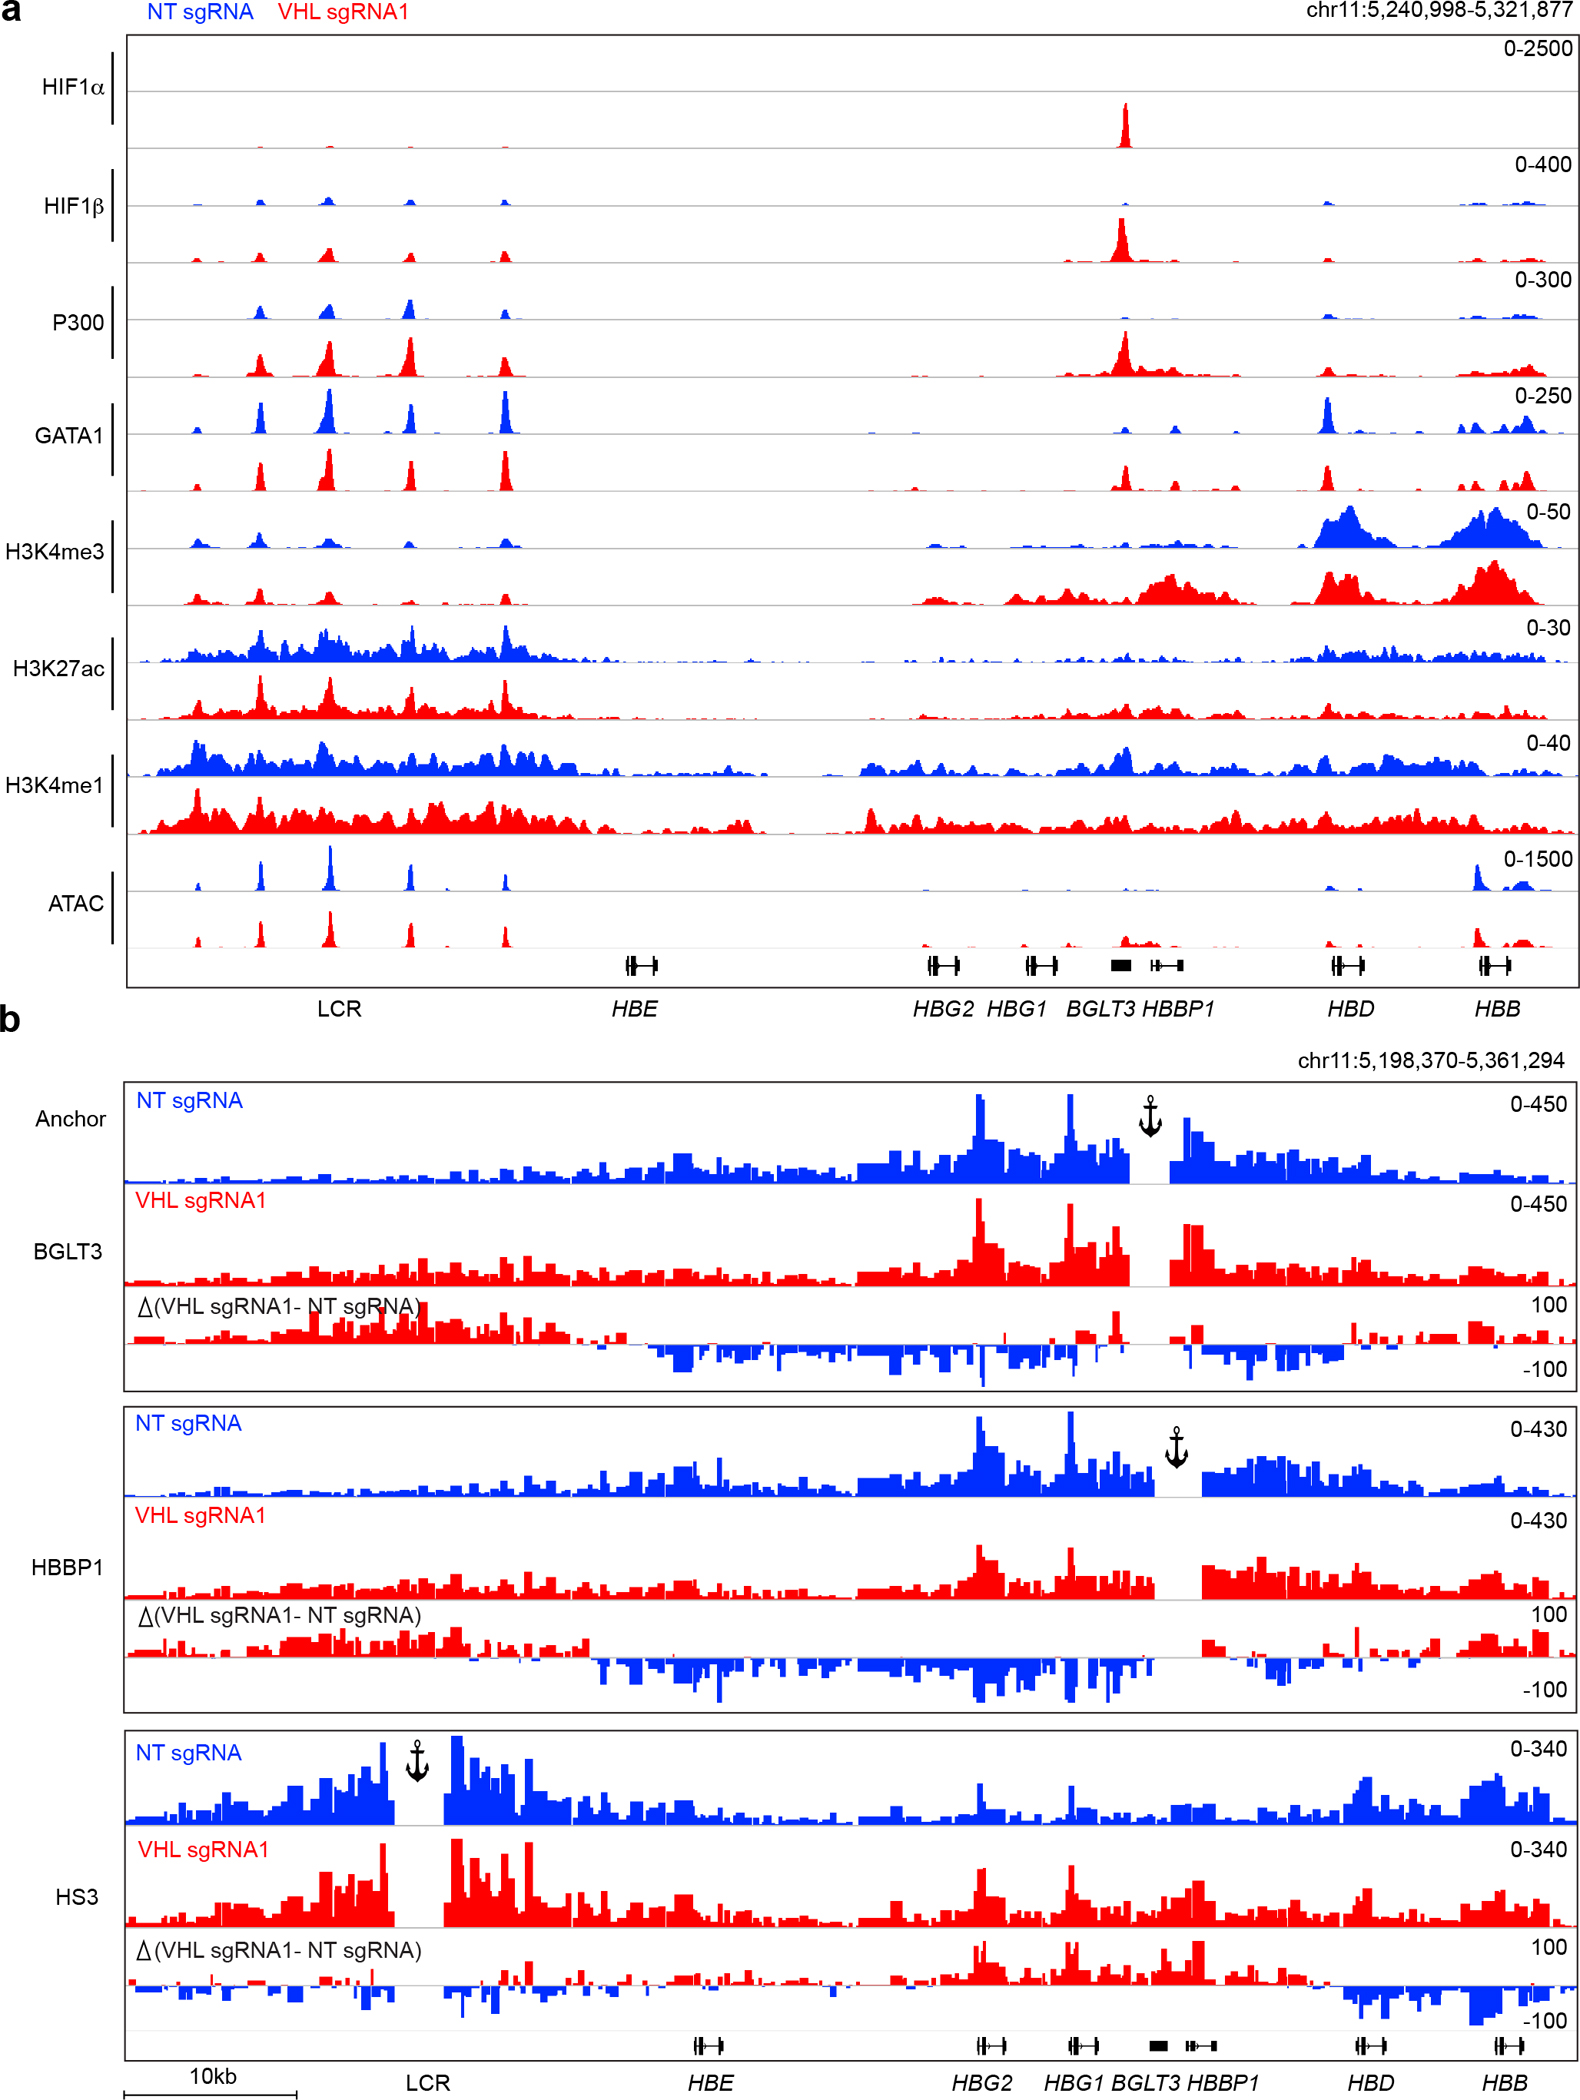
Normal adult donor CD34+ cells were transfected with RNP containing Cas9 + VHL-targeting sgRNA1 or nontargeting (NT) sgRNA, maintained in culture with erythroid cytokines, and analyzed after 11 days. a, Genome Browser screenshot showing transcription factor occupancy and histone modifications determined by CUT&RUN analysis and open chromatin regions identified by ATAC-seq. b, Capture-C analysis to identify chromatin looping, performed at day 11 of erythroid differentiation. Data are shown as combined reads from two biological replicate experiments using CD34+ HSPCs from different donors (see also Extended Data Fig. 7b). Anchors are indicated at the BGLT3, HBBP1, and Locus Control Region (LCR) HS3 regions.
HIF1 promotes LCR–γ-globin interactions
The relative transcription levels of γ-globin (encoded by HBG1 and HBG2) and β-globin (encoded by HBB) are controlled by competition for long-range interactions with the LCR9. We used Capture-C to investigate how VHL protein depletion and HIF1 binding to BGLT3 altered these interactions in CD34+ HSPC–derived erythroblasts (Fig. 3b and Extended Data Fig. 7c). Using BGLT3 or the adjacent HBBP1 globin pseudogene as anchors, we found that these genes interacted with the γ-globin genes in a similar manner in both VHL protein–depleted and control cells. However, VHL protein depletion and HIF1 occupancy at BGLT3 were associated with a reduced interaction between this region and the embryonic β-like globin gene HBE. This finding is consistent with a previous report that interaction of the BGLT3–HBBP1 region with HBE inhibits looping between the γ-globin genes and the LCR35. In support of this, Capture-C performed using the LCR as an anchor showed that this region is redirected from β-globin (HBB) to γ-globin (HBG1/HBG2) and BGLT3/HBBP1 by VHL protein depletion. Capture C analysis of BCL11A, which is not regulated by the VHL protein, showed no differences in long-range interactions between its promoter and nearby regions after VHL protein depletion (Extended Data Fig. 8d).
Prolyl hydroxylase inhibitors induce HbF
Stabilization of HIF2α/EPAS1 activates the erythropoietin gene (EPO) to drive RBC production36–38. Accordingly, prolyl hydroxylase inhibitors (PHIs) are being investigated as possible treatments for anemia associated with chronic kidney failure39,40. To determine whether a PHI can stabilize HIF1α to induce HbF, we performed in vitro erythroid differentiation of normal donor CD34+ HSPCs with the PHI FG4592 (Roxadustat) present39. Treatment with FG4592 caused HIF1α occupancy at BGLT3 (Fig. 4a) and increases in the percentages of F-cells and HbF (Fig. 4b, c). Importantly, Cas9 disruption of HIF1A blocked the induction of HbF by FG4592 (Fig. 4b, c and Extended Data Fig. 8a). The induction of γ-globin by FG4592 was no more than one tenth of that of the HIF1 target genes LDHA and BNIP3 (Extended Data Fig. 8b–e). However, in erythroblasts generated from CD34+ cells from healthy individuals or those with SCD, FG4592 raised HbF expression to levels similar to those induced by hydroxyurea, a drug commonly used to treat SCD that induces HbF through unknown mechanisms, and the two drugs had an additive effect when used together (Fig. 4d and Extended Data Fig. 8f, g). Treatment of SCD RBCs with FG4592 or hydroxyurea resulted in hypoxia-induced sickling being reduced by more than half with each drug, although the two drugs did not have an additive effect in this assay, perhaps because the combination was excessively toxic to erythroid precursors generated in vitro (Fig. 4e, f and Extended Fig. 8h).
Fig. 4. The proline hydroxylase inhibitor FG4592 induces γ-globin and HbF in primary erythroblasts.
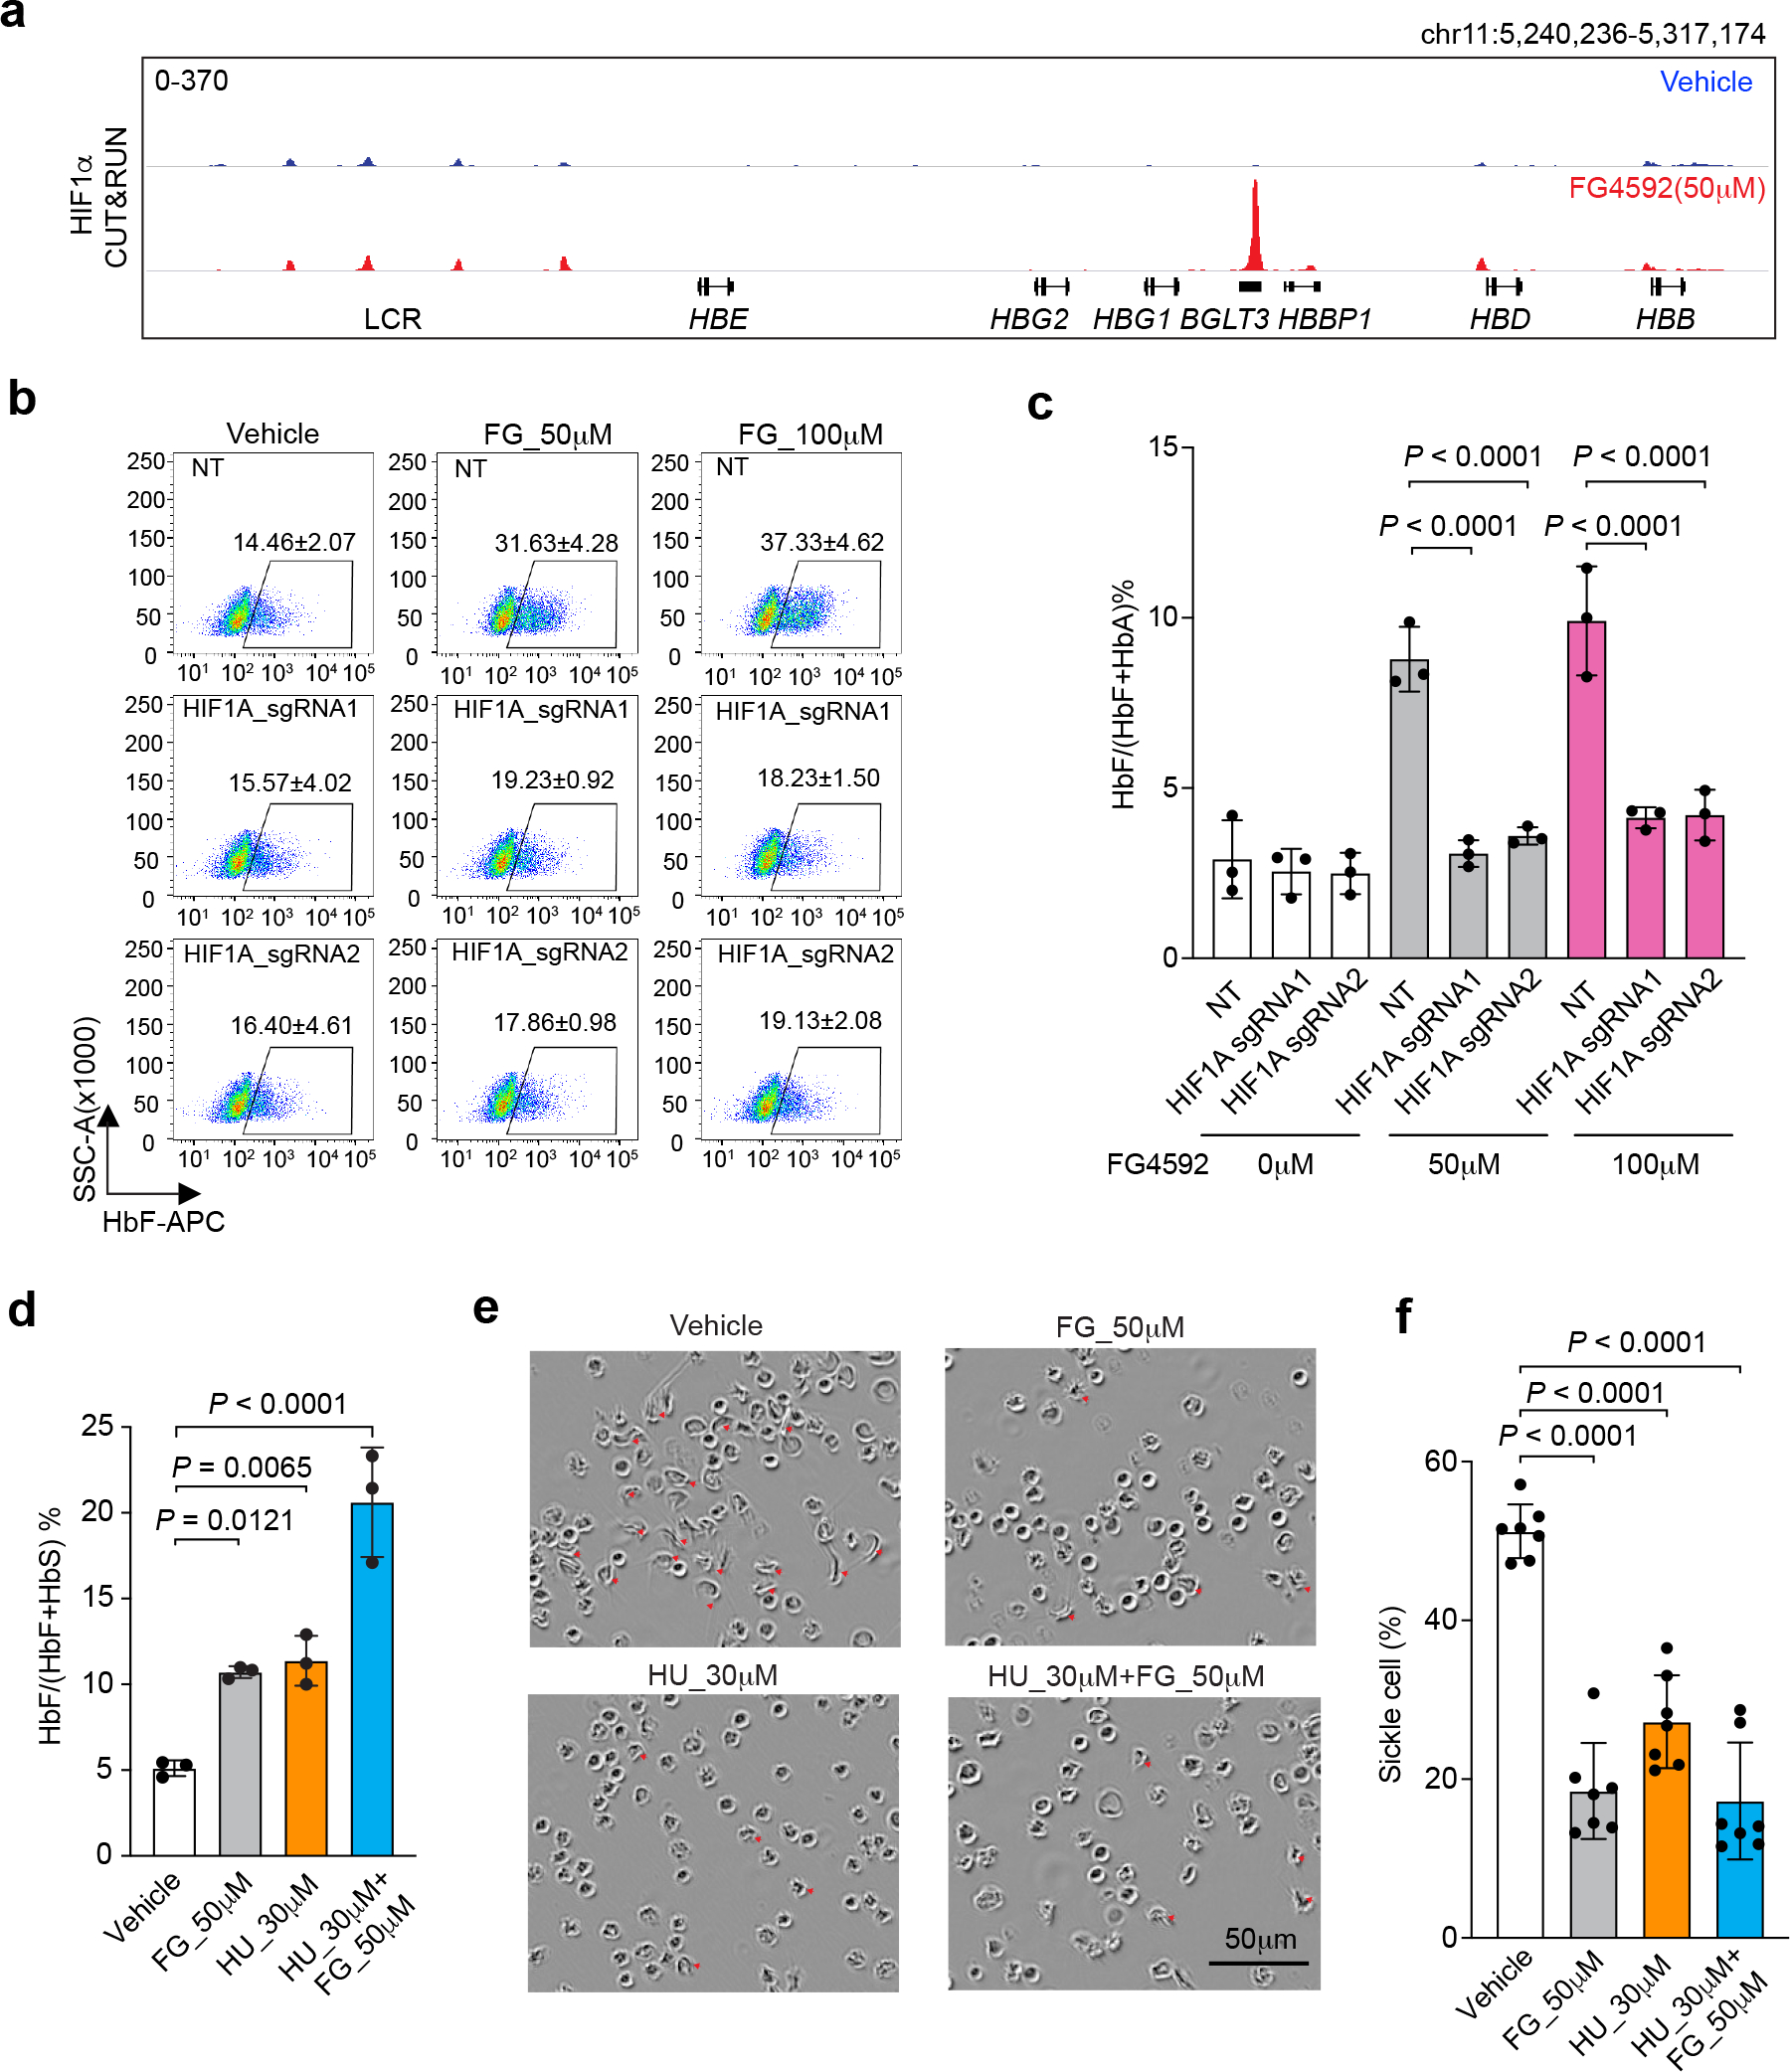
a–d, Normal adult donor CD34+ HSPCs were edited with RNP consisting of Cas9 + HIF1A sgRNA or nontargeting (NT) sgRNA, after which erythroid differentiation was induced. FG4592 and/or hydroxyurea (HU) were added on culture day 5, and cells were analyzed at day 15. a, HIF1α occupancy at BGLT3, determined by CUT&RUN analysis of erythroblasts after treatment with FG4592 (50 μM) or vehicle. b, Representative flow-cytometry data showing F-cells. The mean ± s.d. from three biological replicate experiments using CD34+ cells from different healthy donors are shown. c, %HbF expression on day 15 (mean ± s.d., n = 3 independent experiments using different donor CD34+ cells). Multiplicity-adjusted P-values obtained by ordinary one-way ANOVA with Šídák’s MCT between selected groups are shown. d–f, Erythroid differentiation was induced in peripheral blood mononuclear cells (PBMCs) from donors with sickle cell disease. Drugs were added on day 5. d, %HbF determined at day 15 (mean ± s.d., n = 3 independent experiments using different SCD donor PBMCs). e, On day 19 of differentiation, reticulocytes were isolated by flow cytometry then incubated in 2% O2 for 12 h. Representative images show sickled red blood cells. f, Quantification of sickled cells in e (mean ± s.d., n = 7 cells field counts examined over 4 independent experiments). Multiplicity-adjusted P-values were determined by ordinary one-way ANOVA with Dunnett’s MCT against vehicle in d, f.
Discussion
The activation of HIF pathways during systemic hypoxia or blood loss contributes to stress erythropoiesis through several mechanisms. For example, HIF2 stimulates specialized kidney cells to produce erythropoietin, a hormone that enhances the survival and proliferation of RBC progenitors36,38,41. Additionally, suppression of hepatic hepcidin production by HIF is predicted to support erythroid hemoglobin synthesis by mobilizing iron from internal stores, and by enhancing dietary iron absorption42. In erythroid precursors, HIF1 cooperates with the stress-activated glucocorticoid receptor to induce the expression of self-renewal genes43. Thus, HIF proteins interact with numerous signaling pathways to support stress erythropoiesis through cell-intrinsic and cell-extrinsic mechanisms. This study has identified an extensive erythroid cell–intrinsic program of HIF1-regulated transcription that includes γ-globin gene activation.
Correlations between hypoxia, elevated erythropoietin levels, and HbF induction, recognized for more than 40 years, have led to the hypothesis that HIF stimulates HbF production44. By examining erythroid cell lines and primary erythroblasts maintained in culture, our study has provided definitive proof that HIF1 induces HbF expression by binding to HRE motifs in BGLT3 to recruit coactivators, open chromatin, and stimulate DNA looping between the γ-globin genes and the LCR (Extended Data Fig. 9). Most mammals express fetus-specific globins with enhanced oxygen affinity, which probably evolved to promote oxygen transfer from the maternal circulation to the hypoxic uterine environment45. By the same teleology, HIF1-mediated induction of HbF in RBCs of higher primates may represent a recent evolutionary adaptation to enhance arterial RBC oxygenation during postnatal hypoxic stresses, consistent with the results of studies showing that enhanced Hb oxygen affinity confers physiologic benefits on adult-type RBCs in low-oxygen environments46,47.
Notably, individuals with Chuvash polycythemia who harbor a germline VHL mutation that stabilizes HIFα proteins exhibit elevated erythropoietin levels but no HbF induction48. However, HIFα stabilization in this disorder is believed to be relatively low-level49 and may be insufficient to induce γ-globin transcription. It will be informative to measure HbF expression in individuals with other germline mutations that stabilize HIF proteins. Our data predict stabilization of HIF2α but not HIF1α will cause erythrocytosis without HbF induction.
HIF1-binding HRE motifs within the BGLT3 region of the β-like globin gene cluster are restricted to humans and Old-World monkeys, which exhibit similar patterns of perinatal γ-to-β globin gene switching. Hence, it will be important to investigate the physiological implications of our findings in these species. For example, our results raise the possibility of using PHIs therapeutically to induce HbF for SCD or β-thalassemia. In a previous study, administering a PHI to rhesus macaques caused only a modest induction of HbF44. This species harbors high-frequency BGLT3 SNPs that are predicted to disrupt HIF binding, which could impair HbF induction by PHI drugs (Extended Data Fig. 5b). Analysis of available genomic sequences from 1158 rhesus macaques revealed that approximately 59% had germline disruption of at least one BGLT3 HIF1 binding motif. These motifs are more highly conserved in humans (Extended Data Fig. 5d), indicating the potential for stronger, more consistent HbF induction with PHI therapy. Therefore, it will be interesting to quantify RBC HbF levels in individuals with renal failure who are on PHIs to stimulate erythropoiesis.
The induction of HbF by VHL disruption has revealed a new facet of globin gene regulation. More broadly, we have shown that the loss of VHL protein in erythroid cells results in an extensive HIF-related program of gene expression, including the activation of canonical targets that regulate metabolic adaptation to hypoxia (see Fig. 2a and Extended Data Fig. 2d). Moreover, VHL disruption causes the induction of erythroid genes that are specifically expressed during fetal development. As hematopoiesis occurs in hypoxic niches throughout ontogeny and HIF proteins play important roles in hematopoiesis50, it is likely that PHD–VHL–HIF oxygen-sensing pathways regulate normal and pathologic erythropoiesis in utero and postnatally.
Methods
HUDEP-2 cell culture and induced erythroid maturation
HUDEP-2 cells were maintained in expansion medium consisting of Serum-Free Expansion Medium (SFEM) (Stem Cell Technologies, #09650) supplemented with 50 ng/mL recombinant human stem cell factor (SCF) (R&D systems, #255-SC), 1 μg/mL doxycycline (Sigma-Aldrich, #D9891), 0.4 μg/mL dexamethasone (Sigma-Aldrich, #D4902), 3 IU/mL erythropoietin (Epogen, Amgen), and 1% penicillin–streptomycin solution (Gibco, #15140122). Differentiation medium for HUDEP-2 cells consisted of Iscove’s Modified Dulbecco’s Medium (IMDM) (Thermo Fisher, #12440053) supplemented with 330 μg/mL human holo-transferrin (Sigma, #T0665), 10 μg/mL human insulin (Sigma, #I9278), 2 IU/mL heparin (Sigma, #H3149), 5% inactivated human plasma (Octaplas, blood group AB, Octapharma), 3 IU/mL erythropoietin (Amgen), 2% fetal bovine serum (FBS), 1 μg/mL doxycycline, and 1% penicillin–streptomycin solution. Cells have been tested Mycoplasma free.
Lentiviral vector preparation
Vectors were produced in HEK293T cells grown in DMEM supplemented with 10% fetal bovine serum, 1% penicillin–streptomycin, 1% L-glutamine, and 100 μM sodium pyruvate. One day before transfection with vector plasmids, 5 × 10⁶ HEK293T cells were plated into 10-cm plates with penicillin–streptomycin–free medium. Thirty minutes before transfection, 12 μg of transgene-encoding expression vector was mixed with packaging plasmids, i.e., 6 μg of pCAGkGP1.1R (gag/pol), 2 μg of pCAG4-RTR2 (rev/tat), and 2 μg of pCAG-VSVG (VSV-G envelope) in 500 μL of OPTI-MEM (Thermo Fisher Scientific, #31985070), and added to 500 μL of OPTI-MEM mixed with 50 μL of Lipofectamine™ 2000 Transfection Reagent (Thermo Fisher Scientific, #11668027). Mixtures were added to HEK293T cells, which were then incubated at 37°C in 5% CO2 for 6 h. Fresh medium was then placed on the cells, and viral vector supernatants were harvested 48 h after transfection.
CRISPR/Cas9 screen for ubiquitin–proteasome components that regulate HbF production.
A pooled lentiviral vector library encoding 3143 single-guide (sg) RNAs targeting 776 genes encoding ubiquitin ligases, accessory proteins, and deubiquitinases (Supplementary Table 1a) was generated by the Genetic Perturbation Platform of the Broad Institute20. The vector used was lentiGuide-Puro (Addgene plasmid 52963) 51, which contains a puromycin resistance cassette for selection. Approximately 3.5 × 10⁶ HUDEP-2 cells stably expressing Cas9 were transduced with the lentiviral vector library at a multiplicity of infection (MOI) of 0.3 (fig. S1A). After 24 h, transduced cells were selected in puromycin (1 μg/mL) for 3 days and then maintained in expansion medium for 5 days. Erythroid maturation was induced by switching the medium to differentiation medium for 5 days, followed by incubation with an anti-fetal hemoglobin (HbF) monoclonal antibody conjugated to APC (Supplementary Table 6). Cell populations with the 10% highest and lowest anti-HbF staining intensities were purified by fluorescence-activated cell sorting (FACS) and analyzed for sgRNA representation by next-generation sequencing (NGS).
Genomic DNA was extracted using the DNeasy Blood and Tissue kit (Qiagen). PCR amplicons were generated using lentiGuide-Puro universal primers that included a handle sequence. A second PCR amplification was performed by using handle-specific primers to add adaptors and indexes to each sample. PCR products were separated on 2% agarose gels, and DNA bands of the expected size was excised and purified. MiSeq 300-bp paired-end sequencing (Illumina) was performed. All PCR primers are listed in Supplementary Table 7b. Candidate HbF regulators were identified by analyzing sequencing data using the model-based analysis of genome-wide CRISPR–Cas9 knockout (MAGeCK) (version 0.5.9.4) computational tool52. The gene-level HbF enrichment scores are listed in Supplementary Table 1b.
CD34+ HSPC culture and in vitro erythroid differentiation
Circulating human G-CSF–mobilized mononuclear cells were obtained from de-identified healthy adult donors (Key Biologics, Lifeblood). CD34+ hematopoietic stem and progenitor cells (HSPCs) were enriched by immunomagnetic bead selection, using a CliniMACS Plus or AutoMACS instrument (Miltenyi Biotec). Erythroid differentiation of CD34+ cells was performed using a three-phase culture protocol. For phase 1 (days 0–7), cells were maintained at a density of 1–4 × 10⁵/mL in IMDM supplemented with 2% human AB plasma, 3% human AB serum, 1% penicillin–streptomycin, 3 IU/mL heparin, 200 μg/mL holo-transferrin, 1 IU erythropoietin, 10 ng/mL SCF, and 1 ng/mL interleukin-3 (IL-3). For phase 2 (days 8–12), IL-3 was omitted from the medium and the cells were maintained at a density of 0.2 0.8 × 10⁶/mL. For phase 3 (days 12–18), IL-3 and SCF were omitted, the holo-transferrin concentration was increased to 1 mg/mL, and the cells were maintained at a density of 1–2 × 10⁶/mL. Erythroid maturation was assessed by staining cells with antibodies against CD49d (BV421 conjugated), CD235a (FITC conjugated), and Band3 (APC conjugated) (Supplementary Table 6) and then performing flow-cytometry analysis using a BD LSRFortessa system. Data was collected with BD FACs Diva (version 9) and analyzed with FlowJo (version 10.4.1). Hematopoietic progenitors from individuals with SCD were obtained from discarded blood specimens after phlebotomy or red blood cell exchange transfusions. This was considered “not human subject research” by the St. Jude Institutional Review Board because the samples were deidentified. In vitro erythroid differentiation was performed and analyzed as described above. Cells have been tested Mycoplasma free.
CRISPR/Cas9 gene disruption in HUDEP-2 cells
HUDEP-2 cells stably expressing Cas9 and maintained in expansion medium were transduced with lentiGuide-Puro vector (Addgene, plasmid #52963) encoding targeting sgRNA or control nontargeting sgRNA. After 24 h, 1 μg/mL puromycin (Thermo Fisher Scientific, #A1113803) was added. Transduced cells were enriched by selection puromycin for a total of 4 days. For some experiments, erythroid maturation was induced by transferring the cells to HUDEP-2 differentiation medium for 5 days. Editing frequencies were determined by targeted amplicon sequencing using primers described in Supplementary Table 7b, followed by analysis with CRIS.py (version 1) 53 or TIDE (version 3.3.0) 54.
Gene disruption in CD34+ HSPCs
Electroporation of the Cas9–sgRNA ribonucleoprotein (RNP) complex was performed with a Lonza 4D-Nucleofector System, using electroporation program DS-130. CD34+ HSPCs were thawed 24 h before electroporation. RNPs were formed by mixing Cas9 3X-NLS (40 pmol) 55 and sgRNA (120 pmol) and incubating the mixture for 20 min at room temperature before electroporation. Electroporation was performed by mixing 2 μL of RNP complex with 2 × 10⁵ cells resuspended in 18 μL of P3 buffer (Lonza). After electroporation, cells were transferred to CD34+ cell erythroid differentiation medium. On-target insertion-deletion mutations were measured at day 7 by NGS of PCR products generated around the target site, followed by analysis using CRIS.py (version 1) 53 or TIDE (version 3.3.0) 54.
A549 cell culture and gene disruption
A549 cells were purchased from the American Type Culture Collection (ATCC) and grown in culture in Ham’s F-12K (Kaighn’s) Medium (Gibco, #21127022) supplemented with 10% fetal bovine serum and 1% penicillin–streptomycin. The medium was replaced every 2–3 days. 2 × 10⁵ cells were collected through trypsinization and electroporated with RNP complex using the SF Cell Line 4D-Nucleofector X Kit S (Lonza, #V4XC-2032), program CM-130. After electroporation, cells were seeded in penicillin–streptomycin–free A549 culture medium and analyzed after 5 days. Cells have been tested Mycoplasma free.
Hemoglobin quantification
Cells were lysed with hemolysate reagent (Helena Laboratories), then hemoglobins were quantified by high-performance liquid chromatography (HPLC), using a PolyCAT A ion-exchange column (PolyLC Inc., #202CT0510) on a Prominence HPLC System (Shimadzu Corporation) with LabSolutions Software, v.5.81 SP1. The eluted proteins were identified by light absorbance at 418 nm using a diode array detector. The relative amounts of the different hemoglobins were calculated from the areas under the peaks and normalized to a DMSO control.
Fetal hemoglobin (HbF) immunostaining and flow cytometry analysis
Cells were fixed in 0.05% glutaraldehyde for 10 min at room temperature, washed three times with 0.1% BSA PBS, and then permeabilized with 0.1% Triton X-100 for 4 min. Cells were incubated with HbF-APC−conjugated antibody (Supplementary Table 6) for 20 min in the dark. Analytical flow cytometry was performed on a BD FACSCanto instrument, data was collected with BD FACs Diva (version 9) and analyzed with FlowJo (version 10.4.1).
Annexin V staining
Cells were collected and washed twice with cold PBS then resuspended in 1× binding buffer (10 mM HEPES, pH 7.4, 140 mM NaCl, 2.5 mM CaCl2) at a concentration of approximately 1 × 10⁶ cells/mL. 1 × 10⁵ cells (100 μL) mixed with 5 μL of anti-annexin V-APC antibody and 0.1μg/mL DAPI and incubated for 15 min at room temperature in the dark. After this incubation. 400 μL of 1× binding buffer was added, after which flow cytometry analysis was performed within 1 h. Analytical flow cytometry was performed on a BD FACSCanto instrument, data was collected with BD FACs Diva (version 9) and analyzed with FlowJo (version 10.4.1).
RNA sequencing (RNA-seq)
By using the RNeasy Mini Kit (Qiagen), RNA was extracted from 2 million CD34+ HSPC–derived erythroblasts that had been electroporated with NT and VHL sgRNA1 RNP complex (two replicates each). A TruSeq Stranded mRNA Library Prep Kit (Illumina) was used to enrich for polyA+ RNA and to create libraries for HiSeq 4000 sequencing (Illumina). RNA-seq reads were aligned to the hg19 human genome. Counts were normalized using VOOM (https://rdrr.io/bioc/limma/man/voom.html), and differential expression analysis was performed using limma56.
Differentially regulated genes were defined as those having a false-discovery rate (FDR) of <0.05 and a log2 fold change greater than 1 (for upregulated genes) or less than −1 (for downregulated genes). To identify upregulated genes with HIF1A binding, replicate HIF1A CUT&RUN peaks were merged by using the BEDOPS (version 2.4.40) intersect program57. The peaks were annotated with HOMER annotatePeaks.pl (http://homer.ucsd.edu/homer/ngs/annotation.html) to identify the nearest gene58. Genes that are differentially regulated during erythropoiesis were identified from clusters k4–k6, as described by Ludwig et al29.
Proteomics
Aliquots of 1 × 10⁷ CD34+ HSPC–derived erythroblasts electroporated with NT and VHL sgRNA1 RNP complex (three replicates each) were used for proteomics analysis according to standard methods20.
Real-time quantitative PCR (RT-qPCR)
Primers used for RT-qPCR were purchased from IDT (Supplementary Table 7b). RNA from approximately 0.5 million to 1 million cells was extracted using the RNeasy Plus Kit (QIAGEN). Complementary DNA (cDNA) was prepared with an iScript cDNA Synthesis Kit (Bio-Rad, #1708891) in accordance with the manufacturer’s recommendations for 200 ng of mRNA. RT-qPCR was performed using SybrSelect Master Mix (Thermo Fisher, #4472908) on an Applied Quant Studio 6 real-time PCR system. Parameters for PCR were as follows: Step 1 (one cycle), 50°C for 2 min, 95°C for 10 min; Step 2 (40 cycles): 95°C for 15 s, 60°C for 1 min; Step 3: 95°C for 15 s, 60°C for 1 min, and 95°C for 15 s. Quantification was performed on Excel 2019 (version 16.15), by using the ΔΔCT method.
Cell proliferation assay
NT or VHL sgRNA1/2–treated CD34+ HSPCs were transferred into 96-well plates at 2000 cells/well in 200 mL of culture medium at day 3 of differentiation. On days 5, 7, and 9, 20 μL of CellTiter 96® Aqueous One Solution Reagent (Promega, #G358A) was added directly to the wells, and the plates were incubated for 2 h at 37°C, after which the absorbance at 490 nm was recorded with a 96-well plate reader. The quantity of formazan product, as measured by light absorbance at 490 nm, is directly proportional to the number of living cells in the culture.
Wright–Giemsa Staining
1.5–2.0 × 10⁵ cells were deposited on glass slides by centrifugation at 250 rpm for 5 min, using a Cytospin™ 4 cytocentrifuge (Thermo Scientific). The cells were stained for 3 min with May–Grünwald solution (Sigma, #MG1L-1L), rinsed in water for 5 s, stained in Giemsa solution (Sigma, #GS500, diluted 20×) for 10 min, rinsed twice in deionized water, and air dried. Cytoseal™ 60 mountant (Thermo Scientific, #8310-4) and a coverslip were applied before the slides were examined by microscopy.
Western blot analysis
Antibodies used for Western blot analysis are shown in Supplementary Table 6. Cells were rinsed with phosphate-buffered saline (PBS) then lysed in radioimmunoprecipitation assay (RIPA) buffer (Sigma-Aldrich, #R0278) supplemented with protease inhibitor cocktail (Roche). Cell lysates were mixed with 6X SDS Sample Buffer (Bioland Scientific, #SAB03-01) then fractionated by electrophoresis on a 4–12% gradient polyacrylamide gel (Thermo Fisher). Proteins were transferred to a nitrocellulose membrane, incubated in blocking buffer (Odyssey, #927-40000) for 1 h at room temperature, then incubated with primary antibody at 4°C overnight. The membranes were then washed in Tris-buffered saline with 0.1% Tween® 20 detergent (TBST) buffer, incubated with fluorescent secondary antibody for 1 h at room temperature, washed again, and analyzed using an Odyssey CLx Imaging System. Data were collected and processed by using Image Studio Software (version 5.2).
CUT&RUN assay
The CUT&RUN assay was performed to detect transcription factor occupancy and histone modification profiles27,59. Approximately 5 × 10⁵ cells were analyzed for each reaction. The antibodies used are listed in Supplementary Table 6. Library construction for DNA sequencing was performed using a NEBNext UltraII DNA Library Prep Kit from NEB (E7645S). Indexed samples were analyzed by paired-end NGS, using an Illumina NextSeq Mid-Output (150 cycles) Kit. FASTQ files were mapped to hg19 by using BWA-MEM (version 0.7.16a). Reads that could not be uniquely mapped to the human genome were removed by SAMtools (version 0.17). Peaks were called using MACS2 (version 2.1.1). BigWiggle files were generated using DeepTools (version 3.2.0). Footprint analysis was performed by using CUT&RUNTools59. Data were normalized using S3norm (version 2) 60.
Base editing in HUDEP-2 VHL−/− clones
VHL−/− HUDEP-2 clones grown in culture in expansion medium were transduced with a lentiviral vector encoding a blasticidin resistance cassette and the base editor ABE8-NG. After 24 h, blasticidin was added for 4 days. Cells were then transduced with lentiGuide-Puro encoding individual sgRNAs targeting HIF-binding hypoxia-response element (HRE) motif A or B at the BGLT3 locus or with nontargeting sgRNA (Supplementary Table 7a). For multiplex editing of both motifs, cells were transfected simultaneously with lentiGuide-Puro and lentiGuide-zeo vectors (Addgene, plasmid #160091) 61, each encoding a separate sgRNA. Twenty-four hours later, 1 μg/mL puromycin and 10 μg/mL zeocin (Thermo Fisher, #R25001) were added and cells were selected in drug for 4 days in expansion medium. After 3 additional days in expansion medium, RNA isolation and CUT&RUN were performed. The CUT&RUN peaks were normalized using S3Norm60. Base editor editing efficiency was measured at day 7 by NGS of PCR products generated around the target site (Supplementary Table 7b), followed by analysis using CRIS.py (version 1) 53 or CRISPResso2 (version 2.2.7) 62. To analyze cell clones with mutant HRE motifs, VHL−/− HUDEP-2 cells (clone 2) were electroporated with RNP containing ABE8-NG protein + sgRNA-A and/or sgRNA-B or nontargeting sgRNA. The same cells were electroporated separately with RNP consisting of Cas9 + HIF1A sgRNA1 or sgRNA2. Two days after electroporation, single cells were sorted into 96-well tissue culture plates containing HUDEP-2 maintenance culture medium. Single clones were expanded, and six homozygous clones of each genotype were isolated and analyzed for %γ-globin mRNA. Control (Ctrl) clones from NT sgRNA-treated cells, three HIF1A sgRNA1–targeted clones, and three HIF1A sgRNA2–targeted clones labeled as HIF1A−/− clones were generated at the same time.
Red blood cell sickling assay
Erythroid cells generated from in vitro differentiation of CD34+ HSPCs from a patient with SCD were incubated with Hoechst 33342 stain (Sigma #B2261, 1:4000 dilution) for 20 min at 37°C. The enucleate Hoechst-negative cell population was isolated by flow cytometry using an SH800 Cell Sorter (Sony Biotechnologies). Aliquots of 1.0 × 10⁵ cells were seeded into individual wells in 96-well white-wall plates with 200 μL of phase 3 erythroid differentiation medium then incubated in 2% oxygen for 12 h. An IncuCyte S3 Live-Cell Analysis System (Sartorius) with a 20× objective was used to monitor cell sickling after 8 h. The percentage of sickling was measured by manual counting of cell images.
Capture-C analysis
Capture-C was performed using NlaIII restriction enzyme digestion35. Biotin-labeled DNA probes are described in Supplementary Table 7a. The NGS reads were processed and mapped to the Human Genome Assembly hg19, using published scripts dpngenome3_1.pl, dpnII2E.pl, and CCanalyser2.pl35,63. Capture-C interactions of biological replicates were normalized to total interactions.
ATAC-seq
ATAC-seq was performed using the Omni-ATAC protocol64. For each sample, 5 × 10⁴ to 6 × 10⁴ cells were lysed with buffer containing 0.1% NP-40, 0.1% Tween-20, and 0.01% digitonin, then the lysate was washed and incubated with Tagment DNA TDE1 Enzyme (Illumina) for 30 min at 37°C. DNA was purified with a Qiagen MinElute PCR Purification Kit. Library fragments were amplified using NEBNext® High-Fidelity 2X PCR Master Mix (NEB, M0541) and custom primers (Supplementary Table 7b) with unique dual indexes. PCR amplification cycles were in accordance with the manufacturer’s instructions. PCR products were purified using AMPure XP beads (Beckman Coulter, A63881) at a 1:1 ratio according to the manufacturer’s instructions. Purified PCR products sized from 150 bp to 1 kb were purified from 2% E-Gel EX agarose gels (Thermo Fisher, G401002). Libraries were pooled and sequenced in paired-end mode by using an Illumina HiSeq kit. Raw reads were trimmed to remove the Tn5 adaptor sequence by using skewer (version 0.2.2) then mapped to hg19 by using BWA-MEM (version 0.7.16a). Duplicated multi-mapped reads were removed with SAMtools (version 0.17). ATAC-seq peaks were called using MACS2 (version 2.1.1) with the following parameters: macs2 callpeak –nomodel –shift –100 –extsize 200. BigWiggle files were generated using DeepTools (version 3.2.0).
Extended Data
Extended Data Figure 1. Disruption of the VHL gene induces fetal hemoglobin (HbF).
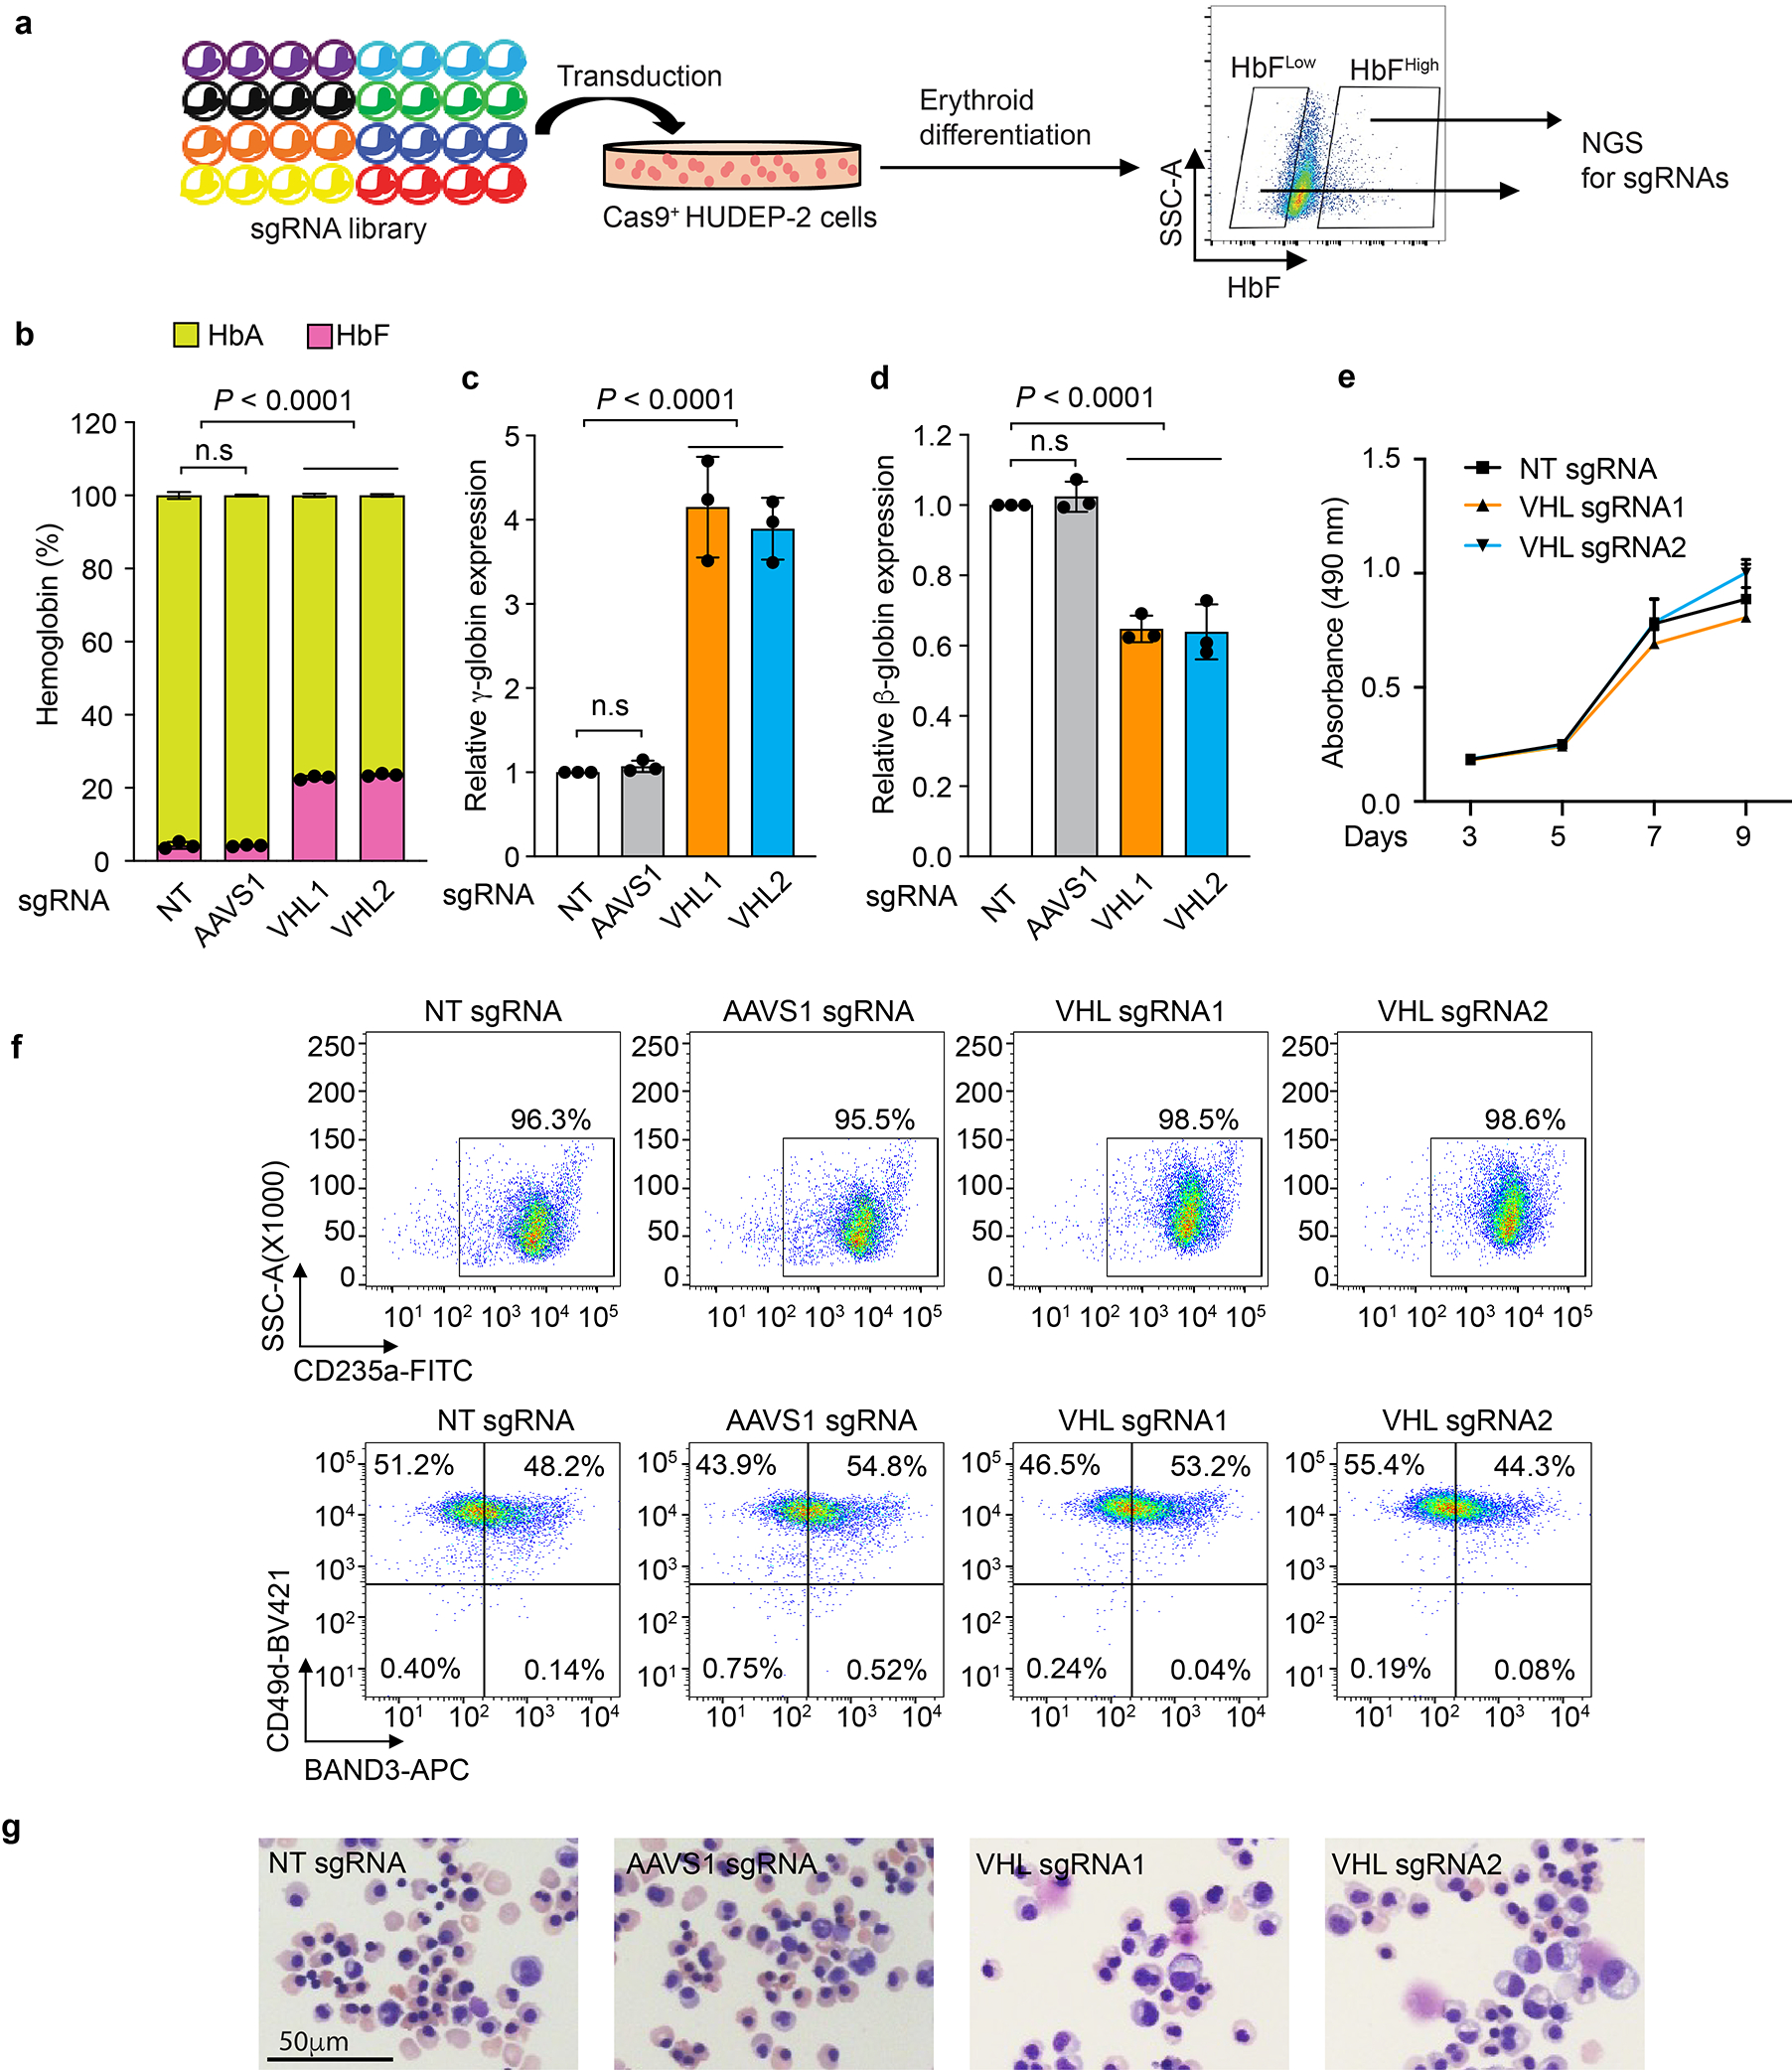
(linked to main Figure 1). a, Experimental workflow for a CRISPR/Cas9 sgRNA screen to identify regulators of HbF expression. b–g, Normal adult donor CD34+ hematopoietic stem and progenitor cells (HSPCs) were transfected with ribonucleoprotein (RNP) consisting of Cas9 + VHL, AAVS1, or nontargeting (NT) single-guide RNAs (sgRNAs), after which erythroid differentiation was induced (see also main Figure 1d–f). b, The %HbF (α2γ2) and %HbA (α2β2) relative to total hemoglobin, determined by high-performance liquid chromatography (HPLC) at day 15 of erythroid differentiation. c, Results of real-time quantitative PCR (RT-qPCR) analysis, showing relative levels of γ-globin normalized to α-globin mRNA. d, RT-qPCR analysis showing relative levels of β-globin expression normalized to α-globin mRNA. e, Cell expansion as determined by CellTiter 96® Aqueous One, a colorimetric method for estimating the relative numbers of viable cells. f, Representative results of flow cytometry analysis for erythroid maturation markers CD235a, CD49d, and Band3 at day 15 of erythroid differentiation. g, Wright–Giemsa–stained erythroblasts at day 15. Representative pictures are shown here, experiments were repeated independently 3 times with similar results. The bar charts and graphs in panels b – d show the mean ± s.d., n = 3 biological independent experiments. Multiplicity-adjusted P-values by ordinary one-way ANOVA with Dunnett’s MCT against NT.
Extended Data Figure 2. Disruption of TCEB1 or CUL2 induces γ-globin and HbF expression.
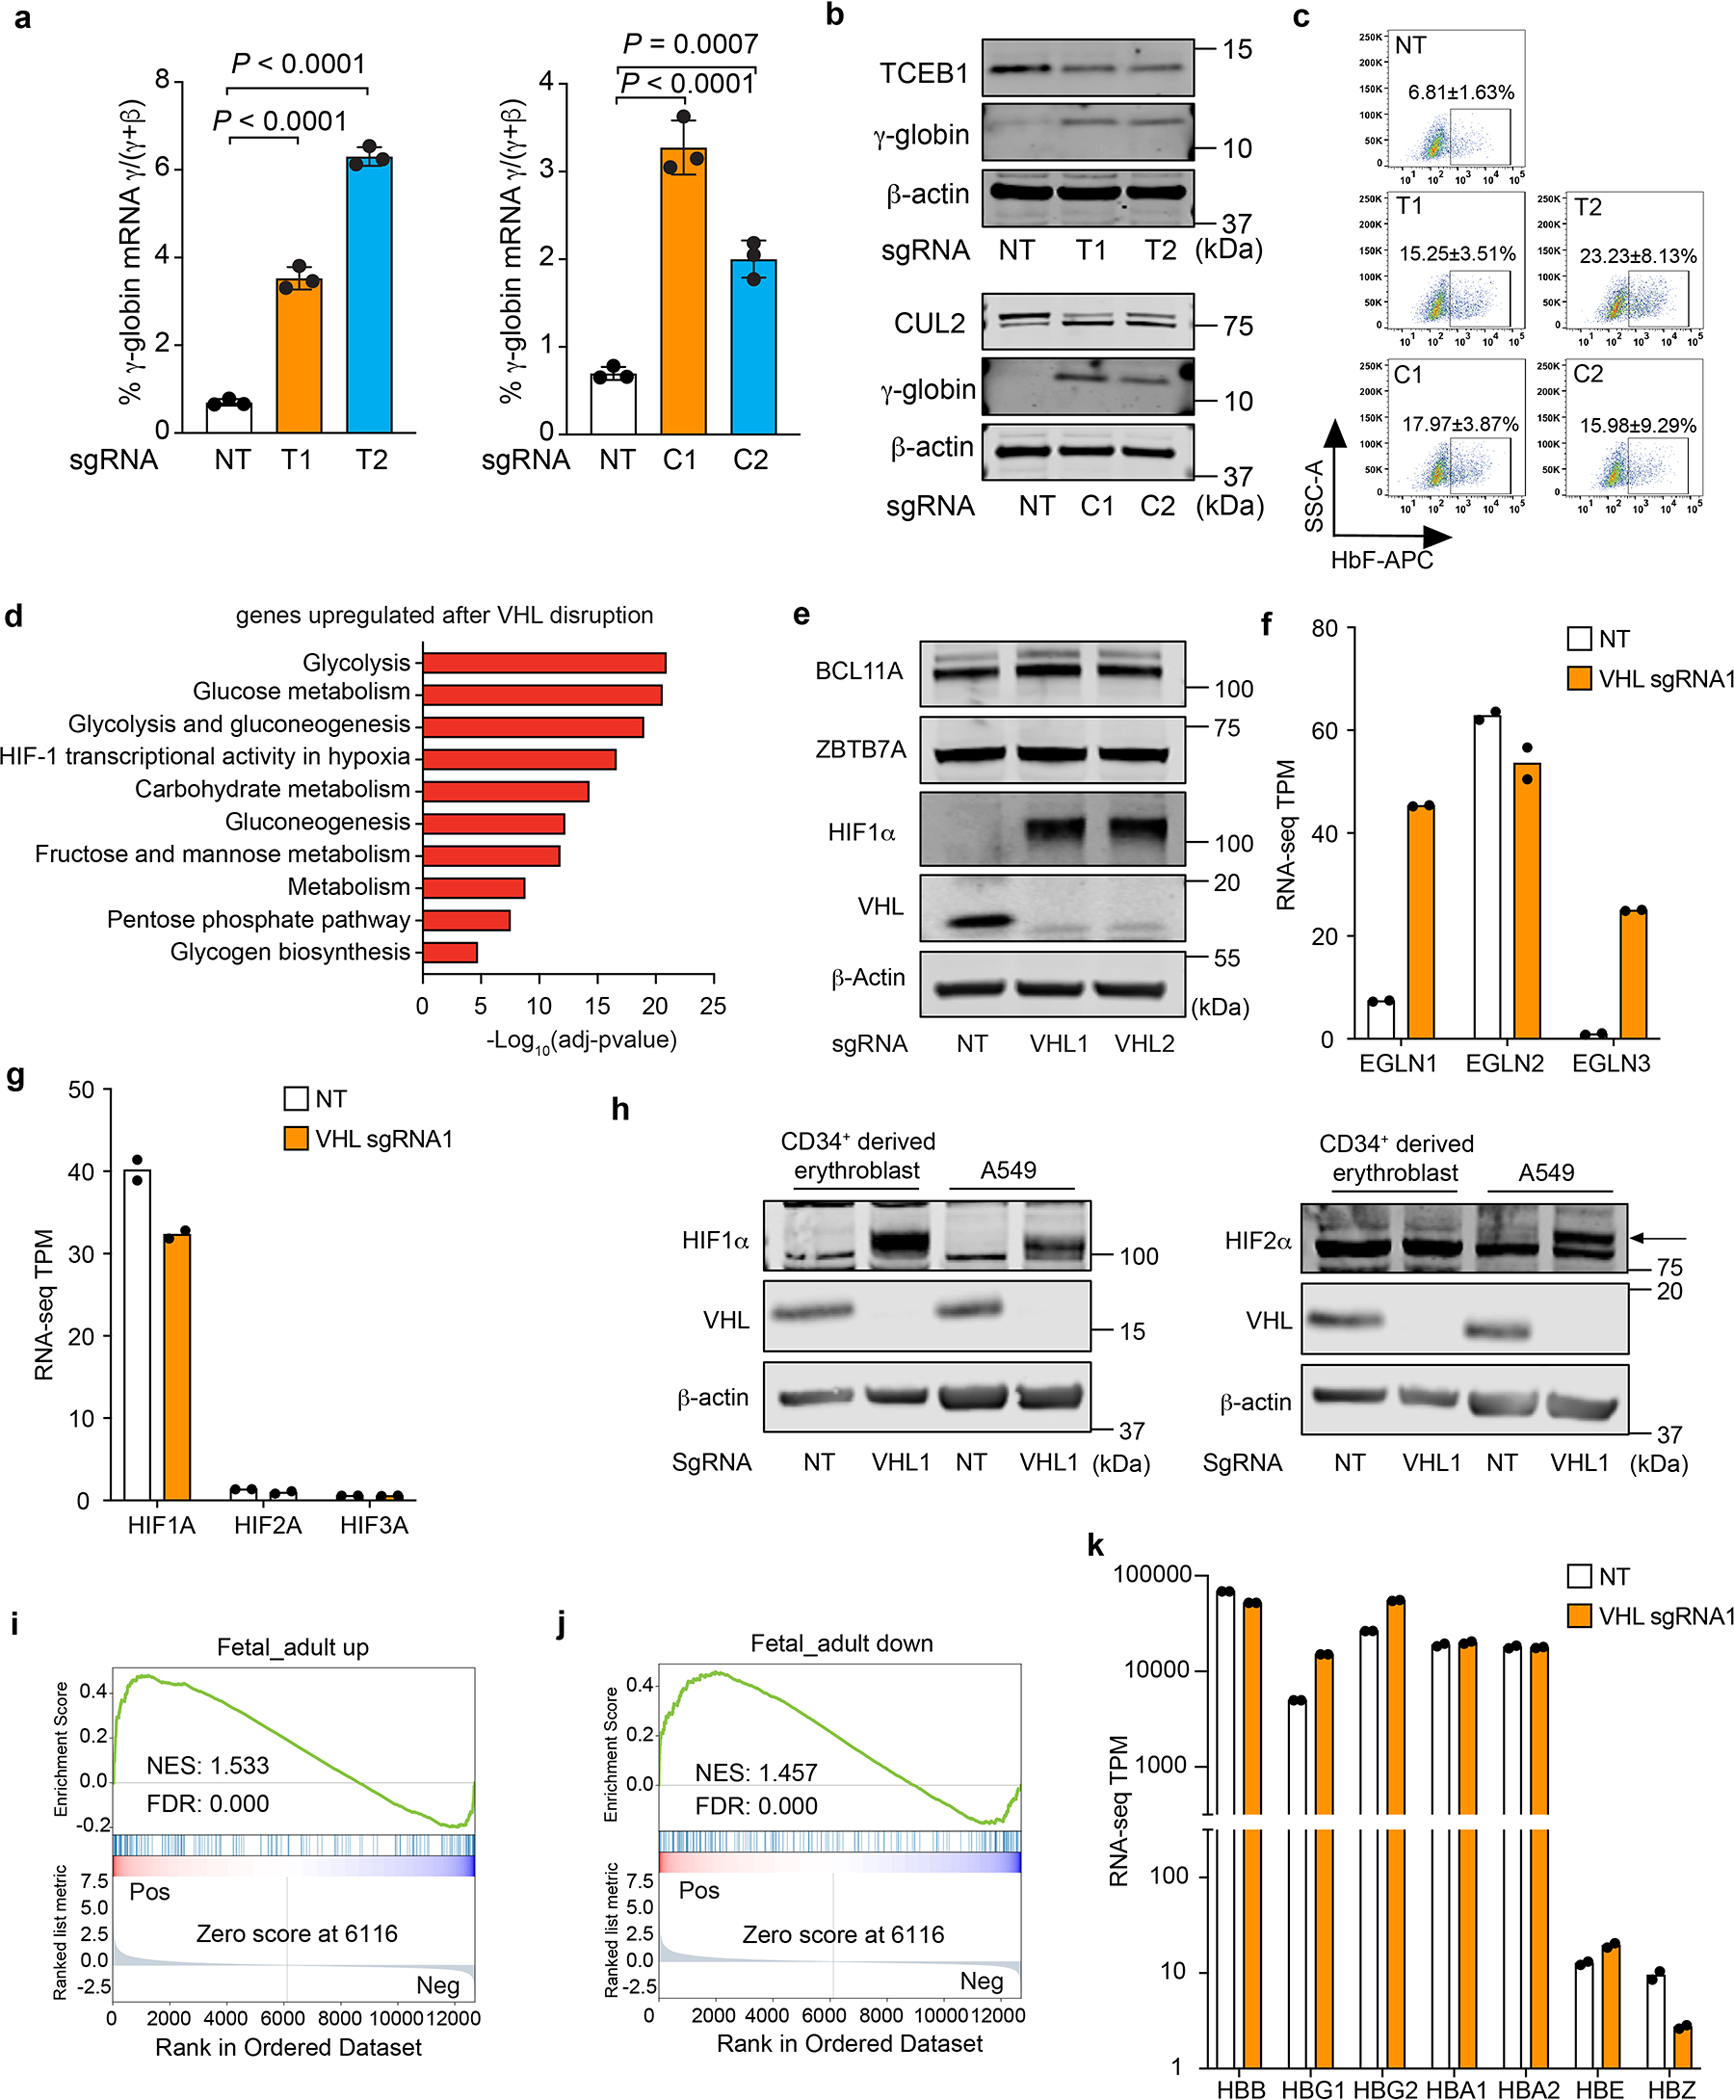
(linked to main Figure 1). Cas9-expressing HUDEP-2 cells were transduced with lentiviral vectors encoding sgRNAs targeting the genes encoding elongin B (TCEB1, T) or cullin 2 (CUL2, C), after which erythroid differentiation was induced for 5 days. a, The %γ-globin mRNA. The bar charts show the mean ± s.d. from 3 independent experiments. Multiplicity-adjusted P-values by ordinary one-way ANOVA with Dunnett’s MCT against NT. b, Western blot analysis. c, Representative flow cytometry plots showing %F-cells. The mean ± s.d. from 3 independent experiments are shown. d, Gene ontology (GO) analysis of mRNAs that were induced in erythroblasts derived from VHL-disrupted versus control CD34+ HSPCs (false-discovery rated–adjusted P-value < 0.05, log2 fold-change > 1). e, Western blot analysis of day 10 erythroblasts generated from CD34+ HSPCs treated with Cas9 + VHL or NT sgRNAs. f, Relative expression of prolyl hydroxylase domain (PHD) enzyme-encoding mRNAs shown as transcripts per kilobase million (TPM) in day 10 erythroblasts described in panel e. g, Relative expression (in TPM) of GATA1, BCL11A, HIF1A, and HIF2A mRNAs in day 10 erythroblasts described in panel e. h, Western blot analysis of VHL, HIF1a, and HIF2a proteins in day 10 erythroblasts described in panel e and in A549 adenocarcinoma cells treated with Cas9 + VHL or NT sgRNAs. The arrow indicates the HIF2α signal. i, j, Gene set enrichment analysis (GSEA) of mRNAs that are altered in erythroblasts generated from VHL-disrupted (sgRNA1) vs. control (NT sgRNA) CD34+ cells. Fetal-enriched and adult-enriched erythroid gene sets were derived from the work of Huang et al35. NES, normalized enrichment score. k, Relative expression (in TPM) of globin mRNAs in day 10 erythroblasts described in panel e. Bar charts show average data value from two biological replicates, dots represent individual values in f, g, k.
Extended Data Figure 3. The VHL E3 ubiquitin ligase complex suppresses γ-globin expression by targeting HIF1α for degradation.
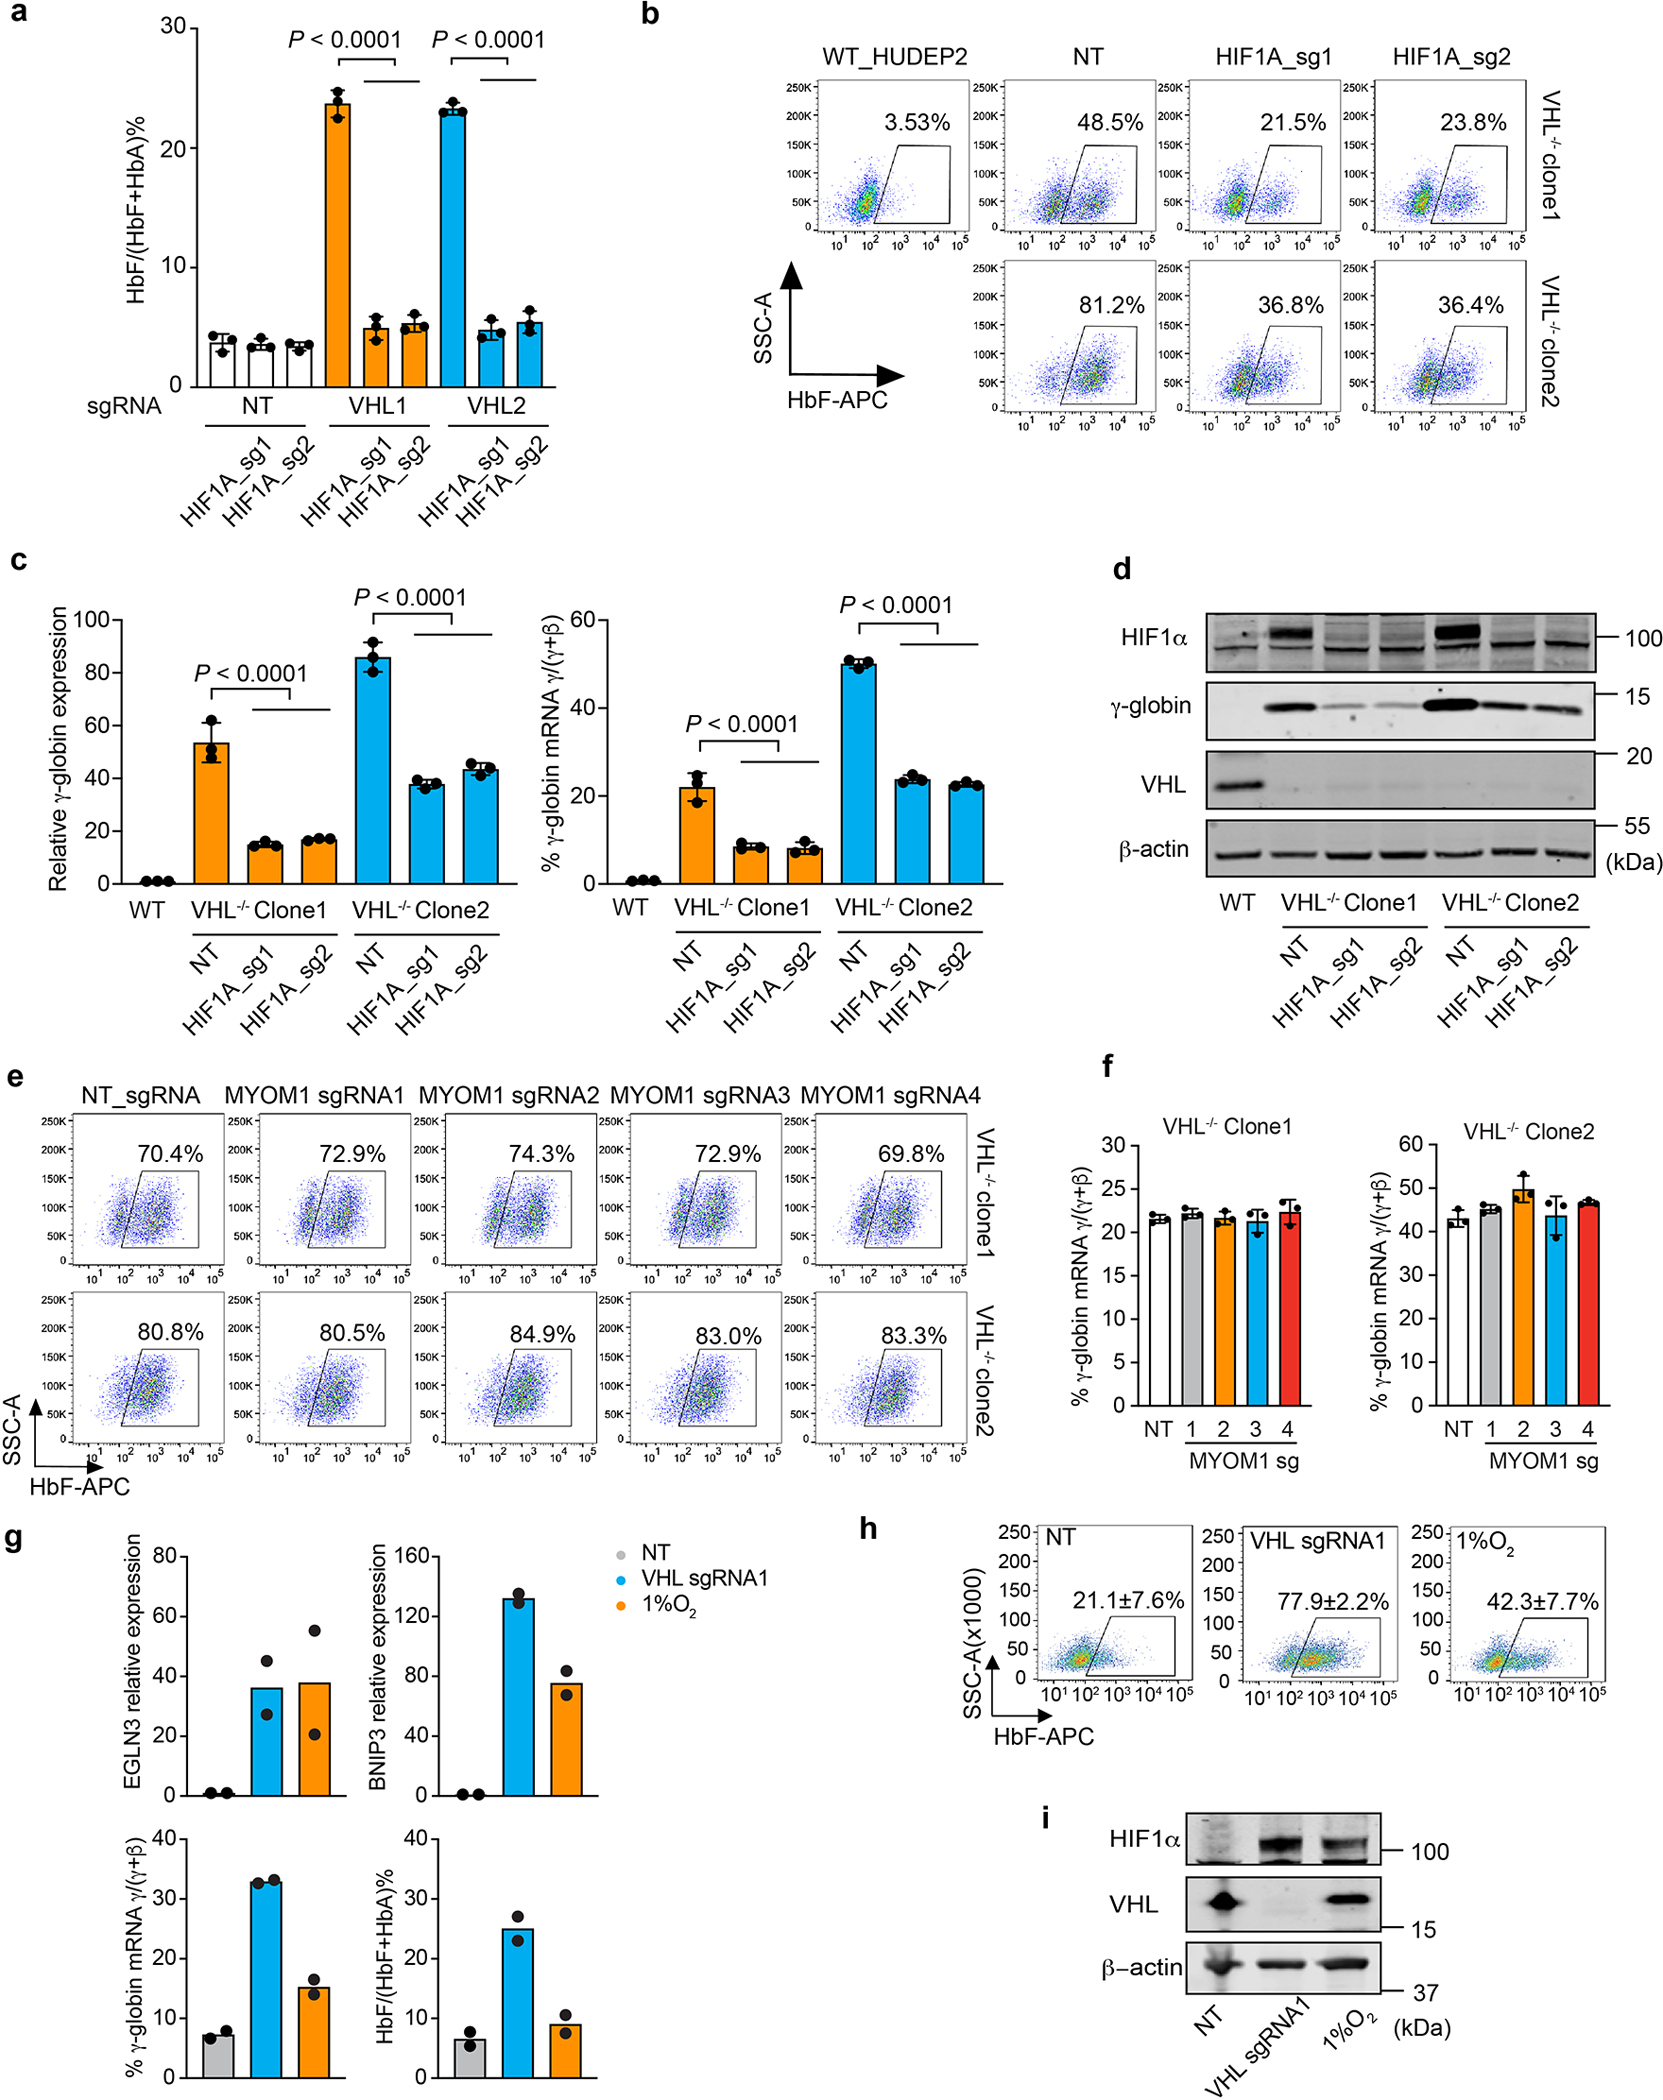
(linked to main Figure 1). a, CD34+ HSPCs were co-transfected with RNPs targeting VHL and HIF1A. %HbF measured by HPLC at day 15. (Data are presented as mean ± s.d., n=3 independent experiments with different donor CD34+ cells). Multiplicity-adjusted P-values by one-way ANOVA with Dunnett’s MCT against control. b–d, VHL−/− HUDEP-2 clones 1 and 2 were electroporated with HIF1A sgRNA1 or sgRNA2, grown in maintenance medium, and analyzed after 5 days. b, Representative flow-cytometry plots showing %F-cells. Experiments were repeated independently 3 times with similar results. c, γ-Globin mRNA levels (left) and %γ-globin mRNA relative to γ-globin + β-globin mRNA (right). Data are presented as mean ± s.d., n=3 independent experiments. Multiplicity-adjusted P-values by one-way ANOVA with Dunnett’s MCT against NT. d, Western blot analysis of the indicated proteins. e, Cas9-expressing VHL−/− HUDEP-2 cell clones 1 and 2 were transduced with lentiviral vectors encoding MYOM1 or NT sgRNAs, grown in maintenance medium for 7 days, then analyzed for F-cells. Indel frequencies for sgRNAs ranged from 62% to 94% (Supplementary Table 4b). MYOM1 protein was not detected in Western blots of control HUDEP-2 cells (not shown). Representative flow-cytometry plots for F-cells are shown. Experiments were repeated independently 3 times with similar results. f, %γ-globin mRNA in the cells in e. Bar charts show the mean ± s.d. from three biological replicates. g–i, CD34+ HSPCs were electroporated with RNP containing VHL sgRNA1 or NT sgRNA, then erythroid differentiation was induced. In parallel, the same untreated CD34+ HSPCs were induced to undergo erythroid differentiation in 1% O2. g, At day 13, mRNAs encoded by HIF target genes EGLN3 and BNIP3 were measured by RT-qPCR and normalized to AHSP (ERAF) mRNA. Globin mRNAs and hemoglobin proteins were measured by RT-PCR and IE-HPLC, respectively. Bar charts show average data value from two biological replicates, dots represent individual values. h, %F-cells in day 15 erythroblasts in g. mean ± s.d. are shown for two biological replicates using CD34+ cells from different donors. i, Western blot analysis of day 10 erythroblasts.
Extended Data Figure 4. HIF1α binds the BGLT3 gene in the β-like globin gene cluster.
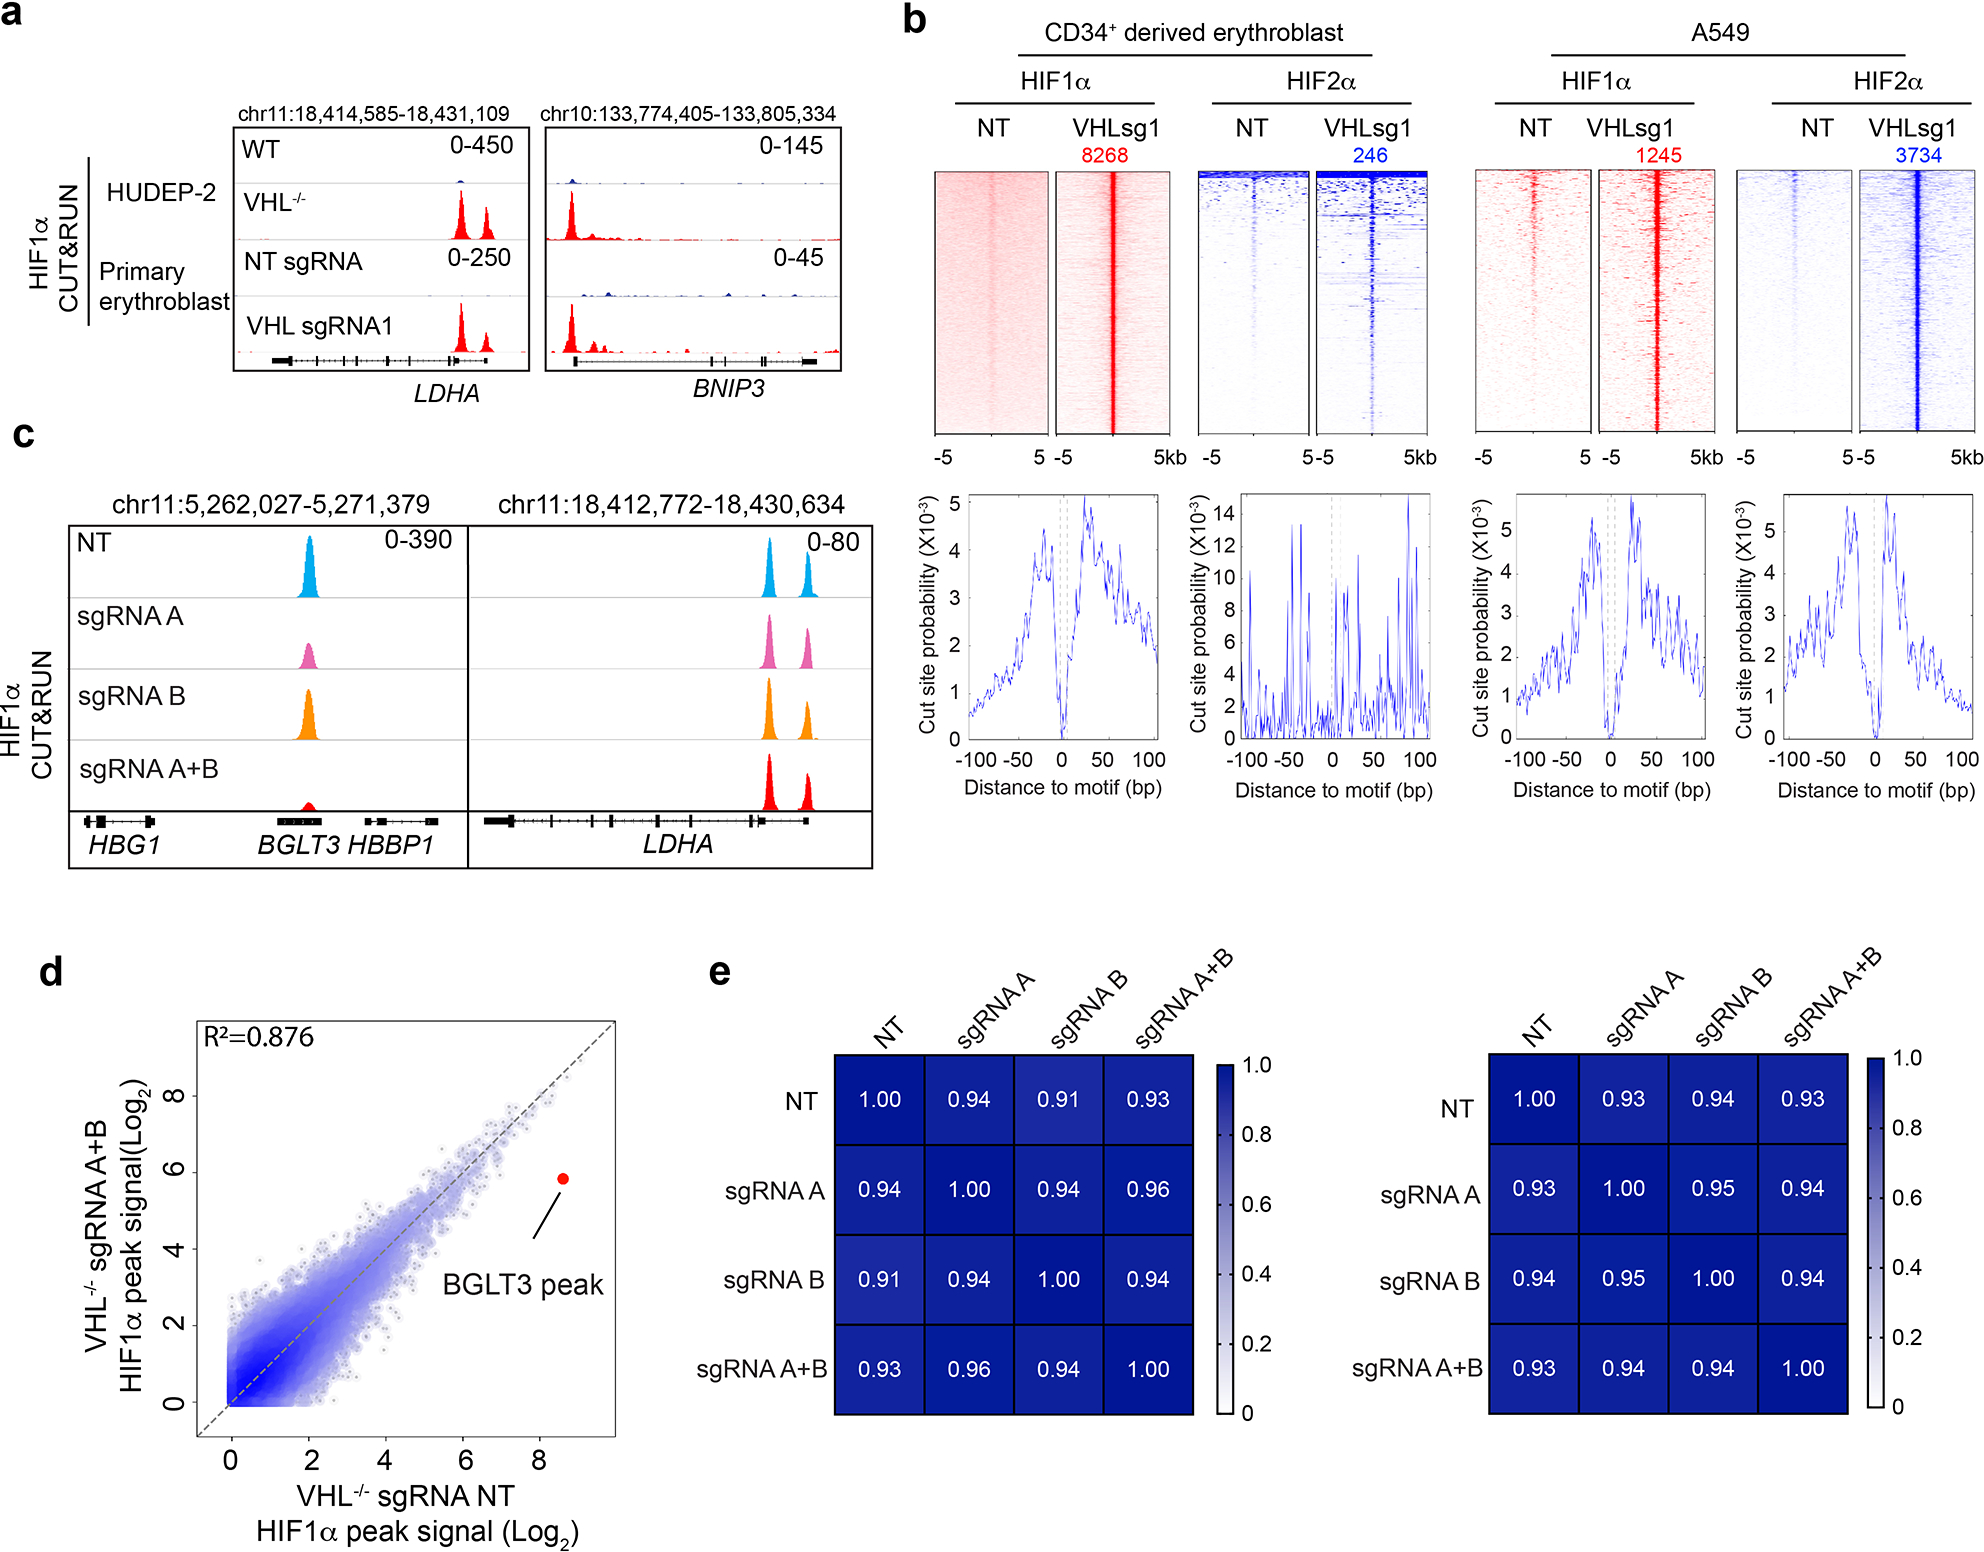
(linked to main Figure 2). a, HIF1α CUT&RUN analysis of VHL−/− HUDEP-2 cells (clone 1) and primary erythroblasts generated from VHL-depleted CD34+ cells. The tracks show HIF1α occupancy at its known target genes LDHA and BNIP3. b, The top panels show heatmaps of high-confidence genome-wide CUT&RUN peaks for HIF1α and HIF2α occupancy in primary erythroblasts generated by in vitro differentiation of CD34+ HSPCs that were transfected with RNPs consisting of Cas9 + VHL sgRNA1 or NT sgRNA and in A549 adenocarcinoma cells transfected with the same RNPs. The lower panels show genome-wide targeted-motif footprint analysis of CUT&RUN peaks indicating the cut probability of each base surrounding or within HIF-binding hypoxia response elements (HRE; ACGTG). c, CUT&RUN analysis of HIF1α occupancy at BGLT3 (left panels) or LDHA (right panels) in VHL−/− HUDEP-2 cells (clone 2) with adenine base editor–induced mutations in BGLT3 HRE motifs A and/or B. d, Genome-wide CUT&RUN analysis of HIF1α in bulk VHL−/− HUDEP-2 cells (clone 2) edited with NT sgRNA (x-axis) or sgRNAs targeting BGLT3 motifs A and B (y-axis). Each dot represents an individual high-confidence HIF1α peak. The BGLT3 HIF1α occupancy peak is indicated by the red dot. e, Heat maps showing Pearson correlation coefficients of genome-wide, normalized HIF1α CUT&RUN peak patterns in VHL−/− HUDEP-2 cell clones 1 (left) and 2 (right) ± mutations in BGLT3 HIF-binding motifs A and/or B, as described in main Figure 2h and I, and in panels c and d of this figure.
Extended Data Figure 5. Sequence alignment of BGLT3 HIF-binding HRE motifs in the β-like globin gene cluster of humans and non-human primates (linked to main Figure 2).
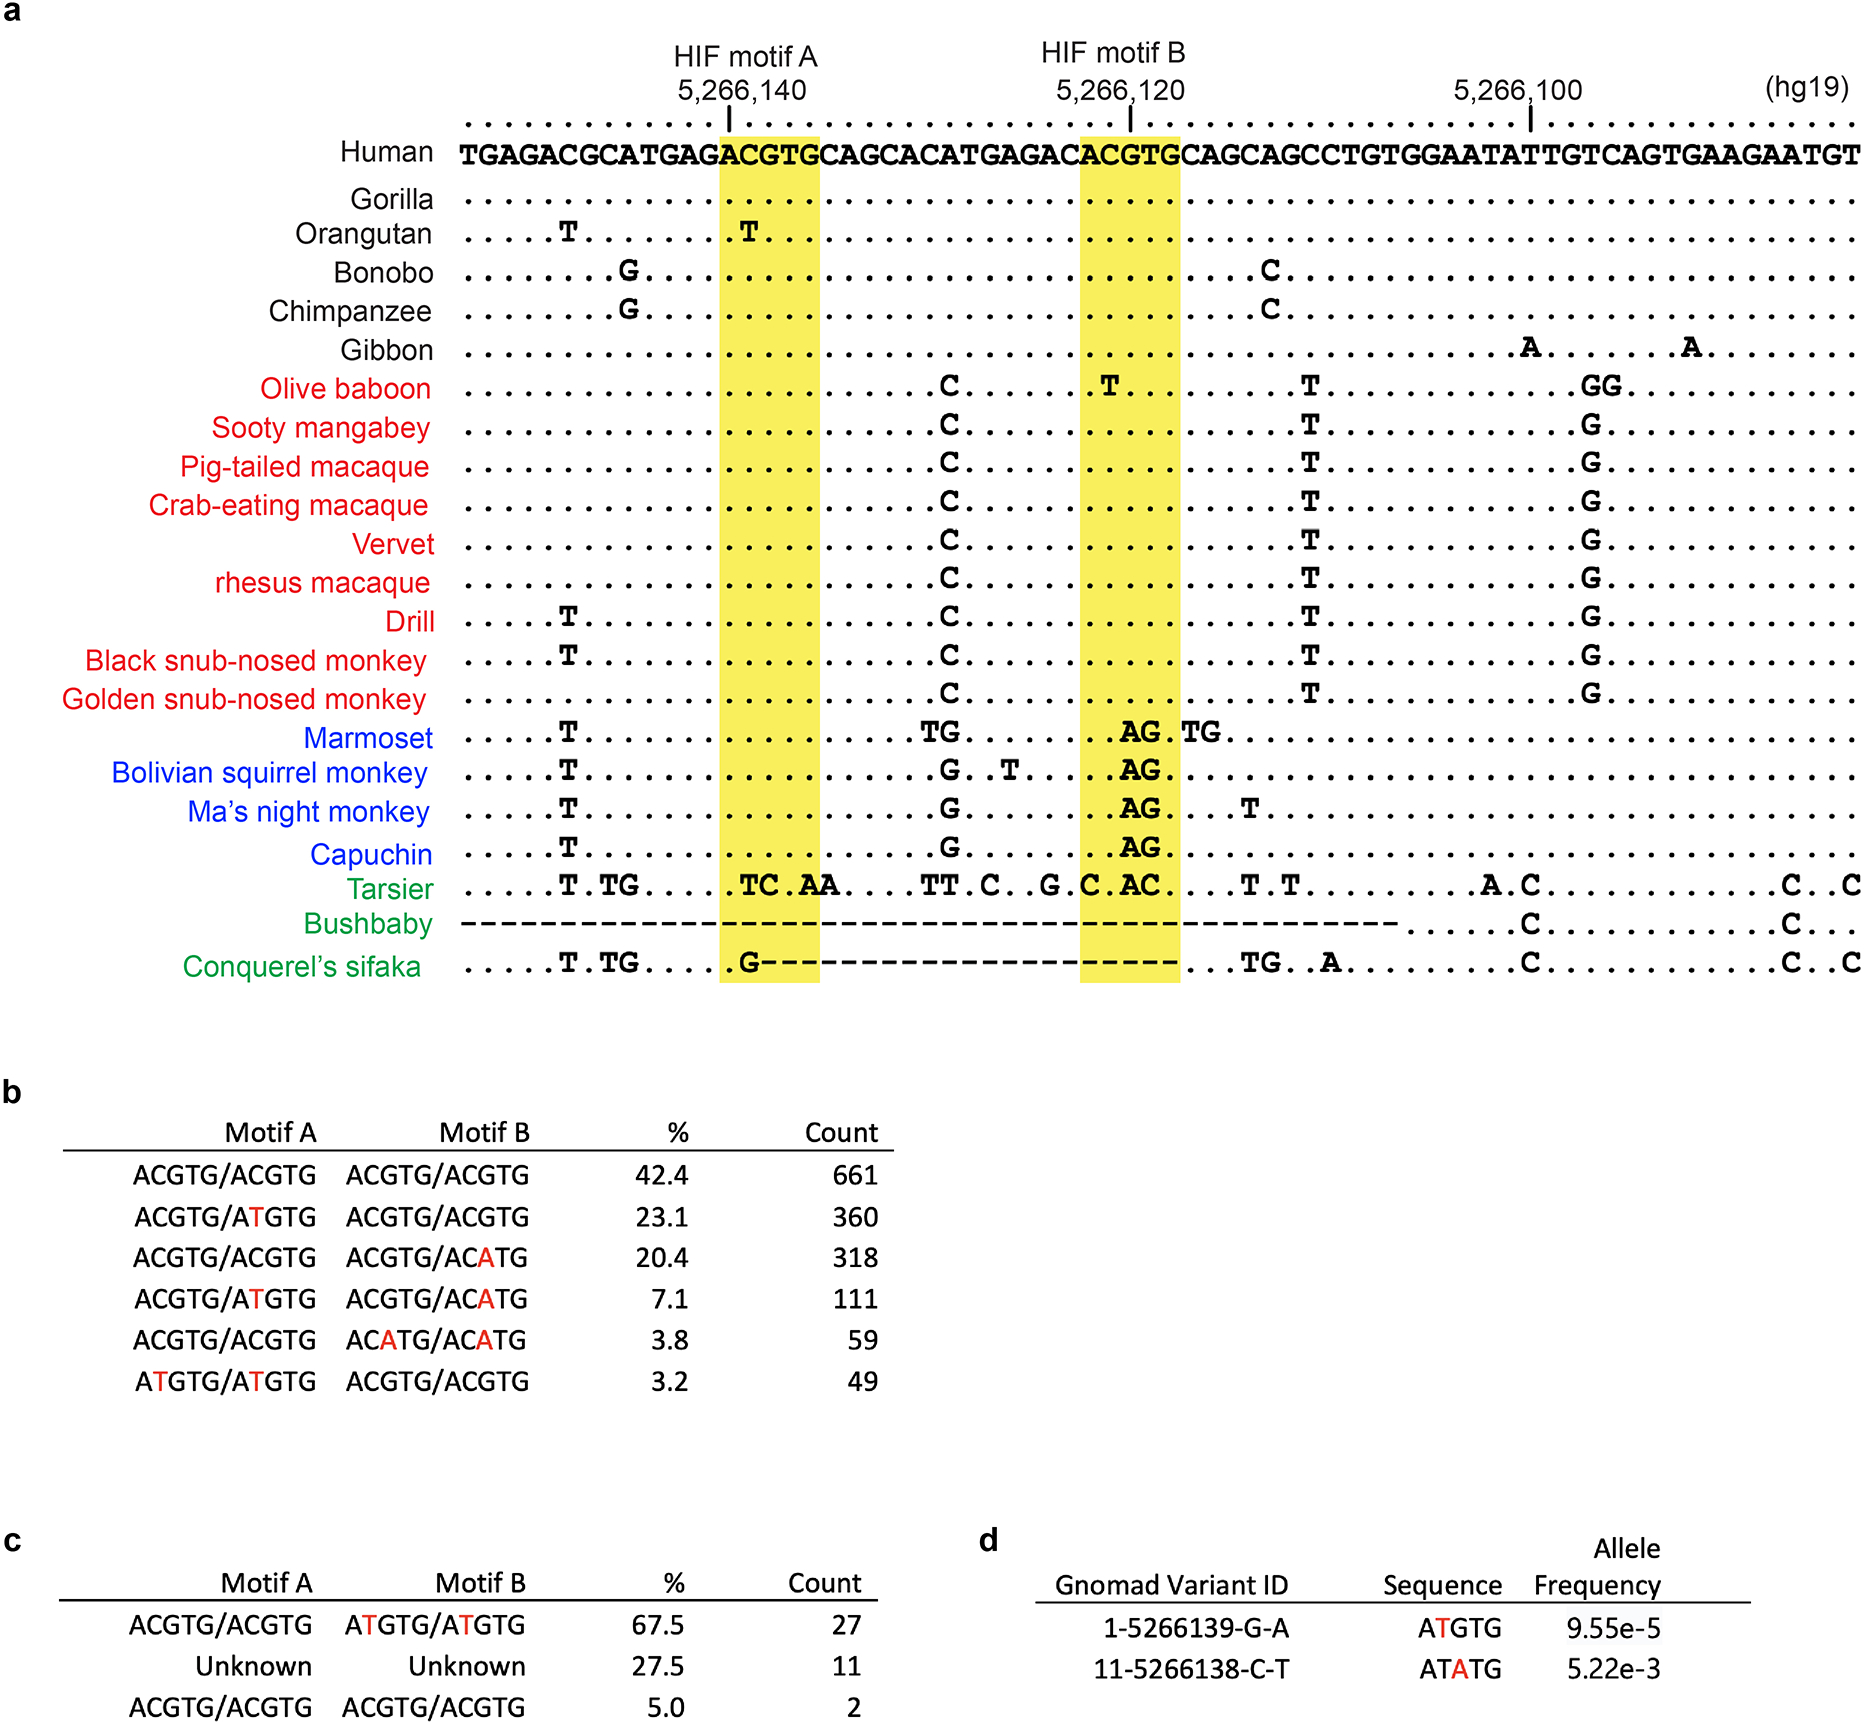
a, A sequence from the human BGLT3 gene containing two HIF-binding motifs was used as a BLASTN query against primate genome assemblies from ENSEMBL (https://www.ensembl.org). Identities are shown as dots and gaps as dashes; mismatched bases are indicated. The yellow highlighted columns indicate HIF-binding HRE motifs A and B. Species are color coded as follows: apes in black; Old World monkeys in red; New World monkeys in blue; and non-simian primates in green. b, Rhesus macaque genotype combinations determined from the rhesus macaque mGap database (https://mgap.ohsu.edu/). A total of 1158 animals with complete base calls were included. c, Baboon genotype counts (n = 40) determined from the Baboon Genome Project (https://www.hgsc.bcm.edu/non-human-primates/baboon-genome-project). d, Rare variants in human BGLT3 HRE motif A identified in the gnomAD database (https://gnomad.broadinstitute.org/).
Extended Data Figure 6. HIF1-induced transcription factor recruitment and epigenetic changes at BGLT3.
(linked to main Figure 3). a, Normal adult donor CD34+ cells were transfected with RNPs containing Cas9 + VHL-targeting sgRNA2 or NT sgRNA, maintained in culture with erythroid cytokines, and analyzed after 11 days. The Genome Browser screenshot shows transcription factor occupancy and histone modifications determined by CUT&RUN analysis and open chromatin regions identified by ATAC-seq. b, Zoom-in on ATAC-seq and CUT&RUN analyses of the LCR in VHL-disrupted erythroblasts generated from CD34+ cells. Data show the average signals from two biological replicate experiments performed using VHL sgRNA1 (main Figure 3a) or sgRNA2 (panel a of this figure). Note that the scale of the low-magnitude HIF1α peaks are expanded relative to that in panel a. Arrows and dashed lines indicate the positions of forward and reverse HRE motifs in the region. c, CD34+ HSPCs were co-transfected with RNPs targeting VHL and HIF1A, after which erythroid differentiation was induced. The bar chart shows BGLT3 mRNA expression normalized to α-globin mRNA as determined by RT-qPCR analysis at 13 days. Data are presented as mean ± s.d., n=3 independent experiments with different donor CD34+ cells. Multiplicity-adjusted P-values by ordinary one-way ANOVA with Šídák’s MCT between selected groups. d, CUT&RUN and ATAC-seq analysis of WT HUDEP-2 cells and VHL−/− clones 1 and 2.
Extended Data Figure 7. Capture C and CUT&RUN analysis of VHL-disrupted erythroblasts.
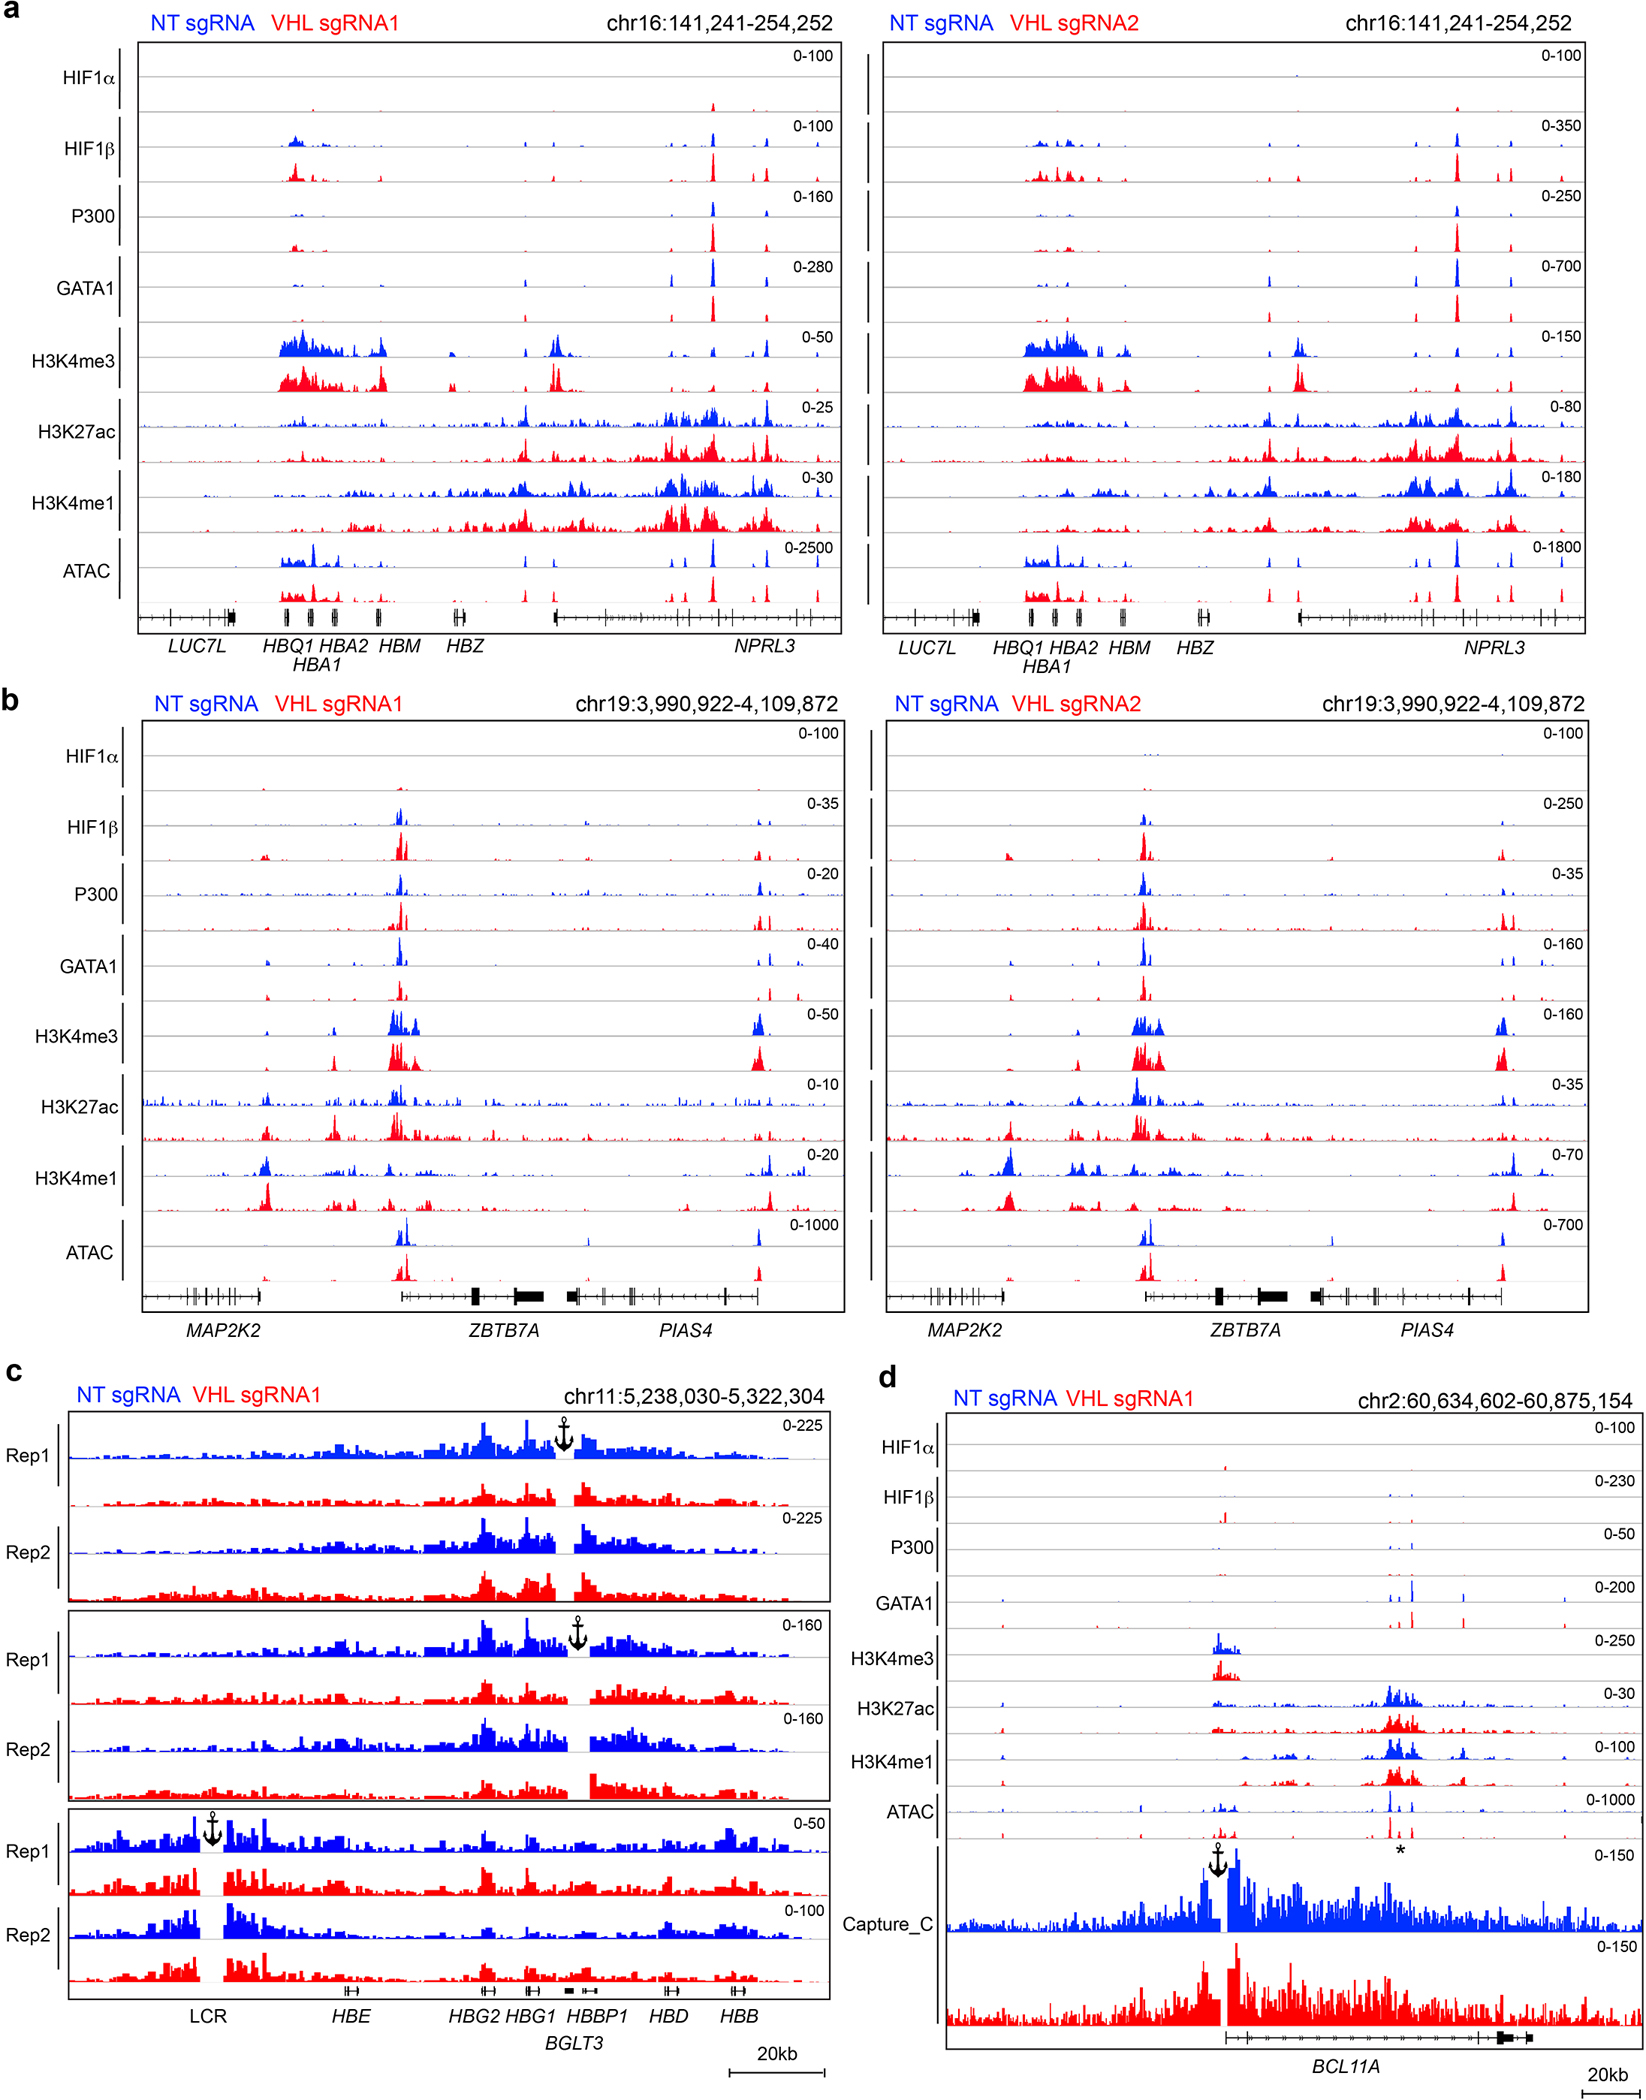
(linked to main Figure 3). Normal adult donor CD34+ cells were transfected with RNP containing Cas9 + VHL sgRNAs or NT sgRNA, after which erythroid differentiation was induced. a, CUT&RUN and ATAC-seq analysis of the extended α-like globin locus in day 11 erythroblasts. Biological replicate experiments were performed using VHL sgRNAs 1 and 2. A weak VHL-independent HIF1β signal with no underlying HRE motif is present in NPRL3, which harbors a multicomponent α-globin enhancer. Most likely, this signal represents nonspecific micrococcal nuclease digestion associated with open chromatin. b, Analysis of the ZBTB7A locus, as described for panel a. The low-magnitude VHL-independent HIF1β signal with no underlying HRE motif in the promoter region most likely represents nonspecific micrococcal nuclease digestion associated with open chromatin. c, Capture-C analysis to identify chromatin looping, performed at day 11 of erythroid differentiation. Tracks show data from two biological replicate experiments using CD34+ HSPCs from different donors. Anchors are indicated at the BGLT3, HBBP1, and HS3 regions. Main Figure 3b shows combined data from these experiments. d, CUT&RUN analysis and Capture C analysis of the BCL11A locus with an anchor at the promoter. The intron 2 erythroid-specific enhancer is indicated with an asterisk.
Extended Data Figure 8. The proline hydroxylase inhibitor (PHI) FG4592 induces γ-globin and HbF in primary erythroblasts (linked to main Figure 4).
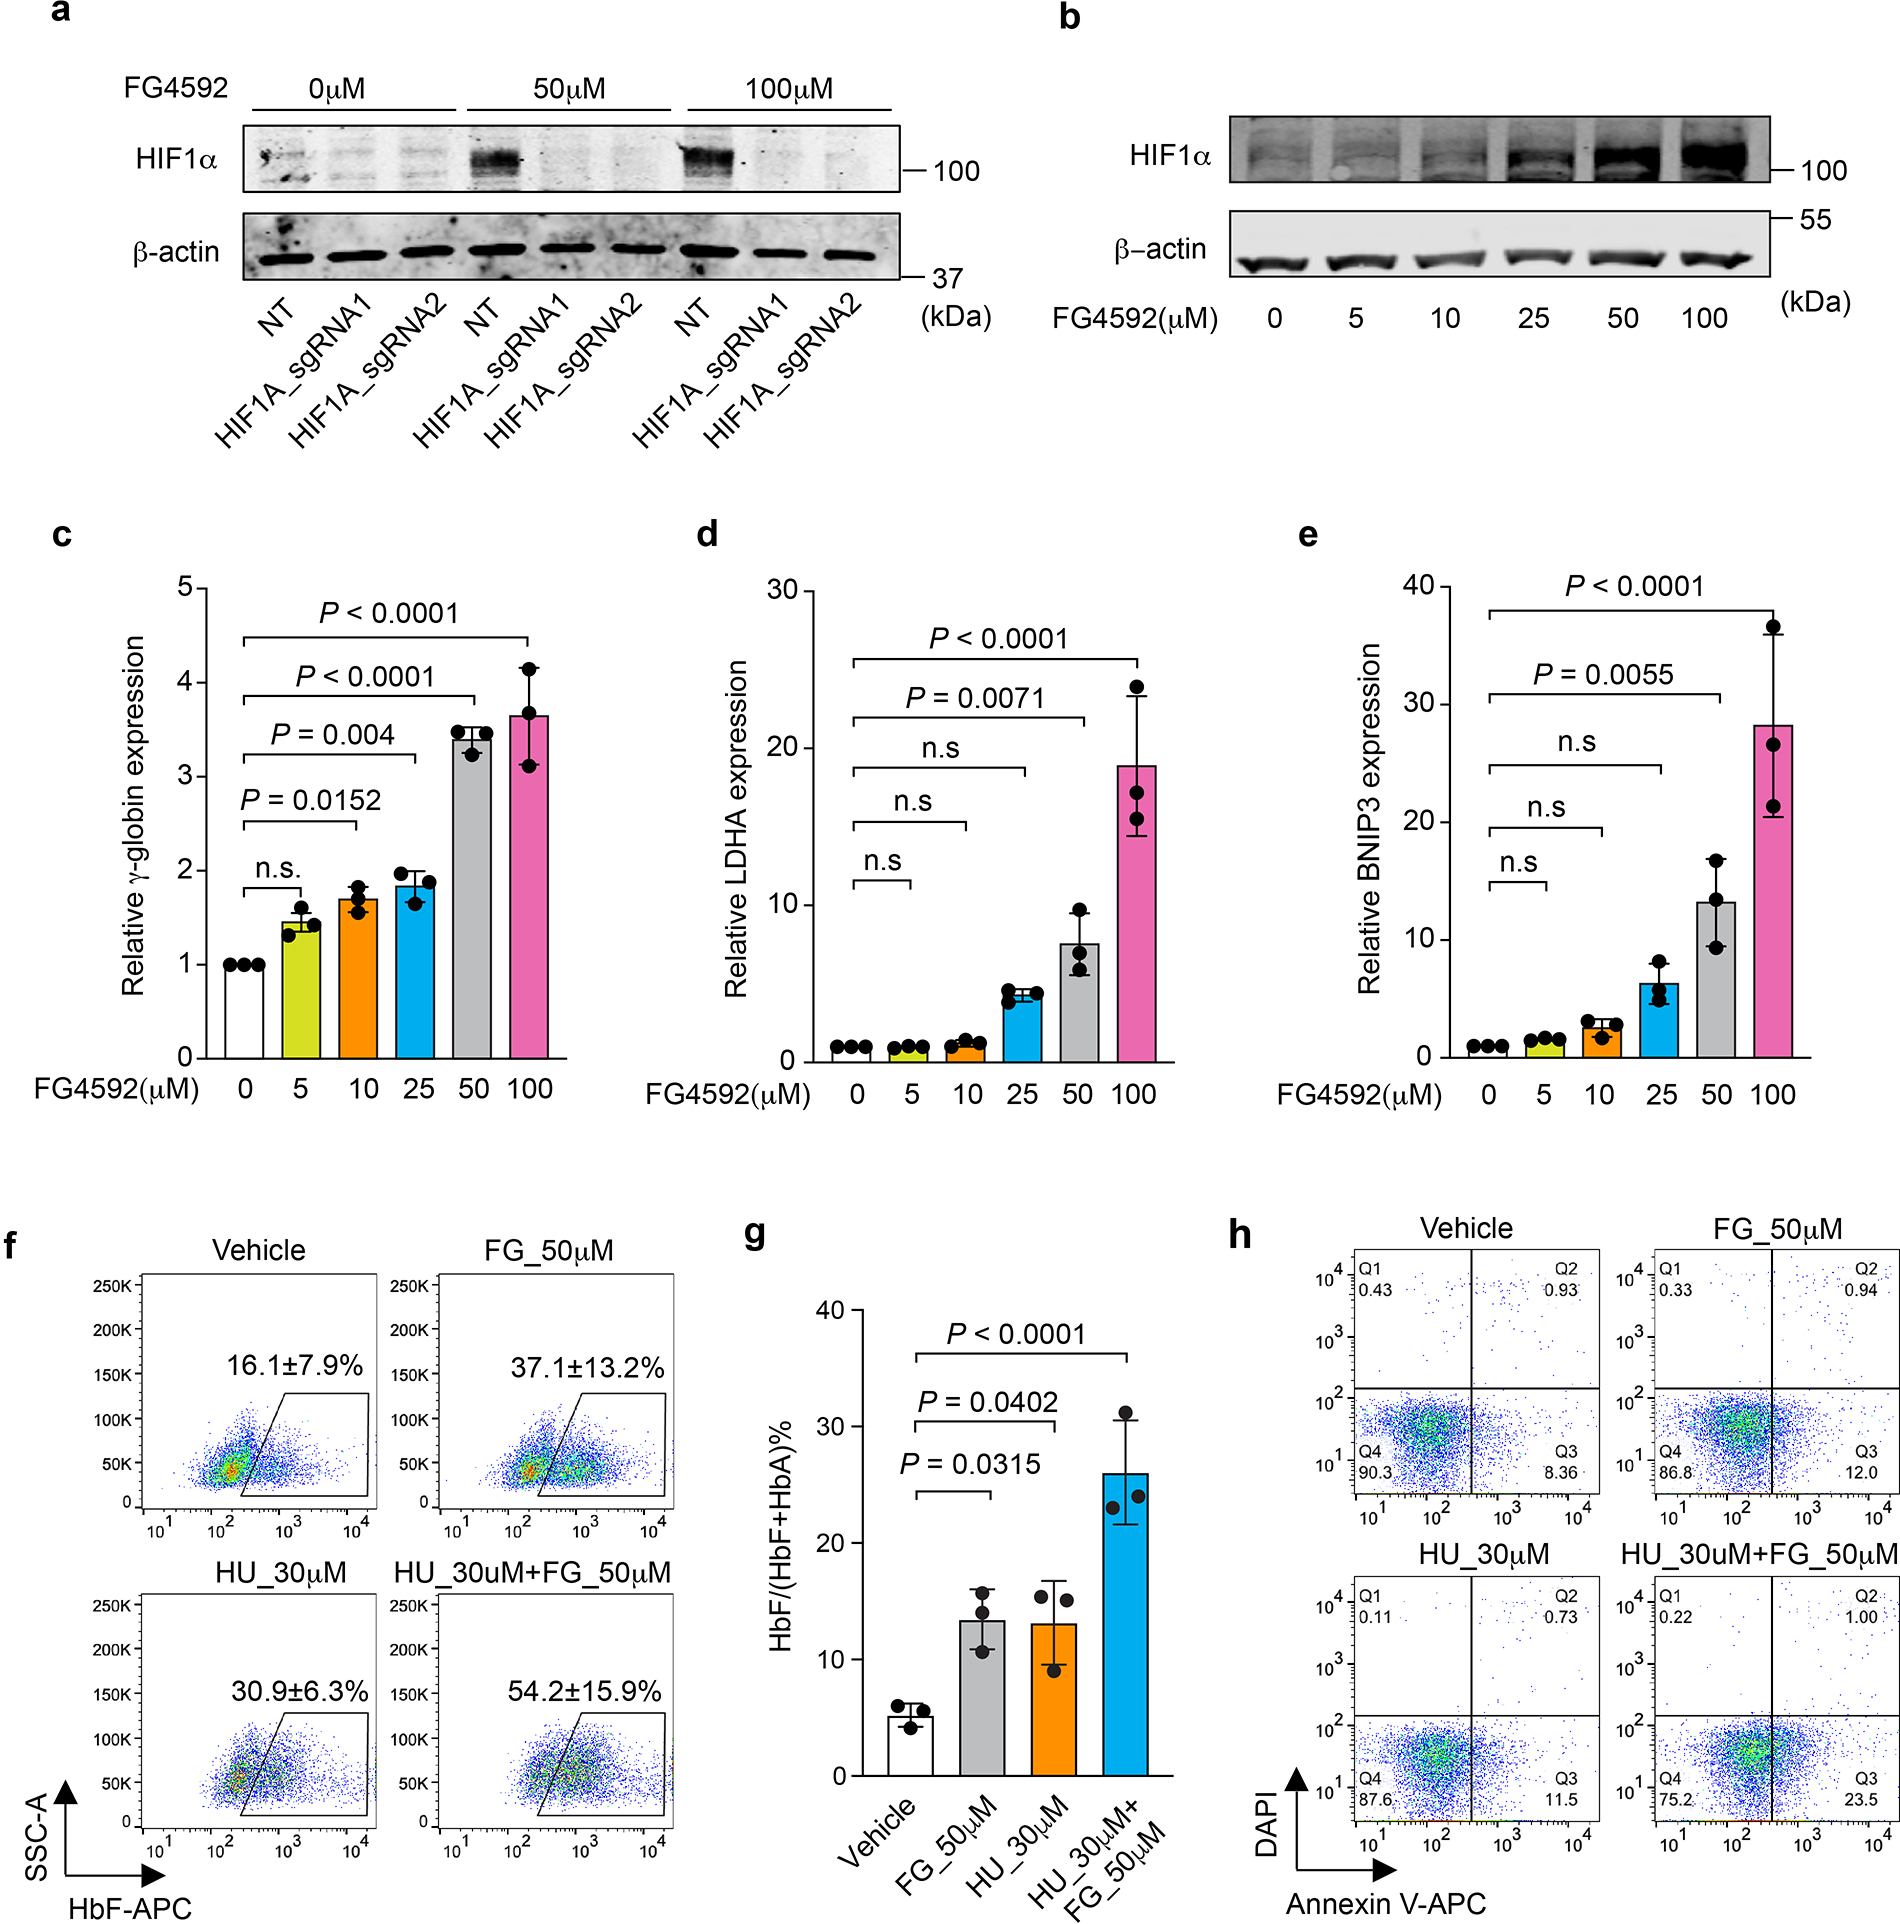
Normal adult donor CD34+ HSPCs were transfected with Cas9 RNP targeting HIF1A with two different sgRNAs or nontargeting (NT) sgRNA, after which erythroid differentiation was induced. FG4592 was added on culture day 5. a, Results of Western blot analysis performed on culture day 10, showing the effects of drug and HIF1A RNP on HIF1α protein expression. b, Results of Western blot analysis performed on day 10 showing HIF1α induction with increasing doses of FG4592. c–e, Relative expression of the HIF1α targets γ-globin, LDHA, and BNIP3 as measured by RT-qPCR and normalized to AHSP mRNA at different doses of FG4592. (Data are presented as mean ± s.d., n=3 independent experiments with different donor CD34+ cells). Multiplicity adjusted P-values by ordinary one-way ANOVA with Dunnett’s MCT against 0 μM. f, CD34+ cells from healthy adult donors were induced to undergo erythroid differentiation. FG4592 and/or hydroxyurea (HU) were added at culture day 5. The %F-cells was determined at day 15. The mean ± s.d. from three biological replicate experiments using CD34+ cells from different normal donors are shown. g, %HbF in cells described for panel f, determined at day 15 of differentiation. Data are presented as mean ± s.d., n=3 independent experiments with different donor CD34+ cells). Multiplicity adjusted P-values were determined by ordinary one-way ANOVA with Dunnett’s MCT against vehicle. h, Peripheral blood mononuclear cells from a donor with SCD were induced to undergo erythroid differentiation, and the indicated drugs were added at day 5. Annexin V staining for apoptosis was performed on day 15. Representative results are shown here, experiments were repeated independently 3 times with similar results.
Extended Data Figure 9. Model of the activation of γ-globin transcription by HIF1α in adult-type erythroid cells.
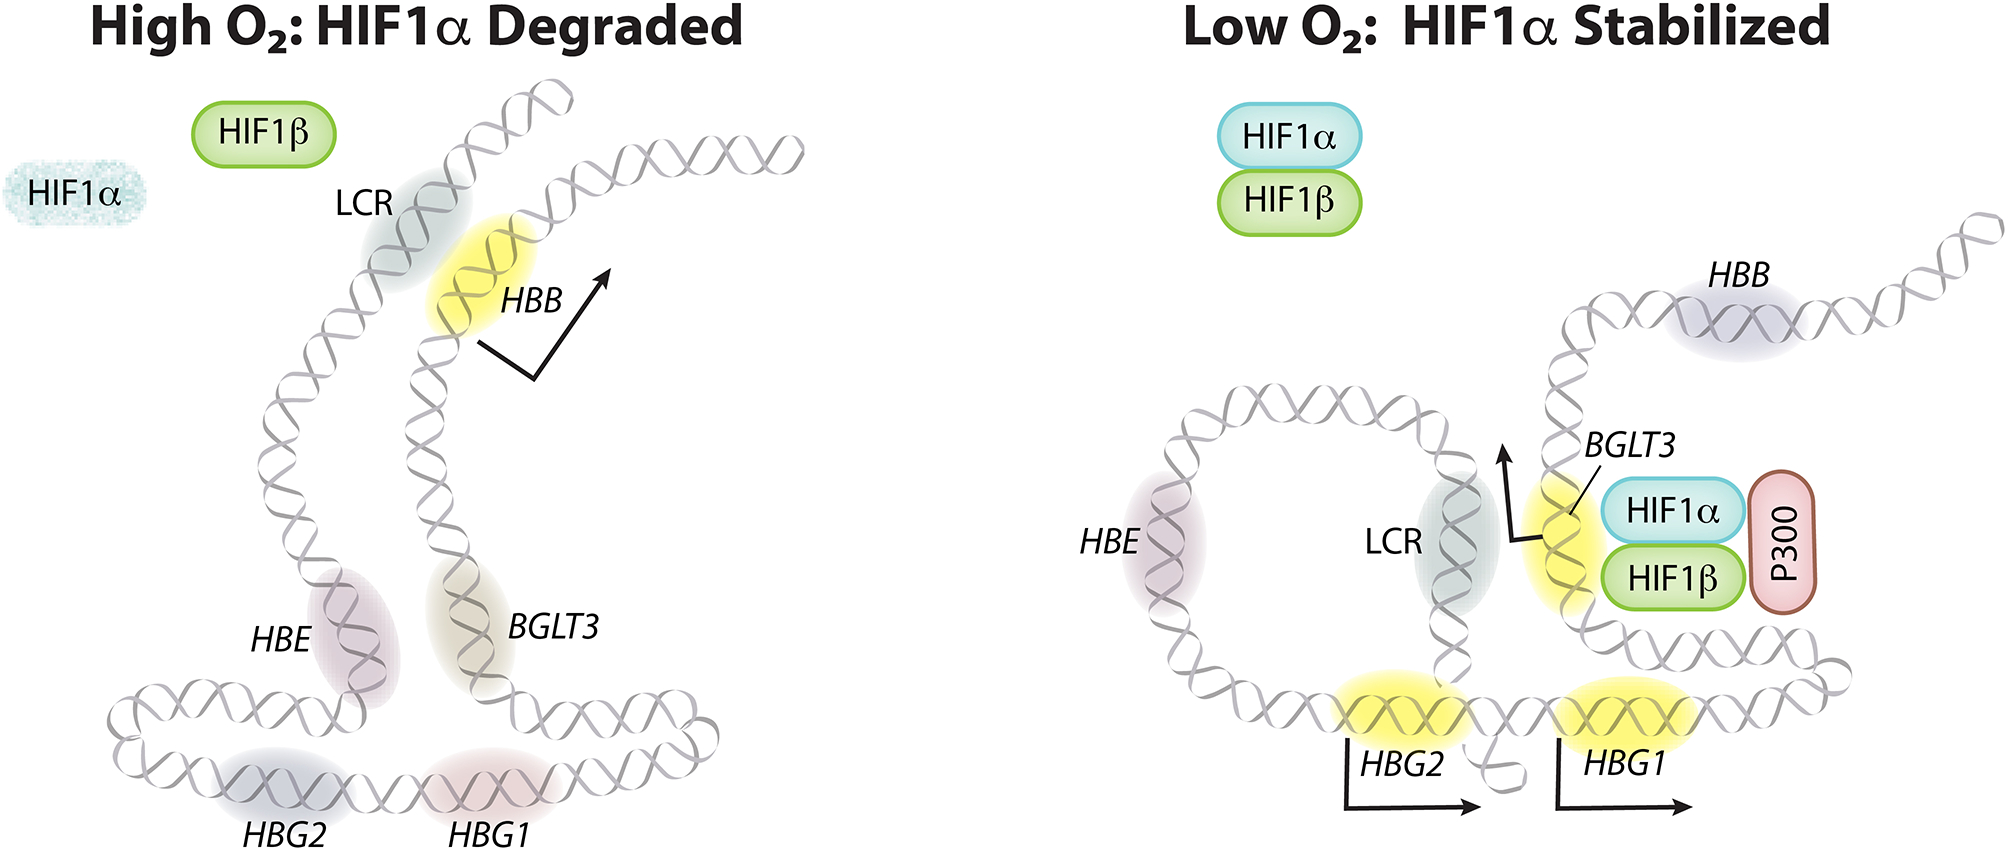
At high oxygen levels, HIF1α is hydroxylated by proline hydroxylase domain (PHD) enzymes and targeted for degradation by the VHL E3 ubiquitin ligase complex (not shown). The transcriptionally silent BGLT3, HBE, and γ-globin (HBG1 and HBG2) genes interact via chromatin looping, whereas the upstream LCR enhancer interacts with the active adult β-globin gene (HBB) to drive its transcription. At low oxygen levels, PHD enzymes are inactive and HIF1α accumulates and heterodimerizes with HIF1β. The HIF heterodimers bind two tandem HRE elements in BGLT3, leading to the recruitment of the transcriptional activators P300 and GATA1 (not shown), the acquisition of local enhancer functions, and the induction of the BGLT3 long noncoding RNA transcript (not shown). Activated BGLT3 unlocks the interaction with HBE, redirects the LCR to the γ-globin genes, and activates their transcription. The solid arrows indicate mRNA transcription. Yellow indicates transcriptionally active genes.
Supplementary Material
Acknowledgments
The authors thank Keith A. Laycock for scientific editing of the manuscript. We thank John Olson, Madan Babu and Hal Broxmeyer for discussions and comments on the manuscript. We thank the following individuals for reagents and support: Ryo Kurita and Yukio Nakamura (RIKEN BioResource Center) for HUDEP-2 cells; David Root (Genetic Perturbation Platform, Broad Institute) for generating the CRISPR/Cas9 sgRNA library targeting UPS components; Greg Newby and David R. Liu (Broad Institute) for the Lenti-ABE8-NG blasticidin vector; Steve Henikoff (Fred Hutchison Cancer Research Center) for protein A–micrococcal nuclease; and Xiuli An (New York Blood Center) for APC-conjugated anti-BAND3. We thank the following St. Jude Children’s Research Hospital core facilities: the Hartwell Center, the Center for Advanced Genome Engineering, the Center for Proteomics and Metabolomics, and the Flow Cytometry and Cell Sorting Shared Resource. This work was supported by National Institutes of Health (NIH) grants P01HL053749 (M.J.W.), R24 DK106766 (M.J.W. and Y.C.); by the Assisi Foundation of Memphis (M.J.W.); by the St. Jude Collaborative Research Consortium and St. Jude/ALSAC (M.J.W); and by the National Institute of Diabetes and Digestive and Kidney Diseases (NIDDK), grants nos. F32DK118822 and K01DK132453, and a Cooley’s Anemia Foundation Postdoctoral Research Award (P.D). The St. Jude Children’s Research Hospital shared resource core facilities are supported by NIH grant P30CA21765 and by St. Jude/ALSAC. The content of this manuscript is solely the responsibility of the authors and does not necessarily represent the official views of the NIH.
Footnotes
Competing interests
M.J.W. serves on the advisory boards for Cellarity Inc., Novartis, Graphite Bio, Dyne Therapeutics, and Forma Therapeutics, and owns equity in Cellarity, Inc.
Code availability
The codes used to perform ATAC-seq (HemTools atac_seq), CUT&RUN (HemTools cut_run), Footprint analysis (cut_run_footprint.py), S3norm analysis (S3norm.py), Capture-C analysis (Capture.py), and base-editing amplicon sequencing analysis (crispresso2_BE.py) are available at https://github.com/YichaoOU/HemTools and https://doi.org/10.5281/zenodo.4783657.
Pipeline documentation is available at https://hemtools.readthedocs.io/en/latest/.
Data availability
The CUT&RUN, RNA-seq, ATAC-seq, and Capture-C data are deposited in the Gene Expression Omnibus (GEO) database (accession number GSE184461). All the sequencing data are mapped to hg19 human genome.
Main Text References
- 1.Vinjamur DS, Bauer DE & Orkin SH Recent progress in understanding and manipulating haemoglobin switching for the haemoglobinopathies. Br J Haematol 180, 630–643 (2018). [DOI] [PubMed] [Google Scholar]
- 2.Doerfler PA, et al. Genetic therapies for the first molecular disease. J Clin Invest 131, e146394 (2021). [DOI] [PMC free article] [PubMed] [Google Scholar]
- 3.Kaelin WG Jr. & Ratcliffe PJ Oxygen sensing by metazoans: the central role of the HIF hydroxylase pathway. Mol Cell 30, 393–402 (2008). [DOI] [PubMed] [Google Scholar]
- 4.Semenza GL Hypoxia-inducible factor 1 (HIF-1) pathway. Sci STKE 2007, cm8 (2007). [DOI] [PubMed] [Google Scholar]
- 5.Kato GJ, et al. Sickle cell disease. Nat Rev Dis Primers 4, 18010 (2018). [DOI] [PubMed] [Google Scholar]
- 6.Taher AT, Musallam KM & Cappellini MD beta-Thalassemias. N Engl J Med 384, 727–743 (2021). [DOI] [PubMed] [Google Scholar]
- 7.Steinberg MH Fetal Hemoglobin in Sickle Cell Anemia. Blood 136, 2392–2400 (2020). [DOI] [PMC free article] [PubMed] [Google Scholar]
- 8.El Hoss S, et al. Fetal hemoglobin rescues ineffective erythropoiesis in sickle cell disease. Haematologica 106, 2707–2719 (2021). [DOI] [PMC free article] [PubMed] [Google Scholar]
- 9.Palstra RJ, de Laat W & Grosveld F Beta-globin regulation and long-range interactions. Adv Genet 61, 107–142 (2008). [DOI] [PubMed] [Google Scholar]
- 10.Alter BP, Rappeport JM, Huisman TH, Schroeder WA & Nathan DG Fetal erythropoiesis following bone marrow transplantation. Blood 48, 843–853 (1976). [PubMed] [Google Scholar]
- 11.Bard H, Fouron JC, Gagnon C & Gagnon J Hypoxemia and increased fetal hemoglobin synthesis. J Pediatr 124, 941–943 (1994). [DOI] [PubMed] [Google Scholar]
- 12.Link MP & Alter BP Fetal-like erythropoiesis during recovery from transient erythroblastopenia of childhood (TEC). Pediatr Res 15, 1036–1039 (1981). [DOI] [PubMed] [Google Scholar]
- 13.Papayannopoulou T Control of fetal globin expression in man: new opportunities to challenge past discoveries. Exp Hematol 92, 43–50 (2020). [DOI] [PubMed] [Google Scholar]
- 14.Stamatoyannopoulos G, et al. On the induction of fetal hemoglobin in the adult; stress erythropoiesis, cell cycle-specific drugs, and recombinant erythropoietin. Prog Clin Biol Res 251, 443–453 (1987). [PubMed] [Google Scholar]
- 15.DeSimone J, Biel SI & Heller P Stimulation of fetal hemoglobin synthesis in baboons by hemolysis and hypoxia. Proc Natl Acad Sci U S A 75, 2937–2940 (1978). [DOI] [PMC free article] [PubMed] [Google Scholar]
- 16.DeSimone J, Heller P, Biel M & Zwiers D Genetic relationship between fetal Hb levels in normal and erythropoietically stressed baboons. Br J Haematol 49, 175–183 (1981). [DOI] [PubMed] [Google Scholar]
- 17.Geng F, Wenzel S & Tansey WP Ubiquitin and proteasomes in transcription. Annu Rev Biochem 81, 177–201 (2012). [DOI] [PMC free article] [PubMed] [Google Scholar]
- 18.Doerfler PA, et al. Activation of gamma-globin gene expression by GATA1 and NF-Y in hereditary persistence of fetal hemoglobin. Nat Genet 53, 1177–1186 (2021). [DOI] [PMC free article] [PubMed] [Google Scholar]
- 19.Kurita R, et al. Establishment of immortalized human erythroid progenitor cell lines able to produce enucleated red blood cells. PLoS One 8, e59890 (2013). [DOI] [PMC free article] [PubMed] [Google Scholar]
- 20.Xu P, et al. FBXO11-mediated proteolysis of BAHD1 relieves PRC2-dependent transcriptional repression in erythropoiesis. Blood 137, 155–167 (2021). [DOI] [PMC free article] [PubMed] [Google Scholar]
- 21.Lan X, et al. The E3 ligase adaptor molecule SPOP regulates fetal hemoglobin levels in adult erythroid cells. Blood Adv 3, 1586–1597 (2019). [DOI] [PMC free article] [PubMed] [Google Scholar]
- 22.Liu N, et al. Direct Promoter Repression by BCL11A Controls the Fetal to Adult Hemoglobin Switch. Cell 173, 430–442 e417 (2018). [DOI] [PMC free article] [PubMed] [Google Scholar]
- 23.Masuda T, et al. Transcription factors LRF and BCL11A independently repress expression of fetal hemoglobin. Science 351, 285–289 (2016). [DOI] [PMC free article] [PubMed] [Google Scholar]
- 24.Traxler EA, et al. A genome-editing strategy to treat beta-hemoglobinopathies that recapitulates a mutation associated with a benign genetic condition. Nat Med 22, 987–990 (2016). [DOI] [PMC free article] [PubMed] [Google Scholar]
- 25.Yu L, et al. Identification of Novel gamma-globin Inducers Among All Current Potential Erythroid Druggable Targets. Blood Adv (2022). [DOI] [PMC free article] [PubMed] [Google Scholar]
- 26.del Peso L, et al. The von Hippel Lindau/hypoxia-inducible factor (HIF) pathway regulates the transcription of the HIF-proline hydroxylase genes in response to low oxygen. J Biol Chem 278, 48690–48695 (2003). [DOI] [PubMed] [Google Scholar]
- 27.Skene PJ, Henikoff JG & Henikoff S Targeted in situ genome-wide profiling with high efficiency for low cell numbers. Nat Protoc 13, 1006–1019 (2018). [DOI] [PubMed] [Google Scholar]
- 28.Schodel J, et al. High-resolution genome-wide mapping of HIF-binding sites by ChIP-seq. Blood 117, e207–217 (2011). [DOI] [PMC free article] [PubMed] [Google Scholar]
- 29.Ludwig LS, et al. Transcriptional States and Chromatin Accessibility Underlying Human Erythropoiesis. Cell Rep 27, 3228–3240 e3227 (2019). [DOI] [PMC free article] [PubMed] [Google Scholar]
- 30.Semenza GL, Nejfelt MK, Chi SM & Antonarakis SE Hypoxia-inducible nuclear factors bind to an enhancer element located 3’ to the human erythropoietin gene. Proc Natl Acad Sci U S A 88, 5680–5684 (1991). [DOI] [PMC free article] [PubMed] [Google Scholar]
- 31.Ivaldi MS, et al. Fetal gamma-globin genes are regulated by the BGLT3 long noncoding RNA locus. Blood 132, 1963–1973 (2018). [DOI] [PMC free article] [PubMed] [Google Scholar]
- 32.Johnson RM, et al. Humans and old world monkeys have similar patterns of fetal globin expression. J Exp Zool 288, 318–326 (2000). [DOI] [PubMed] [Google Scholar]
- 33.Dogan N, et al. Occupancy by key transcription factors is a more accurate predictor of enhancer activity than histone modifications or chromatin accessibility. Epigenetics Chromatin 8, 16 (2015). [DOI] [PMC free article] [PubMed] [Google Scholar]
- 34.Long HK, Prescott SL & Wysocka J Ever-Changing Landscapes: Transcriptional Enhancers in Development and Evolution. Cell 167, 1170–1187 (2016). [DOI] [PMC free article] [PubMed] [Google Scholar]
- 35.Huang P, et al. Comparative analysis of three-dimensional chromosomal architecture identifies a novel fetal hemoglobin regulatory element. Genes Dev 31, 1704–1713 (2017). [DOI] [PMC free article] [PubMed] [Google Scholar]
- 36.Gruber M, et al. Acute postnatal ablation of Hif-2alpha results in anemia. Proc Natl Acad Sci U S A 104, 2301–2306 (2007). [DOI] [PMC free article] [PubMed] [Google Scholar]
- 37.Percy MJ, et al. A gain-of-function mutation in the HIF2A gene in familial erythrocytosis. N Engl J Med 358, 162–168 (2008). [DOI] [PMC free article] [PubMed] [Google Scholar]
- 38.Scortegagna M, et al. HIF-2alpha regulates murine hematopoietic development in an erythropoietin-dependent manner. Blood 105, 3133–3140 (2005). [DOI] [PubMed] [Google Scholar]
- 39.Chen N, et al. Roxadustat for Anemia in Patients with Kidney Disease Not Receiving Dialysis. N Engl J Med 381, 1001–1010 (2019). [DOI] [PubMed] [Google Scholar]
- 40.Sanghani NS & Haase VH Hypoxia-Inducible Factor Activators in Renal Anemia: Current Clinical Experience. Adv Chronic Kidney Dis 26, 253–266 (2019). [DOI] [PMC free article] [PubMed] [Google Scholar]
- 41.Bhoopalan SV, Huang LJ & Weiss MJ Erythropoietin regulation of red blood cell production: from bench to bedside and back. F1000Res 9, 1153 (2020). [DOI] [PMC free article] [PubMed] [Google Scholar]
- 42.Haase VH Hypoxia-inducible factor-prolyl hydroxylase inhibitors in the treatment of anemia of chronic kidney disease. Kidney Int Suppl (2011) 11, 8–25 (2021). [DOI] [PMC free article] [PubMed] [Google Scholar]
- 43.Flygare J, Rayon Estrada V, Shin C, Gupta S & Lodish HF HIF1alpha synergizes with glucocorticoids to promote BFU-E progenitor self-renewal. Blood 117, 3435–3444 (2011). [DOI] [PMC free article] [PubMed] [Google Scholar]
- 44.Hsieh MM, et al. HIF prolyl hydroxylase inhibition results in endogenous erythropoietin induction, erythrocytosis, and modest fetal hemoglobin expression in rhesus macaques. Blood 110, 2140–2147 (2007). [DOI] [PMC free article] [PubMed] [Google Scholar]
- 45.Bunn HF Evolution of mammalian hemoglobin function. Blood 58, 189–197 (1981). [PubMed] [Google Scholar]
- 46.Hebbel RP, Berger EM & Eaton JW Effect of increased maternal hemoglobin oxygen affinity on fetal growth in the rat. Blood 55, 969–974 (1980). [PubMed] [Google Scholar]
- 47.Hebbel RP, et al. Human llamas: adaptation to altitude in subjects with high hemoglobin oxygen affinity. J Clin Invest 62, 593–600 (1978). [DOI] [PMC free article] [PubMed] [Google Scholar]
- 48.Salomon-Andonie J, et al. Effect of congenital upregulation of hypoxia inducible factors on percentage of fetal hemoglobin in the blood. Blood 122, 3088–3089 (2013). [DOI] [PMC free article] [PubMed] [Google Scholar]
- 49.Russell RC, et al. Loss of JAK2 regulation via a heterodimeric VHL-SOCS1 E3 ubiquitin ligase underlies Chuvash polycythemia. Nat Med 17, 845–853 (2011). [DOI] [PMC free article] [PubMed] [Google Scholar]
- 50.Imanirad P & Dzierzak E Hypoxia and HIFs in regulating the development of the hematopoietic system. Blood Cells Mol Dis 51, 256–263 (2013). [DOI] [PMC free article] [PubMed] [Google Scholar]
References for Methods
- 51.Sanjana NE, Shalem O & Zhang F Improved vectors and genome-wide libraries for CRISPR screening. Nat Methods 11, 783–784 (2014). [DOI] [PMC free article] [PubMed] [Google Scholar]
- 52.Li W, et al. MAGeCK enables robust identification of essential genes from genome-scale CRISPR/Cas9 knockout screens. Genome Biol 15, 554 (2014). [DOI] [PMC free article] [PubMed] [Google Scholar]
- 53.Connelly JP & Pruett-Miller SM CRIS.py: A Versatile and High-throughput Analysis Program for CRISPR-based Genome Editing. Sci Rep 9, 4194 (2019). [DOI] [PMC free article] [PubMed] [Google Scholar]
- 54.Brinkman EK, Chen T, Amendola M & van Steensel B Easy quantitative assessment of genome editing by sequence trace decomposition. Nucleic Acids Res 42, e168 (2014). [DOI] [PMC free article] [PubMed] [Google Scholar]
- 55.Wu Y, et al. Highly efficient therapeutic gene editing of human hematopoietic stem cells. Nat Med 25, 776–783 (2019). [DOI] [PMC free article] [PubMed] [Google Scholar]
- 56.Ritchie ME, et al. limma powers differential expression analyses for RNA-sequencing and microarray studies. Nucleic Acids Res 43, e47 (2015). [DOI] [PMC free article] [PubMed] [Google Scholar]
- 57.Neph S, et al. BEDOPS: high-performance genomic feature operations. Bioinformatics 28, 1919–1920 (2012). [DOI] [PMC free article] [PubMed] [Google Scholar]
- 58.Heinz S, et al. Simple combinations of lineage-determining transcription factors prime cis-regulatory elements required for macrophage and B cell identities. Mol Cell 38, 576–589 (2010). [DOI] [PMC free article] [PubMed] [Google Scholar]
- 59.Zhu Q, Liu N, Orkin SH & Yuan GC CUT&RUNTools: a flexible pipeline for CUT&RUN processing and footprint analysis. Genome Biol 20, 192 (2019). [DOI] [PMC free article] [PubMed] [Google Scholar]
- 60.Xiang G, et al. S3norm: simultaneous normalization of sequencing depth and signal-to-noise ratio in epigenomic data. Nucleic Acids Res 48, e43 (2020). [DOI] [PMC free article] [PubMed] [Google Scholar]
- 61.Gstalder C, et al. Inactivation of Fbxw7 Impairs dsRNA Sensing and Confers Resistance to PD-1 Blockade. Cancer Discov 10, 1296–1311 (2020). [DOI] [PMC free article] [PubMed] [Google Scholar]
- 62.Clement K, et al. CRISPResso2 provides accurate and rapid genome editing sequence analysis. Nat Biotechnol 37, 224–226 (2019). [DOI] [PMC free article] [PubMed] [Google Scholar]
- 63.Davies JO, et al. Multiplexed analysis of chromosome conformation at vastly improved sensitivity. Nat Methods 13, 74–80 (2016). [DOI] [PMC free article] [PubMed] [Google Scholar]
- 64.Corces MR, et al. An improved ATAC-seq protocol reduces background and enables interrogation of frozen tissues. Nat Methods 14, 959–962 (2017). [DOI] [PMC free article] [PubMed] [Google Scholar]
Associated Data
This section collects any data citations, data availability statements, or supplementary materials included in this article.
Supplementary Materials
Data Availability Statement
The CUT&RUN, RNA-seq, ATAC-seq, and Capture-C data are deposited in the Gene Expression Omnibus (GEO) database (accession number GSE184461). All the sequencing data are mapped to hg19 human genome.