

Abstract
Aims
Reduction in appendicular skeletal muscle mass index (ASMI) assessed by dual‐energy X‐ray absorptiometry (DEXA) has been shown to be independently associated with a higher mortality rate in patients with heart failure (HF). However, DEXA is not suitable for measurement of muscle mass in a daily clinical setting and in large population‐based studies. The aim of this study was to determine whether ASMI predicted from anthropometric indicators (predicted ASMI) serves as an alternative to DEXA‐measured ASMI for predicting all‐cause death in HF patients.
Methods and Results
Data for 539 HF patients who received a DEXA scan and measurements of calf circumferences (CC) and mid‐arm circumferences (MAC) in our hospital were analysed. Predicted ASMI was calculated as we previously reported: predicted ASMI (kg/m2) = [0.214 × weight (kg) + 0.217 × CC (cm) − 0.189 × MAC (cm) + 1.098 (male = 1, female = −1) + 0.576]/height2 (m2). Low ASMI values were defined as <7.00 kg/m2 and <5.40 kg/m2 for men and women, respectively, according to the criteria of the Asian Working Group for Sarcopenia. The median follow‐up period was 1.75 years (interquartile range, 0.96–2.37 years), and 79 patients (15%) died. Kaplan–Meier survival curves showed that patients with low DEXA‐measured ASMI and patients with low predicted ASMI had significantly lower survival rates than those for patients with high ASMI. In multivariate Cox proportional hazard analyses adjusted for age, sex, logarithmic B‐type natriuretic peptide, cystatin C based‐estimated glomerular filtration rate, and gait speed, DEXA‐measured ASMI [hazard ratio (HR), 0.982; 95% confidence interval (CI), 0.967–0.998; P = 0.026] and predicted ASMI (HR, 0.979; 95% CI, 0.962–0.996; P = 0.018) were independent predictors of all‐cause mortality. Inclusion of predicted ASMI into the adjustment model significantly improved continuous net reclassification improvement (0.338; 95% CI, 0.103–0.572; P < 0.01) and integrated discrimination improvement (0.020; 95% CI, 0.004–0.035; P < 0.05) for predicting mortality after discharge.
Conclusions
Predicted ASMI, as well as DEXA‐measured ASMI, can predict all‐cause death in HF patients, and calculation of predicted ASMI will be useful for detecting high‐risk patients in a daily clinical setting and in large population‐based studies.
Keywords: Heart failure, Sarcopenia, Muscle mass, Mortality, Dual‐energy X‐ray absorptiometry, Calf circumference
Background
Accurate prediction of mortality in patients with heart failure (HF) is a critical issue. Reduction in appendicular skeletal muscle mass (ASM) index (ASMI) assessed by dual‐energy X‐ray absorptiometry (DEXA), a gold standard technique for measuring muscle mass, 1 has been shown to be frequently observed and independently associated with higher mortality rate in HF patients. 2 , 3 , 4 However, DEXA is not suitable for measuring muscle mass in a daily clinical setting and in large population‐based studies because it is a costly and hospital‐based modality. In contrast, measurements of anthropometric indicators such as calf circumferences (CC) and mid‐arm circumferences (MAC) are inexpensive and repeatable methods for assessing nutritional status and body composition including muscle mass. 5 , 6 , 7 We recently reported that an equation for ASMI estimation by the use of CC and MAC predicts DEXA‐measured ASMI in HF patients with reasonable accuracy. 8
Aims
The aim of this study was to determine whether anthropometric indicators‐derived ASMI serves as an alternative to DEXA‐measured ASMI for the prediction of prognosis in HF patients.
Methods
This study was conducted in strict adherence with the principles of the Declaration of Helsinki and was approved by the Clinical Investigation Ethics Committee of Sapporo Medical University Hospital (number 302‐243).
This study was a single‐centre, retrospective, and observational study. We enrolled 539 consecutive HF patients who received a DEXA scan and measurements of CC and MAC during the period from 1 August 2015 to 31 August 2020 (Figure 1 ). HF was diagnosed according to the 2016 ESC Guidelines for the diagnosis and treatment of acute and chronic HF. 9 ASM was calculated by DEXA (Horizon A DXA System, HOLOGIC, Waltham, MA, USA) as previously reported. 8 , 10 ASMI was defined as ASM/height2. The cut‐off values of ASMI for low muscle mass were <7.00 and <5.40 kg/m2 for men and women, respectively, according to the criteria of the Asian Working Group for Sarcopenia. 11 CC and MAC were assessed using a plastic tape measure as previously described. 5 , 6 Anthropometric indicators‐derived ASMI, that is, predicted ASMI, was calculated by using an equation we previously developed: predicted ASMI (kg/m2) = [0.214 × weight (kg) + 0.217 × CC (cm) − 0.189 × MAC (cm) + 1.098 (male = 1, female = −1) + 0.576]/height2 (m2). 8 Data for blood samples including N‐terminal pro‐B‐type natriuretic peptide (NT‐proBNP) and the cystatin C‐based equation for glomerular filtration rate (GFRcys) and echocardiographic data including the left ventricular ejection fraction (LVEF) measured by the modified Simpson method within 14 days of DEXA measurement were retrieved from medical records. The primary endpoint was all‐cause death during the follow‐up period from the day of discharge until 30 June 2021.
Figure 1.
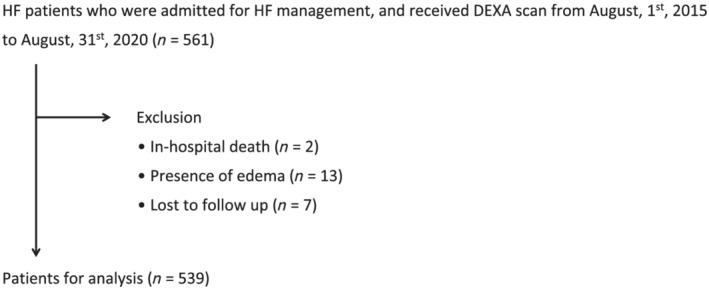
Flow chart of inclusion of patients. DEXA, dual‐energy X‐ray absorptiometry; HF, heart failure.
Statistical methods are described in detail in Data S1 . Data are presented as means ± standard deviation or medians [interquartile range (IQR), 25th, 75th percentile] and expressed as frequency and percentage. Survival curves were calculated by the Kaplan–Meier method, and statistical significance of differences between the curves was assessed by log‐rank statistics. Univariate and multivariate Cox proportional hazard analyses were used to evaluate predictive ability. We constructed logistic models for all‐cause death according to the adjustment of variables in the Cox regression models. Harrell's C‐indexes were calculated and compared between the base model and the model with the addition of ASMI and anthropometric indicators. 10 Continuous net reclassification index (cNRI) and integrated discrimination index (IDI) are the methods to quantify how well the addition of a new marker reclassifies subjects when compared with the baseline model. Using the method previously reported, we calculated cNRI and IDI for assessing the incremental predictive performance afforded by DEXA‐measured ASMI, predicted ASMI, and anthropometric parameters when added to the prediction provided by the established risk factors, that is, age, sex, LVEF, log NT‐proBNP, eGFRcys, and gait speed. 10 , 12 Missing data were imputed using a multiple imputation analysis as shown in Data S1 . As sensitivity analyses, we used multivariate Cox proportional hazard analyses among complete cases. The statistical significance level was set to P < 0.05. Statistical analyses were performed using JMP Pro Version 15.2.1 (SAS Institute Inc., Cary, NC, USA) and R Version 4.0.5 (R Foundation for Statistical Computing, Vienna, Austria).
Results
Baseline characteristics
As shown in Table 1 , the median age of the patients was 73 years (IQR, 63, 82 years), and 43% of them were women. The median BMI of the patients was 22.4 kg/m2. At the time of discharge, 10, 54, and 36% of the patients were in NYHA functional Classes I, II, and III, respectively, and 43% of the patients had a prior history of hospitalization for HF. The median LVEF was 47.6% (IQR, 33.2, 62.9%), and 35% of the patients had HFrEF. The most frequent aetiology of HF was cardiomyopathy (37%) followed by valvular heart diseases (31%) and ischaemic heart diseases (20%). Detailed information of HF aetiology was presented in Table S1 . By using DEXA‐measured ASMI and predicted ASMI, 62 and 71% of the HF patients were classified into low ASMI groups, respectively. Patients with low DEXA‐measured ASMI had higher prevalence of NYHA III symptoms and lower 10‐m gait speed those in patients with high DEXA‐measured ASMI, indicating declined physical function in low ASMI patients. Prevalence of ischaemic heart diseases and diabetes mellitus was higher in patients with low DEXA‐measured ASMI than in patients with high DEXA‐measured ASMI. Plasma levels of NT‐proBNP and cystatin C were higher and levels of haemoglobin and eGFRcys were lower in patients with low DEXA‐measured ASMI than in patients with high DEXA‐measured ASMI.
Table 1.
Baseline characteristics
| Missing | Overall | DEXA‐measured ASMI | Predicted ASMI | |||||
|---|---|---|---|---|---|---|---|---|
| Low | High | P value | Low | High | P value | |||
| n (%) | n = 539 | n = 335 | n = 204 | n = 380 | n = 159 | |||
| Age, years | 73 (63, 82) | 73 (66, 81) | 72 (60, 82) | 0.198 | 73 (66, 82) | 73 (60, 81) | 0.220 | |
| Female, n (%) | 232 (43) | 134 (40) | 98 (48) | 0.068 | 137 (36) | 95 (60) | <0.001 | |
| Height, cm | 159 ± 10 | 159 ± 10 | 159 ± 11 | 0.361 | 160 ± 10 | 157 ± 11 | 0.002 | |
| Body weight, kg | 57.0 (48.1, 66.0) | 53.3 (46.5, 60.2) | 64.5 (53.7, 73.4) | <0.001 | 54.2 (46.1, 61.5) | 65.0 (53.6, 77.0) | <0.001 | |
| BMI, kg/m 2 | 22.4 (20.0, 24.7) | 21.1 (19.1, 23.1) | 24.9 (22.9, 27.8) | <0.001 | 21.3 (19.2, 23.2) | 26.7 (24.1, 28.9) | <0.001 | |
| Systolic blood pressure, mmHg | 114 (103, 127) | 114 (102, 128) | 113 (103, 126) | 0.709 | 113 (102, 126) | 115 (105, 130) | 0.139 | |
| NYHA functional class, n (%) | ||||||||
| I | 54 (10) | 25 (7) | 29 (14) | <0.001 | 39 (10) | 15 (9) | 0.131 | |
| II | 292 (54) | 163 (49) | 129 (63) | 197 (52) | 95 (60) | |||
| III | 193 (36) | 147 (44) | 46 (23) | 144 (38) | 49 (31) | |||
| LVEF, % | 47.6 (33.2, 62.9) | 45.9 (32.4, 62.0) | 51.7 (36.2, 64.0) | 0.033 | 46.6 (32.5, 61.8) | 51.5 (37.0, 65.0) | 0.013 | |
| <40%, n (%) | 189 (35) | 123 (37) | 66 (32) | 0.308 | 141 (37) | 48 (30) | 0.125 | |
| Prior HF hospitalization, n (%) | 234 (43) | 156 (47) | 78 (38) | 0.058 | 168 (44) | 66 (42) | 0.564 | |
| Aetiology, n (%) | ||||||||
| Cardiomyopathy | 200 (37) | 110 (33) | 90 (44) | <0.001 | 143 (38) | 57 (36) | 0.106 | |
| Valvular heart diseases | 169 (31) | 97 (29) | 72 (35) | 108 (28) | 61 (38) | |||
| Ischemic heart diseases | 108 (20) | 87 (26) | 21 (10) | 83 (22) | 25 (16) | |||
| Others | 62 (12) | 41 (12) | 21 (10) | 46 (12) | 16 (10) | |||
| Co‐morbidity, n (%) | ||||||||
| Hypertension | 351 (65) | 221 (66) | 130 (64) | 0.596 | 239 (63) | 112 (70) | 0.094 | |
| Dyslipidaemia | 285 (53) | 174 (52) | 111 (54) | 0.577 | 190 (50) | 95 (60) | 0.039 | |
| Diabetes mellitus | 203 (38) | 145 (43) | 58 (28) | <0.001 | 150 (39) | 53 (33) | 0.180 | |
| Atrial fibrillation | 216 (40) | 142 (42) | 74 (36) | 0.160 | 161 (42) | 55 (35) | 0.093 | |
| Cancer | 113 (21) | 79 (24) | 34 (17) | 0.056 | 88 (23) | 25 (16) | 0.053 | |
| 10‐m gait speed, m/s | 47 (9) | 0.904 ± 0.269 | 0.880 ± 0.272 | 0.941 ± 0.261 | 0.013 | 0.910 ± 0.272 | 0.888 ± 0.263 | 0.801 |
| Laboratory data | ||||||||
| NT‐proBNP, pg/mL | 1197 (511, 2888) | 1513 (666, 3514) | 883 (365, 1931) | <0.001 | 1367 (646, 3258) | 898 (262, 1914) | <0.001 | |
| Haemoglobin, g/dL | 12.2 (10.7, 13.8) | 12.1 (10.5, 13.6) | 12.4 (11.0, 13.6) | 0.018 | 12.1 (10.5, 13.7) | 12.4 (11.2, 13.9) | 0.045 | |
| Cystatin C | 29 (5) | 1.16 (0.95, 1.60) | 1.20 (0.95, 1.68) | 1.12 (0.95, 1.47) | 0.032 | 1.17 (0.95, 1.66) | 1.15 (0.95, 1.42) | 0.283 |
| eGFRcys, mL/min/1.73m 2 | 29 (5) | 56.8 (38.9, 71.5) | 54.2 (37.8, 71.0) | 59.9 (41.6, 72.5) | 0.027 | 56.8 (38.0, 72.2) | 56.9 (41.9, 71.2) | 0.361 |
| Medication, n (%) | ||||||||
| β‐Blocker | 381 (71) | 239 (71) | 142 (70) | 0.668 | 273 (72) | 108 (68) | 0.362 | |
| ACE‐I or ARB | 297 (55) | 181 (54) | 116 (57) | 0.521 | 210 (55) | 87 (55) | 0.907 | |
| MRA | 248 (46) | 165 (49) | 83 (41) | 0.053 | 177 (47) | 71 (45) | 0.683 | |
| Loop diuretics | 301 (56) | 193 (58) | 108 (53) | 0.290 | 221 (58) | 80 (50) | 0.095 | |
| CC, cm | 32.0 (29.3, 34.8) | 30.8 (28.8, 33.0) | 34.8 (31.8, 37.5) | <0.001 | 31.0 (28.6, 33.3) | 35.5 (32.3, 38.5) | <0.001 | |
| MAC, cm | 26.5 (24.0, 28.5) | 25.5 (23.5, 27.0) | 28.3 (26.0, 31.0) | <0.001 | 25.5 (23.5, 27.5) | 28.5 (27.0, 31.0) | <0.001 | |
| ASMI, kg/m 2 | ||||||||
| DEXA‐measured | 5.89 (5.11, 6.77) | 5.32 (4.71, 6.31) | 7.06 (5.88, 7.60) | <0.001 | 5.66 (4.88, 6.58) | 6.29 (5.58, 7.58) | <0.001 | |
| Prediction equation‐estimated | ||||||||
| Katano S. et al. a | 5.89 (5.14, 6.57) | 5.56 (4.90, 6.19) | 6.53 (5.81, 7.18) | <0.001 | 5.58 (4.90, 6.38) | 6.71 (5.80, 7.47) | <0.001 | |
| Wen X. et al. b | 6.76 (5.34, 7.58) | 6.63 (5.17, 7.29) | 7.29 (5.69, 8.18) | <0.001 | 6.84 (5.23, 7.42) | 6.56 (5.63, 8.54) | <0.001 | |
| Kulkarni B. et al. c | 6.30 (5.25, 7.08) | 6.10 (5.14, 6.79) | 6.79 (5.58, 7.75) | <0.001 | 6.29 (5.06, 6.94) | 6.36 (5.54, 8.09) | <0.001 | |
| Visvanathan R. et al. d | 7.35 (5.43, 7.90) | 7.32 (5.38, 7.74) | 7.63 (5.57, 8.26) | <0.001 | 7.42 (5.39, 7.81) | 6.11 (5.51, 8.49) | 0.023 | |
| Villani A. M. et al. Eq. 1 e | 6.48 (6.10, 6.91) | 6.45 (6.14, 6.78) | 6.58 (6.00, 7.19) | 0.077 | 6.47 (6.16, 6.81) | 6.50 (5.93, 7.27) | 0.630 | |
| Eq. 2 f | 6.45 (6.19, 6.79) | 6.41 (6.14, 7.08) | 6.60 (6.14, 7.08) | 0.002 | 6.42 (6.04, 7.13) | 6.51 (6.04, 7.13) | 0.115 | |
ACE‐I, angiotensin‐converting enzyme inhibitor; ARB, angiotensin receptor blocker; ASMI, appendicular skeletal muscle mass index; BMI, body mass index; CC, calf circumferences; DEXA, dual‐energy X‐ray absorptiometry; eGFRcys, cystatin C‐based estimated glomerular filtration rate; HF, heart failure; LVEF, left ventricular ejection fraction; MAC, mid‐arm circumferences; MRA, mineralocorticoid receptor antagonist; n, number of patients for whom the parameter was available; NT‐proBNP, N‐terminal pro‐B‐type natriuretic peptide; NYHA, New York Heart Association.
Data are presented as mean ± standard deviation of the mean, median (interquartile range, 25th, 75th percentile), or number (with percentage). The cut‐off values of low ASMI were <7.00 and < 5.4 kg/m2 for males and females, respectively. Prediction equations from previous studies using anthropometric measurements were as follows.
0.214 × weight (kg) + 0.217 × CC (cm) − 0.189 × MAC (cm) + 1.098 (man = 1, woman = −1) + 0.576.
−13.432 − 0.0445 × age (years) + 0.200 × weight (kg) + 0.140 × height (cm) for man; −9.852 − 0.028 × age (years) + 0.170 × weight (kg) + 0.102 × height (cm) for woman.
0.193 × weight (kg) + 0.107 × height (cm) − 4.157 × gender (man = 1, woman = 2) − 0.037 × age (years) − 2.631.
10.047427 + 0.353307 × weight (kg) − 0.621112 × BMI (kg/m2) − 0.022741 × age (years) + 5.096201 (man = 1, woman = 0).
22.28 − 0.069 × age (years) + 0.407 × weight (kg) − 0.807 × BMI (kg/m2) − 0.222 × MAC (cm).
16.77 − 0.036 × age (years) + 0.385 × weight (kg) − 0.873 × BMI (kg/m2).
Association of ASMI with all‐cause death
The median follow‐up period was 1.75 years (IQR, 0.96, 2.37 years), and 79 patients (15%) died (40 patients from HF‐related causes, nine patients from cancer, eight patients from infection, three patients from stroke, two patients from digestive disease, and 17 patients from unknown causes). As shown in Figure 2 , Kaplan–Meier survival curves showed that all‐cause mortality rate was higher in patients with low DEXA‐measured ASMI and low predicted ASMI than in patients with high DEXA‐measured ASMI and high predicted ASMI, respectively. In multivariate Cox proportional hazard analyses with adjustment for potential risk factors (age, sex, LVEF, log NT‐proBNP, eGFRcys, and 10‐m gait speed), DEXA‐measured ASMI and predicted ASMI were independent predictors for all‐cause death (Table 2 ). Similar results were obtained in sensitivity analyses using data for complete cases (Table 2 ). In addition, inclusion of DEXA‐measured ASMI and predicted ASMI to the baseline model constructed by potential risk factors significantly improved both cNRI and IDI (Table 3 ), indicating that both DEXA‐measured ASMI and predicted ASMI have additive impacts on the prediction of all‐cause death in HF patients. CC and MAC alone were also independently associated with all‐cause death (Table 2 ), whereas they did not improve cNRI and IDI (Table 3 ). The sensitivities for predicting all‐cause death were comparable between DEXA‐measured ASMI and predicted ASMI, but the specificity of DEXA‐measured ASMI was significantly higher than that of predicted ASMI (Figure S1 ).
Figure 2.
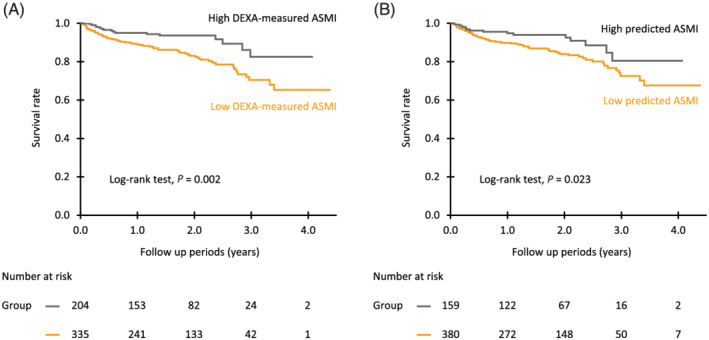
Kaplan–Meier event‐free survival curves in patients with heart failure (HF). HF patients were divided into two groups according to the cut‐off values of appendicular skeletal muscle mass index (ASMI) for muscle wasting, that is, reduction in muscle mass. The cut‐off values for ASMI used in this study were <7.00 and <5.40 kg/m2 for males and females, respectively, according to the criteria of the Asian Working Group for Sarcopenia. (A) ASMI measured by dual‐energy X‐ray absorptiometry. (B), Anthropometric indicators‐derived ASMI (predicted ASMI). Predicted ASMI was calculated by using an equation we previously developed: predicted ASMI (kg/m2) = [0.214 × weight (kg) + 0.217 × CC (cm) − 0.189 × MAC (cm) + 1.098 (male = 1, female = −1) + 0.576]/height2 (m2). 5 ASMI, appendicular skeletal muscle mass index; CC, calf circumferences; HF, heart failure; MAC, mid‐arm circumferences.
Table 2.
Impact of ASMIs and anthropometric measurements on all‐cause mortality in HF patients
| Univariate model |
Multivariate model a (Multiple imputation analyses, n = 539) |
Multivariate model a (Complete case analyses, n = 456) |
|||||||
|---|---|---|---|---|---|---|---|---|---|
| Variables | HR | (95% CI) | P value | HR | (95% CI) | P value | HR | (95% CI) | P value |
| DEXA‐measured ASMI | 0.979 | (0.967, 0.991) | <0.001 | 0.982 | (0.967, 0.998) | 0.026 | 0.979 | (0.961, 0.998) | 0.024 |
| Predicted ASMI | |||||||||
| Katano S. et al. (present study) | 0.980 | (0.967, 0.993) | 0.002 | 0.979 | (0.962, 0.996) | 0.018 | 0.976 | (0.957, 0.996) | 0.014 |
| Wen X. et al. | 0.988 | (0.978, 0.998) | 0.021 | 0.979 | (0.958, 1.000) | 0.059 | 0.973 | (0.949, 0.998) | 0.032 |
| Kulkarni B. et al. | 0.984 | (0.973, 0.996) | 0.007 | 0.982 | (0.961, 1.002) | 0.090 | 0.976 | (0.952, 1.000) | 0.053 |
| Visvanathan R. et al. | 0.993 | (0.982, 1.004) | 0.204 | 0.978 | (0.941, 1.017) | 0.273 | 0.967 | (0.924, 1.013) | 0.151 |
| Villani A. M. et al. Eq. 1 | 0.975 | (0.954, 0.997) | 0.023 | 1.052 | (1.004, 1.102) | 0.037 | 1.048 | (0.995, 1.103) | 0.077 |
| Eq. 2 | 0.954 | (0.921, 0.988) | 0.006 | 1.037 | (0.980, 1.097) | 0.209 | 1.030 | (0.964, 1.100) | 0.377 |
| CC | 0.952 | (0.930, 0.973) | <0.001 | 0.977 | (0.955, 0.999) | 0.044 | 0.973 | (0.948, 0.998) | 0.035 |
| MAC | 0.966 | (0.949, 0.983) | <0.001 | 0.982 | (0.966, 0.999) | 0.044 | 0.977 | (0.958, 0.997) | 0.023 |
ASMI, appendicular skeletal muscle mass index; CC, calf circumferences; CI, confidence interval; DEXA, dual‐energy X‐ray absorptiometry; eGFRcys, cystatin C‐based estimated glomerular filtration rate; HR, hazard ratio; log NT‐proBNP, logarithmic N‐terminal pro‐B‐type natriuretic peptide; LVEF, left ventricular ejection fraction; MAC, mid‐arm circumferences.
All hazard ratios are expressed as increments per 1.0% of the mean of ASMI, CC, and MAC. Prediction equations are the same as in Table 1 .
Model was adjusted for age, sex, LVEF, log NT‐proBNP, eGFRcys, and 10‐m gait speed.
Table 3.
Impact of ASMI and anthropometric measurement on prediction of all‐cause mortality in HF patients
| Models | C‐index | (95% CI) | P value | cNRI | (95% CI) | P value | IDI | (95% CI) | P value | |
|---|---|---|---|---|---|---|---|---|---|---|
| Model (reference) | 0.762 | (0.701, 0.815) | ||||||||
| + DEXA‐measured value | 0.780 | (0.720, 0.829) | 0.104 | 0.343 | (0.106, 0.580) | 0.005 | 0.017 | (0.003, 0.031) | 0.014 | |
| + Katano et al. | 0.776 | (0.718, 0.825) | 0.225 | 0.338 | (0.103, 0.572) | 0.005 | 0.020 | (0.004, 0.035) | 0.013 | |
| + Wen X. et al. | 0.769 | (0.710, 0.819) | 0.444 | 0.211 | (−0.031, 0.452) | 0.087 | 0.010 | (−0.001, 0.022) | 0.076 | |
| + Kulkarni B. et al. | 0.769 | (0.710, 0.819) | 0.390 | 0.173 | (−0.066, 0.413) | 0.157 | 0.008 | (−0.002, 0.019) | 0.109 | |
| + Visvanathan R. et al. | 0.765 | (0.705, 0.816) | 0.649 | 0.084 | (−0.158, 0.326) | 0.506 | 0.003 | (−0.003, 0.010) | 0.292 | |
| + Villani A. M. et al. Eq. 1 | 0.765 | (0.703, 0.817) | 0.682 | −0.021 | (−0.260, 0.219) | 0.876 | 0.006 | (−0.001, 0.014) | 0.092 | |
| + | Eq. 2 | 0.764 | (0.702, 0.817) | 0.653 | 0.196 | (−0.043, 0.436) | 0.108 | 0.004 | (−0.001, 0.008) | 0.110 |
| + CC | 0.776 | (0.718, 0.825) | 0.202 | 0.228 | (−0.017, 0.473) | 0.068 | 0.013 | (−0.0001, 0.026) | 0.057 | |
| + MAC | 0.767 | (0.708, 0.818) | 0.522 | −0.005 | (−0.249, 0.240) | 0.972 | 0.007 | (−0.003, 0.017) | 0.170 | |
ASMI, appendicular skeletal muscle mass index; CC, calf circumference; CI, confidence interval; cNRI, continuous net reclassification improvement; DEXA, dual‐energy X‐ray absorptiometry; eGFRcys, cystatin C‐based estimated glomerular filtration rate; IDI, integrated discrimination improvement; log NT‐proBNP, logarithmic N‐terminal pro‐B‐type natriuretic peptide; LVEF, left ventricular ejection fraction; MAC, mid‐arm circumference.
Model included age, sex, LVEF, log NT‐proBNP, eGFRcys, and 10‐m gait speed. Prediction equations are the same as in Table 1 .
Discussion
Although prediction of mortality in HF patients is crucial for decision making regarding HF therapies, it has been shown to be difficult, especially in elderly patients because many elderly patients have multiple co‐morbidities. 13 , 14 Because sarcopenia, a condition characterized by reduction in muscle mass and function, is a convergence point in the progression of multiple geriatric syndromes including cancers, chronic kidney disease, metabolic diseases, cognitive impairment, and cardiovascular diseases including HF, 15 a close association of DEXA‐measured ASMI measured during hospitalization with the occurrence of all‐cause death after discharge in HF patients in the present study is not a surprising finding. Importantly, predicted ASMI calculated from sex, body weight, CC, and MAC together with DEXA‐measured ASMI was an independent predictor for all‐cause death after adjustment with age, sex, LVEF, NT‐proBNP, renal function, and an index of physical function. The sensitivity of predicted ASMI for predicting all‐cause death was similar to that of DEXA‐measured ASMI, though there was a significant difference in the specificity. Therefore, prediction of ASMI by anthropometric parameters is a useful screening method for detecting HF patients with worse clinical outcome.
There are several limitations in the present study. Several attempts to develop equations for estimating ASM from anthropometric parameters were made in previous studies including a non‐HF population. 16 , 17 , 18 , 19 However, results of our previous studies showed that the application of any of these equations to our cohort for the diagnosis of sarcopenia was unsuccessful. 8 This was the case in predicting all‐cause death: ASMI calculated by using previously developed equations had no additive impact in predicting all‐cause death (Tables 2 and 3 ). Conversely, our equation for ASMI estimation will not necessarily be applicable to other races with and without HF because there is race/disease‐dependent variation in body composition. In addition, it should be noted that the proportion of ischaemic heart diseases, the most frequent cause of HF in the Western countries, was small in the present study. Thus, an equation to estimate ASMI by the use of anthropometric parameters should be optimized in each cohort and population.
Conclusions
Anthropometric parameters‐derived ASMI, as well as DEXA‐measured ASMI, predicts all‐cause death in HF patients, and anthropometric parameters‐derived ASMI will be useful for detecting high‐risk patients in a daily clinical setting and in large population‐based studies.
Conflict of interest
None declared.
Supporting information
Data S1. Supporting Information.
Figure S1. Prognostic predictive performance of low ASMI values.
Table S1. Etiology of heart failure.
Acknowledgement
This study was supported by Grants 18K17677 and 22K11288 (Katano S) from the Japan Society for the Promotion of Science.
Katano, S. , Honma, S. , Nagaoka, R. , Numazawa, R. , Yamano, K. , Fujisawa, Y. , Ohori, K. , Kouzu, H. , Hashimoto, A. , Katayose, M. , and Yano, T. (2022) Anthropometric parameters‐derived estimation of muscle mass predicts all‐cause mortality in heart failure patients. ESC Heart Failure, 9: 4358–4365. 10.1002/ehf2.14121.
References
- 1. Buckinx F, Landi F, Cesari M, Fielding RA, Visser M, Engelke K, Maggi S, Dennison E, al‐Daghri NM, Allepaerts S, Bauer J, Bautmans I, Brandi ML, Bruyère O, Cederholm T, Cerreta F, Cherubini A, Cooper C, Cruz‐Jentoft A, McCloskey E, Dawson‐Hughes B, Kaufman JM, Laslop A, Petermans J, Reginster JY, Rizzoli R, Robinson S, Rolland Y, Rueda R, Vellas B, Kanis JA. Pitfalls in the measurement of muscle mass: A need for a reference standard. J Cachexia Sarcopenia Muscle. 2018; 9: 269–278. [DOI] [PMC free article] [PubMed] [Google Scholar]
- 2. von Haehling S, Garfias Macedo T, Valentova M, Anker MS, Ebner N, Bekfani T, Haarmann H, Schefold JC, Lainscak M, Cleland JGF, Doehner W, Hasenfuss G, Anker SD. Muscle wasting as an independent predictor of survival in patients with chronic heart failure. J Cachexia Sarcopenia Muscle. 2020; 11: 1242–1249. [DOI] [PMC free article] [PubMed] [Google Scholar]
- 3. Konishi M, Akiyama E, Matsuzawa Y, Sato R, Kikuchi S, Nakahashi H, Maejima N, Iwahashi N, Kosuge M, Ebina T, Hibi K, Misumi T, Haehling S, Anker SD, Tamura K, Kimura K. Prognostic impact of muscle and fat mass in patients with heart failure. J Cachexia Sarcopenia Muscle. 2021; 12: 568–576. [DOI] [PMC free article] [PubMed] [Google Scholar]
- 4. Konishi M, Kagiyama N, Kamiya K, Saito H, Saito K, Ogasahara Y, Maekawa E, Misumi T, Kitai T, Iwata K, Jujo K, Wada H, Kasai T, Nagamatsu H, Ozawa T, Izawa K, Yamamoto S, Aizawa N, Makino A, Oka K, Momomura SI, Matsue Y. Impact of sarcopenia on prognosis in patients with heart failure with reduced and preserved ejection fraction. Eur J Prev Cardiol. 2021; 28: 1022–1029. [DOI] [PubMed] [Google Scholar]
- 5. Wijnhoven HA, van Bokhorst‐de van der Schueren M, Heymans MW, de Vet HC, Kruizenga HM, Twisk JW, Visser M. Low mid‐upper arm circumference, calf circumference, and body mass index and mortality in older persons. J Gerontol A Biol Sci Med Sci. 2010; 65: 1107–1114. [DOI] [PMC free article] [PubMed] [Google Scholar]
- 6. Ishida Y, Maeda K, Nonogaki T, Shimizu A, Yamanaka Y, Matsuyama R, Kato R, Mori N. Impact of edema on length of calf circumference in older adults. Geriatr Gerontol Int. 2019; 19: 993–998. [DOI] [PubMed] [Google Scholar]
- 7. Kamiya K, Masuda T, Matsue Y, Inomata T, Hamazaki N, Matsuzawa R, Tanaka S, Nozaki K, Maekawa E, Noda C, Yamaoka‐Tojo M, Matsunaga A, Izumi T, Ako J. Complementary role of arm circumference to body mass index in risk stratification in heart failure. JACC Heart Fail. 2016; 4: 265–273. [DOI] [PubMed] [Google Scholar]
- 8. Katano S, Yano T, Ohori K, Nagano N, Honma S, Shimomura K, Ishigo T, Watanabe A, Honma R, Fujito T, Koyama M, Kouzu H, Hashimoto A, Katayose M, Miura T. Novel prediction equation for appendicular skeletal muscle mass estimation in patients with heart failure: Potential application in daily clinical practice. Eur J Prev Cardiol. 2021; 28: e18–e21. [DOI] [PubMed] [Google Scholar]
- 9. Ponikowski P, Voors AA, Anker SD, Bueno H, Cleland JGF, Coats AJS, Falk V, González‐Juanatey JR, Harjola VP, Jankowska EA, Jessup M, Linde C, Nihoyannopoulos P, Parissis JT, Pieske B, Riley JP, Rosano GMC, Ruilope LM, Ruschitzka F, Rutten FH, van der Meer P, ESC Scientific Document Group . 2016 ESC guidelines for the diagnosis and treatment of acute and chronic heart failure: The task force for the diagnosis and treatment of acute and chronic heart failure of the European Society of Cardiology (ESC)developed with the special contribution of the heart failure association (HFA) of the ESC. Eur Heart J. 2016; 37: 2129–2200. [DOI] [PubMed] [Google Scholar]
- 10. Kouzu H, Katano S, Yano T, Ohori K, Nagaoka R, Inoue T, Takamura Y, Ishigo T, Watanabe A, Koyama M, Nagano N, Fujito T, Nishikawa R, Ohwada W, Miura T. Plasma amino acid profiling improves predictive accuracy of adverse events in patients with heart failure. ESC Heart Fail. 2021; 8: 5045–5056. [DOI] [PMC free article] [PubMed] [Google Scholar]
- 11. Chen LK, Liu LK, Woo J, Assantachai P, Auyeung TW, Bahyah KS, Chou MY, Chen LY, Hsu PS, Krairit O, Lee JSW, Lee WJ, Lee Y, Liang CK, Limpawattana P, Lin CS, Peng LN, Satake S, Suzuki T, Won CW, Wu CH, Wu SN, Zhang T, Zeng P, Akishita M, Arai H. Sarcopenia in Asia: Consensus report of the Asian Working Group for Sarcopenia. J Am Med Dir Assoc. 2014; 15: 95–101. [DOI] [PubMed] [Google Scholar]
- 12. Pencina MJ, D' Agostino RB, D' Agostino RB, Vasan RS. Evaluating the added predictive ability of a new marker: From area under the ROC curve to reclassification and beyond. Stat Med. 2008; 27: 157–172. [DOI] [PubMed] [Google Scholar]
- 13. Pilotto A, Addante F, Franceschi M, Leandro G, Rengo G, D'Ambrosio P, Longo MG, Rengo F, Pellegrini F, Dallapiccola B, Ferrucci L. Multidimensional prognostic index based on a comprehensive geriatric assessment predicts short‐term mortality in older patients with heart failure. Circ Heart Fail. 2010; 3: 14–20. [DOI] [PMC free article] [PubMed] [Google Scholar]
- 14. Katano S, Yano T, Ohori K, Kouzu H, Nagaoka R, Honma S, Shimomura K, Inoue T, Takamura Y, Ishigo T, Watanabe A, Koyama M, Nagano N, Fujito T, Nishikawa R, Ohwada W, Hashimoto A, Katayose M, Ishiai S, Miura T. Barthel index score predicts mortality in elderly heart failure ‐ A goal of comprehensive cardiac rehabilitation. Circ J. 2021; 86: 70–78. [DOI] [PubMed] [Google Scholar]
- 15. Bauer J, Morley JE, Schols AMWJ, Ferrucci L, Cruz‐Jentoft AJ, Dent E, Baracos VE, Crawford JA, Doehner W, Heymsfield SB, Jatoi A, Kalantar‐Zadeh K, Lainscak M, Landi F, Laviano A, Mancuso M, Muscaritoli M, Prado CM, Strasser F, Haehling S, Coats AJS, Anker SD. Sarcopenia: A time for action. An SCWD position paper. J Cachexia Sarcopenia Muscle. 2019; 10: 956–961. [DOI] [PMC free article] [PubMed] [Google Scholar]
- 16. Wen X, Wang M, Jiang CM, Zhang YM. Anthropometric equation for estimation of appendicular skeletal muscle mass in Chinese adults. Asia Pac J Clin Nutr. 2011; 20: 551–556. [PubMed] [Google Scholar]
- 17. Kulkarni B, Kuper H, Taylor A, Radhakrishna KV, Kinra S, Ben‐Shlomo Y, Smith GD, Ebrahim S, Byrne NM, Hills AP. Development and validation of anthropometric prediction equations for estimation of lean body mass and appendicular lean soft tissue in Indian men and women. J Appl Physiol (1985). 2013; 115: 1156–1162. [DOI] [PMC free article] [PubMed] [Google Scholar]
- 18. Visvanathan R, Yu S, Field J, Chapman I, Adams R, Wittert G, Visvanathan T. Appendicular skeletal muscle mass: Development and validation of anthropometric prediction equations. J Frailty Aging. 2012; 1: 147–151. [DOI] [PubMed] [Google Scholar]
- 19. Villani AM, Crotty M, Cameron ID, Kurrle SE, Skuza PP, Cleland LG, Cobiac L, Miller MD. Appendicular skeletal muscle in hospitalised hip‐fracture patients: Development and cross‐validation of anthropometric prediction equations against dual‐energy X‐ray absorptiometry. Age Ageing. 2014; 43: 857–862. [DOI] [PubMed] [Google Scholar]
Associated Data
This section collects any data citations, data availability statements, or supplementary materials included in this article.
Supplementary Materials
Data S1. Supporting Information.
Figure S1. Prognostic predictive performance of low ASMI values.
Table S1. Etiology of heart failure.