

Abstract
Aim
Heart failure (HF) is predominantly a disorder of the elderly. During the last decades, cardiovascular primary and secondary prevention and life expectancy have improved. Accordingly, trends in incidence and prevalence of HF are dynamic and may differ over time by age and gender. We aim to investigate the overall and age‐specific and sex‐specific trends, in incidence, prevalence, and the proportion with co‐morbidities of HF over a 10 year period in Region Västra Götaland, Sweden.
Methods and results
The VEGA database is an administrative database of all patients managed in hospital and/or in primary care (private and public) living in Region Västra Götaland. All patients with a main or contributory diagnosis of HF (I50) aged 18 years or older between 2008 and 2017 were included. Incidence and prevalence of HF were calculated based on the entire adult population of Region Västra Götaland. The adult population in Region Västra Götaland increased by 8% from 2008 (n = 1 234 609) to 2017 (n = 1 338 906). Half the population was female and 69% < 60 years of age, both constant over time. In total, 62 228 incident cases of HF were identified. In 2008, we identified 6464 cases, mean age 78.7 (11.5) years, and 49.8% (n = 3222) men, while in 2017, 5727 cases were identified, mean age 78.3 (11.8) years, and 52.5% (n = 3006) men. The overall yearly incidence rate of HF decreased by 3%, RR 0.97 (95% CI 0.96–0.97) per year, P < 0.0001, mainly driven by the age categories >75 years. A constantly higher incidence of HF was seen for men compared with women in all age categories, RR 1.46 (95% CI 1.44–1.49), P < 0.0001. During the same period, we observed a steady increase in overall prevalence from 1.8% for women and 2.0% for men in 2008, to 2.4% in women and 2.8% in men in 2017, particularly in those >85 years of age who had a prevalence of 16.5% (men) and 14.6% (women) in 2008 and 23.5% (men) and 21.5% (women) in 2017. The overall 1 year mortality rate was 22.7%. When adjusted for age, women had a lower risk for death by 13% compared with men [hazard ratio 0.87 (95% CI 0.84–0.90, P < 0.0001)].
Conclusion
We saw a decrease in overall incidence, but incidence of HF remains high, particularly in the oldest age groups. Prevalence of HF keeps increasing particularly in those aged >85 years. Our findings emphasize the need for implementation of effective preventive strategies for HF.
Keywords: Heart failure, Prevalence, Incidence, Mortality
Introduction
Heart failure (HF) is a major public health problem worldwide with prevalence estimated at 1–2% of the adult population in high‐income western countries. 1 , 2 It is primarily, but not exclusively, a disorder of the elderly, with prevalence increasing with higher age. 3 Sweden has a long‐standing tradition of registry‐based studies with an almost complete coverage of the population, minimizing selection bias. 4 Previous work from our group showed decreasing rates of hospitalizations in Sweden for HF in people >45 years, but an increasing prevalence of hospitalizations for HF in young patients aged 18–44. 5 The growing number of people living with obesity is thought to be an important contributing factor to the rising number of patients developing HF at a young age. 6 Although incidence seems to be decreasing among older age groups, the absolute number of people living with HF is expected to increase, because of increasing life expectancy 7 and gradually improved HF therapy. 8
HF imposes a significant economic burden on society, 9 mainly because HF patients often require in‐hospital care which constitutes the bulk of the cost for HF. 10 Changes in population characteristics will affect incidence as, for example, HF incidence increases with higher age. 1 Many previous studies, however, have looked exclusively at hospitalized patients with primary care cases not being considered because of lack of data in patients managed only in primary care. 5 , 8 , 11 Several studies have examined trends in HF incidence suggesting there might have been a decline since the mid‐1990s. 5 , 12 , 13 Previous work in this area mainly consists of cohorts from the 1990s and 2000s. 14 Zarrinkoub et al. performed a population‐based study from 2006 to 2010, which included patients from hospital as well as from primary care, and found an overall decline in incidence, but no major change in prevalence. 15 Epidemiological population‐based studies in more recent years are needed to confirm this and to assess current trends in incidence and prevalence including primary care. With the population growing older putting a strain on the health care system, it is of major importance for policy makers to have reliable and updated information to be able to make informed decisions when distributing resources. Accordingly, the aim of the present study was to investigate contemporary trends in HF incidence and prevalence of the entire population of Region Västra Götaland, including patients in both primary and hospital‐based care.
Method
Study design
This was a retrospective cohort study, using regional and national registries. Data were extracted from the VEGA database, which is a mandatory administrative database of all patients managed in Region Västra Götaland of Sweden. Region Västra Götaland is one of 21 Swedish regional councils that founds public health care. 16 The region holds one sixth of the Swedish population (approximately 1.7 million inhabitants 2020) and consists of both urban and rural areas. 17 The largest city of the region is Gothenburg with approximately 580 000 inhabitants. 18 The VEGA database contains information both on patients managed in hospital care, and on all patients managed in primary care, both public and private, living in the Region Västra Götaland. The VEGA database has information on primary and secondary diagnoses made by the treating physician and dates for time of diagnosis. 19 Data were available from 2006 to 2018. Furthermore, data about co‐morbidities and mortality were extracted from the National Patient Register (NPR) and the Cause of Death Register, respectively. Information about population size, age, and sex distribution was extracted from Statistics Sweden. Data were linked based on the unique personal identification number that each Swedish citizen is issued by the National Board of Health and Welfare. In addition, information on socioeconomic status was extracted through the longitudinal integrated database for health insurance and labour market studies (LISA registry) described more in detail below.
The study was approved by the regional Swedish National Authority for Ethical Approval and conforms to the principals of the declaration of Helsinki.
Study populations
Prevalent heart failure population
From the VEGA registry, we identified all patients aged 18 years or older with a diagnosis of HF in primary or contributory position. Data in the VEGA database were available from 2006, and the registry was screened as far back as data allowed. For patients treated only in primary care, this resulted in at least 2 years back‐log for patients registered in 2008 and up to 11 years for patients registered in 2017. During the inclusion years for the study, the International Classification of Diseases, 10th revision (ICD‐10) was used, and the register was screened for codes I50.0–I50.9. We analysed overall prevalence as well as age‐specific and sex‐specific prevalence.
Incident heart failure population
For the incident HF population, similarly to the prevalent population stated earlier, we identified all patients aged 18 years or older with a first diagnosis of HF in primary or contributory position from 2008 through 2017 in the VEGA registry database. The certainty of a first ever HF diagnosis differs slightly depending on year of inclusion since the time for back‐log was different depending on year of inclusion. Data from primary care were available from 2006 and for hospitalized patients from 1997. For hospital outpatient visits, information was available from 2001 and onwards. We were able to ascertain that there had been no prior hospitalization for HF during the preceding decade and estimated 2 years to be a reasonable lower time limit to be sufficiently certain of first ever HF diagnosis as was the case for patients treated exclusively in primary care. For this population, we analysed incidence, both overall and age‐specific and sex‐specific incidence. We also did a more thorough analysis regarding co‐morbidities, mortality, and type of care.
Study periods
We collected data about incidence and prevalence and various baseline variables described below between 2008 and 2017. For comparison, the study period was split into two 5 year periods, 2008 to 2012 vs. 2013 to 2017.
Study variables
Incident and prevalent numbers of patients from 2008 through 2017 were described overall by sex, and by age categories (<65, 65–74, 75–84, and ≥85 years). We selected 24 different conditions and interventions to depict the burden of incident disease. They included hypertension, diabetes mellitus, myocardial infarction, angina pectoris, percutaneous coronary intervention, coronary by‐pass graft surgery, peripheral artery disease, atrial fibrillation/flutter, stroke/transient ischaemic attack including intra cranial bleed, any severe bleed other than intracranial bleed, anaemia, aortic stenosis, aortic valve surgery, pacemaker of any kind, renal failure, liver disease, lung disease, chronic obstructive pulmonary disease, sleep apnoea, gout, alcoholism, musculoskeletal or connective tissue disease, malignant disease, and mental disorders. For ICD‐10 codes, see Supporting Information, Table S1 . The number of any co‐morbidities, cardiovascular (CV) related, and non‐CV related co‐morbidities was calculated for all patients (see Supporting Information, Table S1 for categorization). The screening for co‐morbidities was carried out according to ICD‐10 and reached back to 1997.
Socio‐economic status was included as information on marital status, income, and education. Marital status was categorized into married, unmarried, divorced, and widowed. Level of education was divided into primary (<10 years), secondary (10–12 years), and post‐secondary education (>12 years). Total income was adjusted for consumer price index of each year and described in quartiles.
Study outcome
One year all‐cause mortality was the outcome studied for the incident HF population. The patients were followed from the HF incidence date until death within 1 year, or they were censored at 365 days after the HF incidence date. Data from the VEGA‐register were available until the end of 2018 ensuring 1 year follow‐up for all included patients.
Statistical analysis
Descriptively, for continuous variables mean, standard deviation (SD), median and range, or median and interquartile range (IQR) were presented, as appropriate. For categorical variables, number and percentage were given.
For test of differences regarding patient characteristics between the study periods 2008–2012 and 2013–2017 in the incident HF population, Fisher's exact test was used for dichotomous variables, Mantel–Haenszel χ 2 trend test for ordered categorical variables, χ 2 test for non‐ordered categorical variables and Mann–Whitney U‐test for continuous variables.
The age‐specific and sex‐specific incidence rates per 100 person years per calendar year were obtained using Poisson regression. The percentage of prevalent HF patients was described per age category, sex, and year. Test for trend over calendar years, as well as yearly and age‐adjusted difference between men and women in incidence rates was performed using binomial regression presenting relative risk (RR) with 95% CI for yearly, and by age category differences.
Age‐adjusted and sex‐adjusted Cox regression analyses were used when separately studying associations between different patient characteristics and time to all‐cause mortality during first year from incident HF for the two time periods 2008–2012 and 2013–2017. The results were described by hazard ratios (HR) and 95% confidence intervals (CI). The difference in HRs between the two time periods was evaluated through interaction analysis, including variable of interest, time period, and the interaction variable × time period in the model. All tests were two‐tailed. P‐values were interpreted following an application of Bonferroni–Holm adjustment for multiple comparisons, for a total significance mass of 0.05. All analyses were performed using SAS software version 9.4 (SAS Institute Inc., Cary, NC, USA).
Results
The total adult population of Region Västra Götaland increased from 1 215 114 people in 2008 to 1 306 370 people in 2017. Approximately 70% of the population were aged below 60 years and 1% above 90 years of age, with age distribution constant over time. During all years from 2008 to 2017, the age distribution among women was skewed towards an older age compared with men.
Characteristics of patients with incident heart failure
A total number of 62 228 cases of incident HF were recorded over the entire time‐period years 2008 to 2017 (Table 1 ). Mean age was 78.6 (11.8) years and median age 81 (range 18–109) with women constituting 49.8% of incident HF cases. Most patients (53.3%) had primary education only (<10 years) while 13.2% had post‐secondary education (>12 years). Mean number of co‐morbidities was 5.02 (2.60), with non‐CV co‐morbidities making up slightly more than half with a mean number of 2.66 (1.80) per person. Among individual, co‐morbidities hypertension was the most common and was present in 72.4% of HF cases, and 58.4% of patients had musculoskeletal and connective tissue disease. Atrial fibrillation/flutter was present in 41.8% of patients. Other frequent co‐morbidities included diabetes mellitus, myocardial infarction, angina pectoris, stroke or transitory ischaemic attack, severe bleeding, lung disease, cancer, mental or behaviour disorder, and anaemia. Patients who had only attended primary care when first registered constituted 30.1% of HF patients, ranging from 25.7% in 2006–2007 to 32.4% in 2008–2009.
Table 1.
Descriptive data for incident HF patients in VEGA/NPR 2008–2017 by 5 year calendar periods
| Total (n = 62 228) | 2008–2012 (n = 33 676) | 2013–2017 (n = 28 552) | P‐value | |
|---|---|---|---|---|
| Age at HF onset (years) | 78.6 (11.8) | 78.8 (11.6) | 78.3 (12.0) | <0.0001 |
| 81 (16; 109) | 81 (18; 108) | 80 (16; 109) | ||
| n = 62 229 | n = 33 676 | n = 28 553 | ||
| Age category | ||||
| <65 years | 7410 (11.9%) | 3925 (11.7%) | 3485 (12.2%) | |
| 65–74 years | 11 500 (18.5%) | 5906 (17.5%) | 5594 (19.6%) | |
| 75–84 years | 21 349 (34.3%) | 11 795 (35.0%) | 9554 (33.5%) | |
| 85+ years | 21 969 (35.3%) | 12 050 (35.8%) | 9919 (34.7%) | <0.0001 |
| Sex | ||||
| Men | 31 216 (50.2%) | 16 577 (49.2%) | 14 639 (51.3%) | |
| Women | 31 012 (49.8%) | 17 099 (50.8%) | 13 913 (48.7%) | <0.0001 |
| Age category: Men | ||||
| <65 years | 4969 (15.9%) | 2589 (15.6%) | 2380 (16.3%) | |
| 65–74 years | 6952 (22.3%) | 3534 (21.3%) | 3418 (23.3%) | |
| 75–84 years | 10 858 (34.8%) | 5917 (35.7%) | 4941 (33.8%) | |
| 85+ years | 8437 (27.0%) | 4537 (27.4%) | 3900 (26.6%) | 0.0005 |
| Age category: Women | ||||
| <65 years | 2441 (7.9%) | 1336 (7.8%) | 1105 (7.9%) | |
| 65–74 years | 4548 (14.7%) | 2372 (13.9%) | 2176 (15.6%) | |
| 75–84 years | 10 491 (33.8%) | 5878 (34.4%) | 4613 (33.2%) | |
| 85 + years | 13 532 (43.6%) | 7513 (43.9%) | 6019 (43.3%) | 0.012 |
| Marital status | ||||
| Married | 24 360 (39.2%) | 13 099 (38.9%) | 11 261 (39.5%) | |
| Unmarried | 6978 (11.2%) | 3654 (10.9%) | 3324 (11.6%) | |
| Divorced | 9618 (15.5%) | 4895 (14.5%) | 4723 (16.5%) | |
| Widowed | 21 233 (34.1%) | 12 001 (35.7%) | 9232 (32.3%) | <0.0001 |
| Missing | 39 | 27 | 12 | |
| Education | ||||
| <10 years | 32 310 (53.3%) | 18 633 (57.0%) | 13 677 (49.0%) | |
| 10–12 years | 20 282 (33.5%) | 10 276 (31.5%) | 10 006 (35.9%) | |
| >12 years | 7980 (13.2%) | 3763 (11.5%) | 4217 (15.1%) | <0.0001 |
| Missing | 1656 | 1004 | 652 | |
| Number of co‐morbidities | 5.02 (2.60) | 4.63 (2.46) | 5.47 (2.68) | <0.0001 |
| 5 (0; 17) | 4 (0; 17) | 5 (0; 17) | ||
| n = 62 229 | n = 33 676 | n = 28 553 | ||
| Number of co‐morbidities (cat.) | ||||
| 0–2 co‐morbidities | 10 517 (16.9%) | 6827 (20.3%) | 3690 (12.9%) | |
| 3–5 co‐morbidities | 27 315 (43.9%) | 15 578 (46.3%) | 11 737 (41.1%) | |
| >5 co‐morbidities | 24 396 (39.2%) | 11 271 (33.5%) | 13 125 (46.0%) | <0.0001 |
| Number of CV co‐morbidities | 2.36 (1.63) | 2.24 (1.60) | 2.49 (1.67) | <0.0001 |
| 2 (0; 11) | 2 (0; 10) | 2 (0; 11) | ||
| n = 62 229 | n = 33 676 | n = 28 553 | ||
| Number of CV co‐morbidities (cat.) | ||||
| 0–2 co‐morbidities | 37 689 (60.6%) | 21 252 (63.1%) | 16 437 (57.6%) | |
| 3–5 co‐morbidities | 21 485 (34.5%) | 11 059 (32.8%) | 10 426 (36.5%) | |
| >5 co‐morbidities | 3055 (4.9%) | 1365 (4.1%) | 1690 (5.9%) | <0.0001 |
| Number of non‐CV co‐morbidities | 2.66 (1.80) | 2.39 (1.69) | 2.98 (1.86) | <0.0001 |
| 2 (0; 11) | 2 (0; 11) | 3 (0; 11) | ||
| n = 62 228 | n = 33 676 | n = 28 553 | ||
| 0–2 co‐morbidities | 31 797 (51.1%) | 19 222 (57.1%) | 12 575 (44.0%) | |
| 3–5 co‐morbidities | 25 982 (41.8%) | 12 823 (38.1%) | 13 159 (46.1%) | |
| >5 co‐morbidities | 4449 (7.1%) | 1631 (4.8%) | 2818 (9.9%) | <0.0001 |
| Hypertension | 45 025 (72.4%) | 22 978 (68.2%) | 22 047 (77.2%) | <0.0001 |
| Diabetes mellitus | 14 650 (23.5%) | 7580 (22.5%) | 7070 (24.8%) | <0.0001 |
| Myocardial infarction | 15 754 (25.3%) | 8406 (25.0%) | 7348 (25.7%) | 0.028 |
| Angina | 14 975 (24.1%) | 8316 (24.7%) | 6659 (23.3%) | <0.0001 |
| Percutaneous coronary intervention | 6722 (10.8%) | 3113 (9.2%) | 3609 (12.6%) | <0.0001 |
| Coronary artery bypass graft | 7922 (12.7%) | 3955 (11.7%) | 3967 (13.9%) | <0.0001 |
| Peripheral vascular disease | 6603 (10.6%) | 3303 (9.8%) | 3300 (11.6%) | <0.0001 |
| Atrial fibrillation/flutter | 25 990 (41.8%) | 13 232 (39.3%) | 12 758 (44.7%) | <0.0001 |
| Stroke or transient ischaemic attack including intracranial bleed | 13 689 (22.0%) | 7208 (21.4%) | 6481 (22.7%) | 0.0001 |
| Any severe bleed except intracranial | 15 069 (24.2%) | 7356 (21.8%) | 7713 (27.0%) | <0.0001 |
| Anaemia | 15 352 (24.7%) | 7121 (21.1%) | 8231 (28.8%) | <0.0001 |
| Aortic stenosis | 4473 (7.2%) | 2169 (6.4%) | 2304 (8.1%) | <0.0001 |
| Aortic valve surgery | 985 (1.6%) | 465 (1.4%) | 520 (1.8%) | <0.0001 |
| Pacemaker (of any kind) | 4493 (7.2%) | 2303 (6.8%) | 2190 (7.7%) | <0.0001 |
| Renal failure | 4802 (7.7%) | 2149 (6.4%) | 2653 (9.3%) | <0.0001 |
| Liver disease | 1242 (2.0%) | 572 (1.7%) | 670 (2.3%) | <0.0001 |
| Lung disease | 17 474 (28.1%) | 8617 (25.6%) | 8857 (31.0%) | <0.0001 |
| COPD/bronchitis | 13 500 (21.7%) | 6775 (20.1%) | 6725 (23.6%) | <0.0001 |
| Sleep apnoea | 2464 (4.0%) | 1035 (3.1%) | 1429 (5.0%) | <0.0001 |
| Alcoholism | 2590 (4.2%) | 1157 (3.4%) | 1433 (5.0%) | <0.0001 |
| Gout | 4507 (7.2%) | 1906 (5.7%) | 2601 (9.1%) | <0.0001 |
| Musculoskeletal or connective tissue disorder (last 3 years) | 36 335 (58.4%) | 18 251 (54.2%) | 18 084 (63.3%) | <0.0001 |
| Malignant cancer (last 3 years) | 14 458 (23.2%) | 7007 (20.8%) | 7451 (26.1%) | <0.0001 |
| Mental or behavioural disorder (last 3 years) | 23 075 (37.1%) | 10 978 (32.6%) | 12 097 (42.4%) | <0.0001 |
For categorical variables n (%) is presented.
For continuous variables mean (SD)/Median (Min; Max)/n = is presented.
For comparison between groups, Fisher's exact test (lowest one‐sided P‐value multiplied by 2) was used for dichotomous variables, the Mantel–Haenszel χ 2 test was used for ordered categorical variables, χ 2 test was used for non‐ordered categorical variables, and the Mann–Whitney U‐test was used for continuous variables.
There was a very small but statistically significant difference in age at onset between the two time periods studied, 78.8 years (2008–2012) vs. 78.3 years (2013–2017). Women constituted 50.8% of HF patients in 2008–2012 and 48.7% of HF‐patients in 2013–2017. In the time‐period 2008–2012, 57.0% had education <10 years; in 2013–2017, this number had decreased to 49.0%, reflecting the increasing availability of education during the last century. HF patients in the time‐period 2008–2012 had less co‐morbidities compared with HF patients in 2013–2017. All individual co‐morbidities increased over time in the patients except for angina pectoris that decreased slightly (Table 1 ).
Prevalence
Overall prevalence of heart failure was 1.8% for women and 2.0% for men in 2008, increasing to 2.4% in women and 2.8% in men in 2017, and constantly higher for men than women in all age groups. Among those ≥85 years of age almost one in four (23.5% and 21.5%, respectively for men and women) were living with a HF diagnosis in 2017 (Figure 1 ). Prevalence increased significantly over time in those over age 75. The trend for overall prevalence increased between 2008 and 2014 to 2015 depending on age group and thereafter levelling off to a rather stable level between 2014 to 2015 and 2017. In women, 75–84 years of age prevalence increased from 8.1% in 2008 to 9.5% in 2017 and in men in the same age group prevalence increased from 11.4% to 12.7%.
Figure 1.

Prevalence of HF 2008–2017 presented by age and sex categories.
Incidence
In total, there were 62 228 individuals with registered incident HF between years 2008 and 2017. Overall yearly incidence of HF was between 0.4% and 0.6% with a decrease of 3% per year assuming linear trend, RR 0.97 per year (95% CI 0.96–0.97), P < 0.0001. The incidence was higher in men than in women, age and calendar years adjusted RR 1.46 (95% CI 1.44–1.49), P < 0.0001. The age‐adjusted RRs for men vs. women ranged between 1.39 and 1.52 for different calendar years. Absolute incidence increased dramatically with higher age, reaching 7.0 and 5.7 per 100 person years among men and women ≥85 years of age (Figure 2 ). Regarding the relative difference between men and women for different age categories the RR adjusted for calendar year decreased with higher age category; for age <65 years, RR 2.02 (95% CI 1.93–2.12), P < 0.0001; for age ≥85 years, RR 1.31 (95% CI 1.27–1.34), P < 0.0001 (Figure 3 ).
Figure 2.
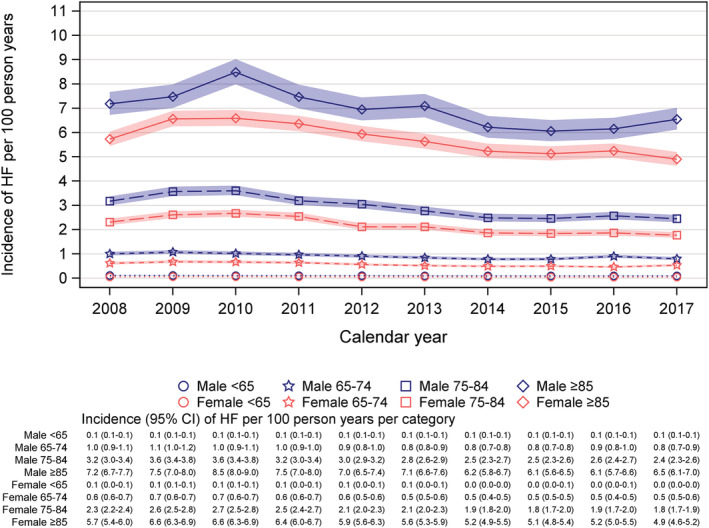
Incidence of HF 2008–2017 presented by age and sex categories.
Figure 3.

Risk ratio for men versus women with respect to incidence of HF 2008–2017, adjusted for calendar years and distribution of age over calendar years.
For all age groups, <65 years (RR 0.98 [95% CI 0.97–0.99], P < 0.0001), 65–74 years (RR 0.96 [95% CI 0.95–0.97], P < 0.0001), 75–84 years (RR 0.96 [95% CI 0.96–0.96], P < 0.0001), and ≥85 years (RR 0.97 [95% CI 0.97–0.97], P < 0.0001), incidence decreased significantly between 2008 and 2017 assuming linear relation over the calendar years, and this was the case for both sexes. There was initial numerical increase in older age groups, between 2008 and 2010 RR 1.05 (95% CI 1.04–1.07), P < 0.0001, with subsequently decreasing incidence rates between 2011 and 2017 RR 0.96 (95% CI 0.95–0.96), P < 0.0001.
Mortality in incident heart failure population
The overall 1 year mortality rate was 22.7% (14 121 out of 62 228). When stratified by age, the mortality rate was higher for patients above the median age of 81 years. 1 year mortality rate in this group was 32.6%, whereas among patients below or equal to 81 the 1 year mortality rate was 13.7%. Women had lower age‐adjusted mortality risk compared with men, hazard ratio 0.87 (0.84–0.90 P < 0.0001). Belonging to one of the higher income groups (quartile 2–4) compared with the lowest income group (quartile 1) was associated with lower mortality rate in the first period (2008–2012) (Figure 4 ). Patients with a greater number of co‐morbidities had a higher risk of death within 1 year compared with patients with a lower number of co‐morbidities; for example, patients with >5 co‐morbidities had a hazard ratio of 1.63 (1.55–1.72; P < 0.0001) compared with patients with 0–2 co‐morbidities. Hypertension was associated with a lower risk for death compared with no hypertension. Diabetes mellitus, myocardial infarction, and peripheral vascular disease were associated with a greater risk for death compared with not having these co‐morbidities. In contrast, having undergone percutaneous coronary intervention or coronary‐bypass graft surgery was associated with a lower risk for 1 year mortality compared with patients who had not had these interventions (Figure 4 ). These presented results remained significant after Bonferroni–Holm correction for multiple testing.
Figure 4.

Age‐adjusted and sex‐adjusted HR for 1 year all‐cause mortality in different time periods, including interaction analysis between time‐period and studied variable.
An interaction analysis for various variables and their impact on death during first year post‐HF incidence over time was carried out. We compared incident HF cases between 2008–2012 and 2013–2017. Having had percutaneous coronary intervention was a protective factor for risk of 1 year mortality, but significantly less so in 2013–2017 (HR 0.82, 95% CI 0.75–0.89) compared with incident HF cases in 2008–2012 (HR 0.69, 95% CI 0.62–0.76) (P for interaction 0.0079), the same was true for patients who had coronary‐bypass graft surgery, with a significant interaction between intervention and period (P = 0.0006). Renal failure, liver disease, and peripheral vascular disease were associated with a markedly higher risk of death compared with patients not having these conditions. Over time, however, the impact of these co‐morbidities on death decreased slightly but the difference was statistically significant (Figure 4 ). Being unmarried was associated with a higher risk of death compared with being married, and this risk seemed to be of greater importance in 2013–2017 compared with 2008–2012 (P for interaction 0.0063). However, after performing Bonferroni–Holm correction for multiple testing on the interaction analysis atrial fibrillation/flutter and coronary artery bypass graft surgery were significant (P = 0.0011 and P = 0.0006, respectively).
Discussion
This population‐based study of HF in Region Västra Götaland, Sweden, with complete coverage of the population, including all diagnosed cases of HF in hospital and primary care provides an updated insight into the burden of HF and changes over the last decades. The main result of our study was an overall slight decrease in incidence over time, with an initial increasing incidence peaking in 2010, and thereafter a decrease by 4% per year, mostly driven by changes in the older age groups. Overall prevalence increased until 2014 and then evened out to a plateau. The increasing trend between 2008 and 2010 could be due to natural variations but also in part due to better reporting of diagnoses in the VEGA registry. In 2009, policy changes made it economically favourable with meticulous reporting of diagnoses to the administrative systems, and an increase in reporting was seen because of this.
Our cohort is extracted from an administrative database and does not allow for a distinction between different subtypes of HF such as heart failure with preserved ejection fraction (HFpEF) and heart failure with reduced ejection fraction (HFrEF). Changes in the treatment and incidence of different co‐morbidities will likely affect the incidence of different subtypes of HF to different extent, and the overall change in incidence of HF will be the result of the net impact of various factors.
Previous population‐based studies showed a slight decrease in overall incidence, a trend that we could confirm in our more recent material. 15 , 20 Compared with the study by Zarrinkoub et al., our overall incidence numbers are slightly higher. The Zarrinkoub study included the entire population of their catchment area including children (age <18) whereas we included only the adult part of the population, which could explain differences in overall incidence. 15 Also, the population of our catchment area is more representative of the entire Swedish population, with a mix of urban and rural areas, whereas the Zarrinkoub study predominantly included people living in a large city. 15 A large British study described an overall decrease in incidence of 7% between 2002 and 2014; however, this decrease was not seen in the very old (>85 years). 20 In an earlier, nationwide study from Sweden describing incidence in hospitalized patients the same pattern was seen with a decrease in patients 55 to 84 years; however, patients >84 years were excluded. 5 This differed from our study where we observed the most marked decrease among patients over the age of 85. We believe that the major reason for the decrease in incidence observed in our study among the oldest part of the population is due to improved primary prevention regarding ischaemic heart disease and hypertension compared with earlier. The introduction of new techniques for intervention of aortic stenosis that imposes less risk during intervention makes it possible to intervene in a frailer part of the population and could also, but likely to a lesser extent, be a contributing factor to decreasing incidence of HF. 21
The most important risk factor for HF is myocardial infarction (AMI), and the risk for AMI has decreased substantially over the last decades and is likely part of the explanation for the drop in incidence of HF. 22 Similarly, previous work from our group showed a decreasing incidence of HF after AMI between 1993 and 2004. 23 Although prior AMI is primarily associated with the development of HFrEF, 30–60% of the HFpEF population have suffered an AMI; thus, it may be linked to the development of HF in the HFpEF population as well. 24 , 25
We demonstrated increasing prevalence of HF over the entire study period, particularly in people over 75 years with the highest prevalence in those ≥85 years of age. A previous study from our group showed increasing prevalence in the oldest part of the population, >84 years, a trend that continued in our more recent study until 2014–2015, then evened out to a plateau. 8 We did not observe the same decrease in prevalence among those 60–70 years of age as seen before. One possible explanation is that only hospitalized HF patients were included in the previous study, and referred to the time‐period 1990–2007, whereas our study was based on the entire population of Region Västra Götaland and included all HF cases both in hospital and primary care, and from the more recent time period 2008–2017. 8
With HF being primarily a disorder of the elderly, increasing overall prevalence was expected due to a shift in demographic composition with more people surviving to a higher age, a change that is expected to continue. 7 Better implementation of more effective medical treatment for HF evolving over the last decades could also be part of the explanation since it allows patients to live longer. 26 , 27 In part, this is contradicted by the fact that mortality rates did not change in any marked way between the two time periods 2008–2012 and 2013–2017. A new medication with an impact on death in HF was discovered during the last years, the angiotensin‐neprilysin inhibitor. 28 Results from the PARADIGM‐HF study, however, were released in 2014, and the substance was not used widely in the population during the years of our study, and therefore, a reduction in mortality rates might not be expected due to this specific drug during our study period.
Total number of co‐morbidities in HF patients increased between 2008 and 2017. Substantial increase in certain non‐cardiac co‐morbidities such as malignancies, mental disorders, alcoholism, and renal failure were seen over the years studied and paints a picture that HF patients are becoming more complex, making treatment more challenging for physicians, further increasing burden on the healthcare system. A similar picture was seen in the British study referred to earlier. 20 Among cardiac co‐morbidities, atrial fibrillation increased from 39.3% to 44.7%. A large study regarding the possible positive effects of screening for atrial fibrillation in an attempt for better stroke prevention have been published during this period. 29 This might be a contributing factor if it has motivated physicians to be more active in their search for this condition among patients. An ageing population can also be part of the explanation, as prevalence of atrial fibrillation increases with higher age. 30
Some of the more important impact‐factors on all‐cause death 1 year after incident HF diagnosis changed between the different time periods. For example, percutaneous coronary intervention and coronary by‐pass graft surgery were protective factors but to a lesser extent in the later time‐period. This could likely be explained by a tendency towards more interventions in an older and more co‐morbid population in later years. A medical history of myocardial infarction (MI) was associated with higher mortality rates compared with patients without MI, well in line with previous data supporting that HF of ischaemic origin has a worse prognosis than HF of other origins. 31
Strengths and limitations
One major strength of our study is the design including the entire population in our region, through mandatory registries, providing a comprehensive overview of an entire region of Sweden. We included the HF diagnosis from primary care facilities as well as hospitals making our study one of relatively few where all cases of HF were included and not only hospital cases. Also, the catchment area of our study consists of both urban and rural areas, making it representative for the Swedish population.
There are also some limitations. Data about diagnosis are entirely taken from administrative registries, and therefore, we rely on the treating physician to have made a correct judgement about the diagnosis. The validity of HF diagnoses at the Sahlgrenska University Hospital reported to the National Patient registry has been investigated, 32 with only 6% of cases reported as miscoded, supporting an older validation study. 33 However, although validity of the HF diagnosis has proven to be high in Swedish medical records, this validity has only been tested in hospital settings and less is known about the validity of the HF diagnosis in primary care. 30 Because the VEGA register started in 2006, our run‐in period for patients that have only been treated in primary care was only 2 years, which could have overestimated incident cases slightly if there was a previous HF diagnosis before 2006, a risk we judged as small and not likely to have had a relevant impact on our results.
Conclusion
By access to VEGA database covering the entire population in our region and linked with other national quality registers, we observed a slightly decreasing overall incidence of HF after 2010, driven by changes in the population older than 70 years. Overall prevalence of HF for the same period, however, increased in the beginning of the time‐period to even out to a plateau from 2014 to 2015. We observed a significant variation regarding both incidence and prevalence in different age and gender subgroups. In addition, we noticed an increase in co‐morbidities over time in the HF population.
Funding
This work was supported by the Swedish Heart Lung Foundation (Hjärt‐Lungfonden) [2017‐0453 (M.F.) and 2021‐0345 (A.R.)] and by grants from the Swedish state under the agreement between the Swedish government and the county councils, the ALF agreement [ALFGBG‐721961 (M.F.) and ALFGBG‐966211 (A.R.)] and the Swedish Research Council [2018‐02527 and VRREG 2019‐00193 (A.R.)].
Conflict of interest
Maria Wideqvist reports unrelated very modest consulting fees from Bayer and Boeringer Ingelheim. No other conflict of interest, or relationship with the industry, was declared. Annika Rosengren has no conflict of interest. Maria Schaufelberger reports unrelated modest consulting fee from Bayer, Boeringer Ingelheim, Novartis, and AstraZeneca. No other conflict of interest, or relationship with the industry, was declared. Aldina Pivodic has no conflict of interest. Michael Fu reports unrelated modest consulting fee from Novartis, Boeringer Ingelheim, Vifor Pharma, and AstraZeneca. No other conflict of interest, or relationship with the industry, was declared.
Supporting information
Table S1. Supporting Information.
Wideqvist, M. , Rosengren, A. , Schaufelberger, M. , Pivodic, A. , and Fu, M. (2022) Ten year age‐ and sex‐specific temporal trends in incidence and prevalence of heart failure in Västra Götaland, Sweden. ESC Heart Failure, 9: 3931–3941. 10.1002/ehf2.14103.
References
- 1. Bleumink GS, Knetsch AM, Sturkenboom MC, Straus SM, Hofman A, Deckers JW, Witteman JC, Stricker BH. Quantifying the heart failure epidemic: Prevalence, incidence rate, lifetime risk and prognosis of heart failure the Rotterdam study. Eur Heart J. 2004; 25: 1614–1619. [DOI] [PubMed] [Google Scholar]
- 2. Mosterd A, Hoes AW. Clinical epidemiology of heart failure. Heart. 2007; 93: 1137–1146. [DOI] [PMC free article] [PubMed] [Google Scholar]
- 3. Ceia F, Fonseca C, Mota T, Morais H, Matias F, de Sousa A, Oliveira A, EPICA Investigators . Prevalence of chronic heart failure in southwestern Europe: The EPICA study. Eur J Heart Fail. 2002; 4: 531–539. [DOI] [PubMed] [Google Scholar]
- 4. Ludvigsson JF, Andersson E, Ekbom A, Feychting M, Kim JL, Reuterwall C, Heurgren M, Olausson PO. External review and validation of the Swedish national inpatient register. BMC Public Health. 2011; 11: 450. [DOI] [PMC free article] [PubMed] [Google Scholar]
- 5. Barasa A, Schaufelberger M, Lappas G, Swedberg K, Dellborg M, Rosengren A. Heart failure in young adults: 20‐year trends in hospitalization, aetiology, and case fatality in Sweden. Eur Heart J. 2014; 35: 25–32. [DOI] [PMC free article] [PubMed] [Google Scholar]
- 6. Rosengren A, Aberg M, Robertson J, Waern M, Schaufelberger M, Kuhn G, Åberg D, Schiöler L, Torén K. Body weight in adolescence and long‐term risk of early heart failure in adulthood among men in Sweden. Eur Heart J. 2017; 38: 1926–1933. [DOI] [PMC free article] [PubMed] [Google Scholar]
- 7. Sweden S. In Sweden S., ed. The future population of Sweden 2018–2070; 2018. [Google Scholar]
- 8. Paren P, Schaufelberger M, Bjorck L, Lappas G, Fu M, Rosengren A. Trends in prevalence from 1990 to 2007 of patients hospitalized with heart failure in Sweden. Eur J Heart Fail. 2014; 16: 737–742. [DOI] [PubMed] [Google Scholar]
- 9. Berry C, Murdoch DR, McMurray JJ. Economics of chronic heart failure. Eur J Heart Fail. 2001; 3: 283–291. [DOI] [PubMed] [Google Scholar]
- 10. Agvall B, Borgquist L, Foldevi M, Dahlstrom U. Cost of heart failure in Swedish primary healthcare. Scand J Prim Health Care. 2005; 23: 227–232. [DOI] [PubMed] [Google Scholar]
- 11. McAllister DA, Read SH, Kerssens J, Livingstone S, McGurnaghan S, Jhund P, Petrie J, Sattar N, Fischbacher C, Kristensen SL, McMurray J, Colhoun HM, Wild SH. Incidence of hospitalization for heart failure and case‐fatality among 3.25 million people with and without diabetes mellitus. Circulation. 2018; 138: 2774–2786. [DOI] [PMC free article] [PubMed] [Google Scholar]
- 12. Levy D. Long‐term trends in the incidence and survival with heart failure. N Engl J Med. 2002; 347: 1397–1402. [DOI] [PubMed] [Google Scholar]
- 13. Teng TH, Finn J, Hobbs M, Hung J. Heart failure: Incidence, case fatality, and hospitalization rates in Western Australia between 1990 and 2005. Circ Heart Fail. 2010; 3: 236–243. [DOI] [PubMed] [Google Scholar]
- 14. Roger VL, Weston SA, Redfield MM, Hellermann‐Homan JP, Killian J, Yawn BP, Jacobsen SJ. Trends in heart failure incidence and survival in a community‐based population. JAMA. 2004; 292: 344–350. [DOI] [PubMed] [Google Scholar]
- 15. Zarrinkoub R, Wettermark B, Wandell P, Mejhert M, Szulkin R, Ljunggren G, Kahan T. The epidemiology of heart failure, based on data for 2.1 million inhabitants in Sweden. Eur J Heart Fail. 2013; 15: 995–1,002. [DOI] [PubMed] [Google Scholar]
- 16. “Swedish Institute” . 2020. Available from: https://sweden.se/society/health‐care‐in‐sweden/. Accessed 04 May 2020.
- 17. “Statistics Sweden” . 2020. Available from: https://www.statistikdatabasen.scb.se/pxweb/sv/ssd/START__BE__BE0101__BE0101D/MedelfolkFodelsear/table/tableViewLayout1/. Accessed 04 May 2020.
- 18. “Goteborg stad” . 2021. Avaliable from: https://goteborg.se/wps/portal/start/kommun‐o‐politik/kommunfakta/kort‐kommunfakta?uri=gbglnk%3Agbg.page.28413487‐4f02‐44b5‐ace7‐c661ee58892c. Accessed 12 Apr 2021.
- 19. “VGR Varddatabas”. 2020. VGR. Available from: https://www.vgregion.se/om‐vgr/statistik‐analys/. Accessed 04 May 2020. [Google Scholar]
- 20. Conrad N, Judge A, Tran J, Mohseni H, Hedgecott D, Crespillo AP, Allison M, Hemingway H, Cleland JG, McMurray JJV, Rahimi K. Temporal trends and patterns in heart failure incidence: A population‐based study of 4 million individuals. Lancet (London, England). 2018; 391: 572–580. [DOI] [PMC free article] [PubMed] [Google Scholar]
- 21. Leon MB, Smith CR, Mack M, Miller DC, Moses JW, Svensson LG, Tuzcu EM, Webb JG, Fontana GP, Makkar RR, Brown DL, Block PC, Guyton RA, Pichard AD, Bavaria JE, Herrmann HC, Douglas PS, Petersen JL, Akin JJ, Anderson WN, Wang D, Pocock S, PARTNER Trial Investigators . Transcatheter aortic‐valve implantation for aortic stenosis in patients who cannot undergo surgery. N Engl J Med. 2010; 363: 1597–1607. [DOI] [PubMed] [Google Scholar]
- 22. Smolina K, Wright FL, Rayner M, Goldacre MJ. Determinants of the decline in mortality from acute myocardial infarction in England between 2002 and 2010: Linked national database study. BMJ (Clinical Research Ed). 2012; 344: d8059. [DOI] [PMC free article] [PubMed] [Google Scholar]
- 23. Shafazand M, Rosengren A, Lappas G, Swedberg K, Schaufelberger M. Decreasing trends in the incidence of heart failure after acute myocardial infarction from 1993–2004: A study of 175,216 patients with a first acute myocardial infarction in Sweden. Eur J Heart Fail. 2011; 13: 135–141. [DOI] [PubMed] [Google Scholar]
- 24. Lam CS, Donald E, Kraigher‐Krainer E, Vasan RS. Epidemiology and clinical course of heart failure with preserved ejection fraction. Eur J Heart Fail. 2011; 13: 18–28. [DOI] [PMC free article] [PubMed] [Google Scholar]
- 25. Tribouilloy C, Rusinaru D, Mahjoub H, Soulière V, Lévy F, Peltier M, Slama M, Massy Z. Prognosis of heart failure with preserved ejection fraction: A 5 year prospective population‐based study. Eur Heart J. 2008; 29: 339–347. [DOI] [PubMed] [Google Scholar]
- 26. Hjalmarson A, Goldstein S, Fagerberg B, Wedel H, Waagstein F, Kjekshus J, Wikstrand J, El Allaf D, Vítovec J, Aldershvile J, Halinen M, Dietz R, Neuhaus KL, Jánosi A, Thorgeirsson G, Dunselman PH, Gullestad L, Kuch J, Herlitz J, Rickenbacher P, Ball S, Gottlieb S, Deedwania P. Effects of controlled‐release metoprolol on total mortality, hospitalizations, and well‐being in patients with heart failure: The metoprolol CR/XL randomized intervention trial in congestive heart failure (MERIT‐HF). MERIT‐HF study group. JAMA. 2000; 283: 1295–1302. [DOI] [PubMed] [Google Scholar]
- 27. Effects of enalapril on mortality in severe congestive heart failure. Results of the cooperative north Scandinavian Enalapril survival study (CONSENSUS). N Engl J Med. 1987; 316: 1429–1435. [DOI] [PubMed] [Google Scholar]
- 28. McMurray JJ, Packer M, Desai AS, Gong J, Lefkowitz MP, Rizkala AR, Rouleau JL, Shi VC, Solomon SD, Swedberg K, Zile MR, PARADIGM‐HF Investigators and Committees . Angiotensin‐neprilysin inhibition versus enalapril in heart failure. N Engl J Med. 2014; 371: 993–1004. [DOI] [PubMed] [Google Scholar]
- 29. Svennberg E, Engdahl J, Al‐Khalili F, Friberg L, Frykman V, Rosenqvist M. Mass screening for untreated atrial fibrillation: The STROKESTOP study. Circulation. 2015; 131: 2176–2184. [DOI] [PubMed] [Google Scholar]
- 30. Kjerpeseth LJ, Igland J, Selmer R, Ellekjær H, Tveit A, Berge T, Kalstø SM, Christophersen IE, Myrstad M, Skovlund E, Egeland GM, Tell GS, Ariansen I. Prevalence and incidence rates of atrial fibrillation in Norway 2004–2014. Heart. 2021; 107: 201–207. [DOI] [PMC free article] [PubMed] [Google Scholar]
- 31. Shafazand M, Schaufelberger M, Lappas G, Swedberg K, Rosengren A. Survival trends in men and women with heart failure of ischaemic and non‐ischaemic origin: Data for the period 1987–2003 from the Swedish hospital discharge registry. Eur Heart J. 2009; 30: 671–678. [DOI] [PubMed] [Google Scholar]
- 32. Schaufelberger M, Ekestubbe S, Hultgren S, Persson H, Reimstad A, Schaufelberger M, Rosengren A. Validity of heart failure diagnoses made in 2000–2012 in western Sweden. ESC Heart Failure. 2020; 7: 36–45. [DOI] [PMC free article] [PubMed] [Google Scholar]
- 33. Ingelsson E, Arnlov J, Sundstrom J, Lind L. The validity of a diagnosis of heart failure in a hospital discharge register. Eur J Heart Fail. 2005; 7: 787–791. [DOI] [PubMed] [Google Scholar]
Associated Data
This section collects any data citations, data availability statements, or supplementary materials included in this article.
Supplementary Materials
Table S1. Supporting Information.