

Abstract

The wettability of rocks in a reservoir has a great influence on the oil recovery factor in oilfield development. In the present study, we perform a comprehensive investigation to probe the effect of reservoir wettability on the displacement efficiency due to water flooding. First, we report that the wettability of the sandstones can be significantly improved by the Jet-type AP plasma equipment—it takes effect to make a hydrophobic surface become hydrophilic. Subsequently, the displacement efficiency is measured by the self-developed setup, where such factors as the flow field flushing time, the velocity of the flow field, and the volume of the oil droplet are surveyed as controllable variables. Moreover, the force analysis of oil droplets in the flow field is performed to explain the scouring mechanism, and the experimental results are in accordance with that based on the dimensional analysis. Next, the numerical simulation is carried out to explore the detailed information in the displacement process. The function curves of the displacement efficiency with respect to the control variables are given by numerical simulations, which are in excellent agreement with the experimental data. In addition, the numerical simulation demonstrates the deformation of the crushed oil droplets due to the shearing of the flow field, associated with the pressure alteration of fluid during the displacement process. These findings are beneficial to better understand the effect of reservoir wettability on the oil recovery, which also provides inspiration for the areas of microfluidics, diffusion of pollutants, microsensors, etc.
1. Introduction
In modern oilfield development, the wettability of rocks underground has an important influence on the recovery factor of the reservoir.1−3 As a result, effectively altering the wettability of the reservoir has become a critical issue in enhancing oil recovery. In recent years, the relationship between the reservoir wettability and recovery factor has attracted much attention, and it has become a hot spot in petroleum development research.4−6 To fully understand the mechanism, a series of experiments and numerical calculations should be made based on the theory of continuum mechanics.
The reservoir’s wettability has a certain influence on the distribution of residual oils in the reservoir, the oil–water seepage law, the capillary force, etc., and consequently it significantly affects the water flooding recovery factor.7,8 Morrow et al.9 conducted several experiments on the indoor water flooding, and the results show that a less hydrophilic core has the highest water flooding recovery. Yan et al.10 studied the effect of the rock core’s wettability on the water flooding production. Their results show that the Amott index corresponding to the system with the highest water flooding recovery rate is around 0.2. Johannesen11 used outcrop limestone cores to study the relationship between the water flooding recovery factor and the wettability under the constant injection pressure. They realized that when the core hydrophilicity changes from high to low, a large amount of crude oils that are bound during the self-priming oil production can be produced. Song et al.12 also confirmed that the highest water flooding recovery can be obtained by altering the core’s wettability to a neutral wettability state. Zhou et al.13 studied the relationship between the water flooding recovery factor and the wettability index. The experimental data shows that the more the wettability of the core tends to be weakly water-wet-neutral, the higher the water flooding recovery factor is.
At present, there are many technologies applied to the surface modification of materials, including physical methods, chemical methods, etc. As a new molecular activation method, the low temperature plasma technique has been widely used for surface modification of materials due to its advantages of low excitation temperature and relatively mild conditions.14−18 Ni et al.19 first used the low temperature plasma to modify the surface of carbon fiber composites to improve their wettability. Felten et al.20 used the same technology to modify carbon nanotubes in three atmospheres of oxygen, carbon tetrafluoride, and ammonia, respectively. They found that polar functional groups such as carboxyl, carbonyl, and amino groups were added to the surfaces of the modified carbon nanotubes in these three atmospheres, respectively. Zhang et al.21 investigated the alteration of the contact angle of polyester with time after the treatment of low temperature plasma. They realized that the contact angle of polyester was about 80° in the absence of low temperature plasma treatment, and when the treatment time was 60 s, the contact angle was about 52°, which was about 33.3% lower than that of the untreated state. With the increased time duration of the low temperature plasma treatment, the contact angle of the polyester fabric becomes smaller and smaller. Li et al.22 used the atmospheric pressure low temperature plasma to modify the surface of fabrics in He and O2 atmospheres. They pointed out that when the treatment time was 20 s, the wetting performance of cotton fabrics was the best and the wetting angle had the smallest value. Tan et al.23 treated polyethylene glycol diacrylate (PEGDA) with Ar plasma. When the treatment time was 120 s, the contact angle of PEGDA was smaller and the hydrophilicity increased. Cui et al.24 used an atmospheric pressure dielectric barrier discharge plasma jet device to perform the surface plasma modification treatment on the glass surface in an Ar/TMS (trimethylsilanol) atmosphere. The experimental results show that the contact angle varies with the plasma treatment time. When the treatment time is 240 s, the contact angle reaches a maximum value of 110.3°. The research on the change of the wettability of the material surface by the plasma field has been mature, but the wettability of the rock surface is still blank. Therefore, the study of improving the wettability of the rock surface by plasma field is of great significance for enhancing oil recovery.
Although a plethora of work has been done on the effect of reservoir wettability on the oil recovery, there is still a lack of comprehensive study on the rock surface modification and the effect of wettability on the oil displacement process. Accurate experimental measurement and quantitative results remain a blank room as yet. Henceforth, this situation would limit the wider application of oil displacement in the area of the petroleum industry. Therefore, the goal of the present work is directed toward a comprehensive exploration on the reservoir wettability in order to enhance the oil recovery by means of experiments and numerical simulations.
The article is structured as follows. In Section 2, we show the experimental setup and the preparation of the experimental samples. In Section 3, we introduce the method of numerical simulation and the solution model and boundary condition settings. In Section 4, we analyze the action law and mechanism of the low temperature plasma field on the wettability change of the sandstone interface, and show the deformation and motion law of the oil droplet on the substrate before and after treatment by numerical simulation. Then, we measure the displacement efficiency by a self-developed device in which different factors such as flushing time, flow field velocity, and oil droplet volume are investigated as controllable variables. The experimental results are compared with the numerical simulation and dimensional analysis results. In Section 5, we perform force analysis on the oil droplet and calculate the critical start-up acceleration of the oil droplet. The calculated results are compared with the motion acceleration of oil droplets obtained by numerical simulation, and the results are in good agreement. In Section 6, the conclusion follows.
2. Experimental Section
2.1. Sample Treatment
Let us explore the effect of surface wettability of a sandstone reservoir on the water flooding recovery through experiments. We use the quartz sandstone as the base to simulate sandstone reservoirs in the formation, as it is a natural sandstone and the composition only contains quartz sands. The porosity of the quartz sandstone is 28%, and this ensures that it is roughly the same as the actual sandstone porosity of the reservoir. Due to the limited size of the discharge electrode of the system, we cut the standard sandstone sample (with an end face diameter being 25 mm and a height being 50 mm) into a surface area of 3 mm × 3 mm square sample enabling the sandstone sample to be placed between the two electrodes and thus treated completely and uniformly. Then, we place the sandstone sample on the insulating medium and adjust the distance between the upper and lower plates to 3 mm to ensure the repeatability of the experiment. Moreover, they are dried in an oven at 70 °C for 10 h before processing.
The schematic diagram of the experimental setup is shown in Figure 1. A Jet-type AP plasma equipment is adopted to alter the wettability of sandstone substrates. This Jet-type AP plasma equipment is powered by the plasma reactor via a coaxial cable connecting the power supply under the condition of the microwave frequency being 25 kHz and the applied peak power being 300 W. The input airflow is 10 L/min which is generated from the air compressor. The gap between the end of the nozzle and the sample surface is 8 mm, and each sample is treated for 3 min after 1 min air purging. The wettability is characterized by a contact angle goniometer (Theta Lit 100).
Figure 1.

Schematic diagram of the experimental setup.
First, we set the high-frequency power supply parameter to 25 kV. When the high-frequency voltage is applied between the high and low voltage electrodes, the electric field will break down the medium and produce ions and electrons. With the increase of time, more and more ions and electrons will be generated, and an internal electric field will be established. The internal electric field is opposite to the original electric field. The accumulated charge on the electrode surface increases, and the electric field intensity is continuously reduced. When it is reduced to the point where the electrons cannot obtain enough energy, the discharge will end. A pulse will appear in the whole process from the beginning of the discharge to the end of the discharge. Due to the existence of insulating medium, large current will not be formed inside, thus avoiding spark discharge between electrodes. The discharge pattern of dielectric barrier discharge can be distributed in the whole discharge space, rather than limited to a certain channel. As the external voltage is AC voltage, the above process will be repeated under the action of external voltage. The power supply is turned off after the treatment time reaches 30 s, and the treated sample is removed to stand.
2.2. Flow Field Scouring Experiment
We investigate the scouring efficiency of crude oils which stick to the surface of the quartz sandstone substrate with different wettability through experiments. As shown in Figure 2, the flow field used in the experiment is an acrylic water tank with the width D = 100 mm, the height H = 100 mm, and the length L = 500 mm. One end of the water tank is connected to a micropump to transport water, and the other end is a water outlet. Then, we install fairing 50 mm from the inlet to ensure that the water flows through the base area at a constant velocity v. The sandstone is weighed with a balance and the mass is recorded as M1. Then the samples are attached to the same height on both sides of the tank wall, 50 mm from the bottom of the tank, which is ended 300 mm from the water inlet. Before the experiment, we place the oil droplet at the same position on the substrate surface to ensure the same sticky wall state as that at the initial moment. The crude oil is taken from the Middle East with the value of the viscosity μo = 102 mPa·s and the value of the density ρo = 0.86 g/cm3. The water used in the experiment is ultrapure water with the value of the density ρw = 1.0 g/cm3 and the value of the viscosity μw = 1.0 mPa·s. After natural air-drying, we remove the residual water on the surface and reweigh the sample and record its mass as M2. In particular, the oil displacement efficiency η is obtained by the mass difference as follows:
| 1 |
where m is the mass of the oil droplet.
Figure 2.
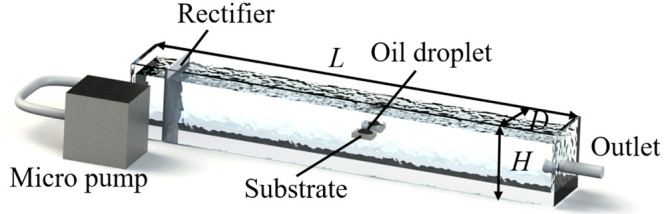
Flow setup to test the oil displacement efficiency.
We choose the flow field flushing time t, the velocity of flow field v, and the volume of oil droplet V as controlling variables. In the experiments, the effects of the above three variables on the oil displacement efficiency η are quantitatively probed. First, when considering the influence of the flow field flushing time t on the displacement efficiency, the other variables are kept unchanged, and the displacement efficiencies corresponding to six values of flushing time of t = 2, 4, 6, 8, 10, and 15 min are measured, respectively. Next, with the other variables unchanged, the effect of the velocity of flow field v, with six different values being 6, 8, 12, 16, 20, and 26 mm/s, on the displacement efficiency is studied, respectively. At last, we explore the influence of the volume of oil droplet V on the displacement efficiency, where six values of the volume, namely, 1.0, 1.5, 2, 2.5, 3.0, and 3.5 cm3, are considered.
3. Numerical Simulation
To further obtain information during the oil displacement in the substrates, a convenient way is to adopt the numerical simulation, as the analytical solution is not at hand currently. In order to facilitate the extension of research, we conduct the numerical simulation using the software Fluent 15. The Fluent software based on the Finite Volume Method (FVM), in light of the basic theory and simulation theory of computational fluid dynamics, is adopted to conduct the two-dimensional unsteady numerical simulation of oil and water carrying problems.
Due to the large difference in storage density between the oil and water phases, there is an obvious interface between the two phases. Therefore, we choose the Volume of Fluid (VOF) model, the Continuum Surface Force (CSF) model, and the laminar flow model to simulate the oil-carrying problem. When the interphase mass transfer and compressibility of fluids are not considered, the continuity equation and momentum equation can be expressed as
| 2 |
| 3 |
where p is the pressure of the liquid and g is the gravitational acceleration. The source term F represents the surface tension between the two phases and is modeled by approximating the surface force as a body force in the vicinity of the interface. The parameters ρ and μ are the density and viscosity related to the volume rate of the fluid components and can be expressed as
| 4 |
| 5 |
where α is the volume rate. It can be expressed as
| 6 |
The CSF model is a numerical method for describing interfacial tension, in which F introduces the interfacial force as a source term (additional body force) into the momentum equation
| 7 |
where k is the curvature of the interface and γwo is the interfacial tension between the water and the oil.
There are three boundary conditions in this work, i.e., the inlet boundary, the outlet boundary, and the wall boundary. A velocity boundary condition is set at the inlet, and a pressure boundary condition with 0 Pa is set at the outlet. A wetting wall boundary condition is set at the tube wall to control the contact angle of the fluid. The contact angle is measured by experiment. The interfacial tension between the water and the oil γwo is 0.0286 N/m, which is measured by using the instrument Auto surface and interface tension meter A60/80 Kino USA by the classical Wilhelmy Plate method.
For transient flow problems, initial conditions must be set to determine the initial flow field. In this work, the initial conditions include initial velocity distribution and initial water holdup. The velocity distribution at the inlet boundary can be defined using the UDF. The flow field is in a laminar state, so the inlet velocity satisfies the parabolic distribution. That is, the velocity at the wall is zero, and the velocity at the axis is the maximum. Within this region, the water phase is defined with an initial phase holdup of 1 and an initial velocity of 0.
The software is used to solve corresponding partial differential equations with predefined initial and boundary conditions using the finite element method. In the computational settings, the mobility tuning parameter and interface thickness are set to 1 and half the maximum element size, respectively. An initial value of 10–4 s is selected, and the time step is automatically adjusted based on the backward differentiation formula. A convergence criterion of 0.005 is specified to control the iterative solution process. PARDISO is used as a system solver in this work.
4. Results and Discussions
4.1. Wettability Alteration Due to the Treatment
For the prepared substrates, the contact angle θY is measured on the planar top surface, with the values 115° ± 3.6°, indicating that the sandstone substrates are hydrophobic. After treatment, the value of contact angle θY′ is measured as 47.6° ± 3.8°. This means that the wettability of the sandstone substrate was improved by the Jet-type APP equipment, which is initially hydrophobic or weakly hydrophobic. What’s more, we explore the variation of the contact angle of the sandstone substrate at the same position under different treatment time T such as 10, 20, 30, 40, and 50 s. As shown in Figure 3, with the increase of the value of T, the value of θY gradually decreases. When the parameter T stabilizes at 30 s, it has no effect on the change of contact angle. After the value of T exceeds 50 s, the surface of the sample is melted and destroyed.
Figure 3.
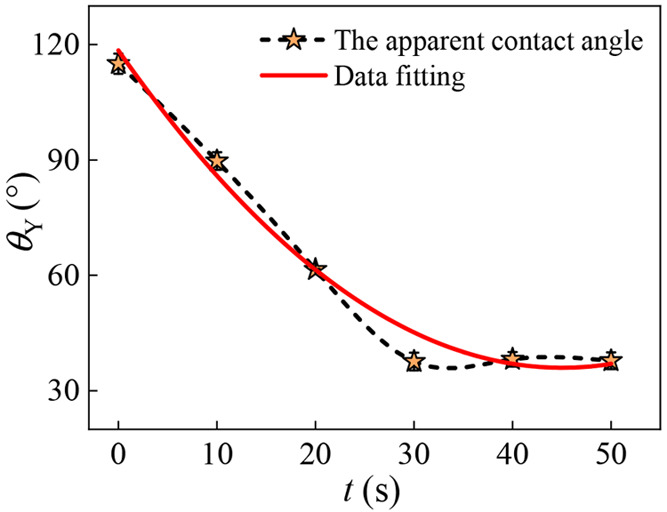
Relationship between the treatment time of low temperature plasma and the apparent contact angle.
This can be explained by the working principle of low temperature plasma. When the sandstone surface is processed by the Jet-type APP equipment, the working air is energized to produce highly reactive ozone, hydroxyl radical (OH), amino radical (NH2), and other chemically active species. Synchronously the SiO2 molecules of the sandstone surface can be excited. Thus, a series of complicated physical and chemical reactions occur on the sandstone surface. As a result, when the number of hydrophilic groups such as silanol (≡Si–OH) increases, the surface hydrophilicity is doubtlessly improved.25
The alteration of substrate wettability is just the reason for the significant increase in the displacement efficiency. In fact, this is mainly caused by the adhesion state of the oil droplet on the substrate caused by the variation of interfacial tension. To more accurately survey the mechanism of displacement, we also measure the contact angle between the oil droplet and the substrate before and after treatment in water. It is found that the substrate before treatment shows a strong lipophilic state under water, and the contact angle θY,O = 25.6° ± 4.2°. However, the lipophilic state of the treated substrate is weakened under water, and the contact angle θY,O′ = 55.6° ± 3.4°.
The sandstone matrix before treatment showed strong lipophilicity in water, but this lipophilicity was weakened after treatment. The shape and surface force analysis of oil droplets on the substrate are shown in Figure 4, and the Young’s equation is expressed as
| 8 |
where γSW is the surface tension between the water and the substrate, γSO is the surface tension between the oil droplet and the substrate.
Figure 4.

Interfacial force analysis diagram of the oil droplet in water, i.e., (a) untreated substrate, (b) treated substrate.
It can be seen from Figure 4 that the Young’s contact angle θY,O is increased. Evidently, the morphology of the oil droplet is roughly a spherical cap, and its volume is viewed as a constant. Thus, the increase of the contact angle increases the height of the oil droplet on the substrate, and the shearing effect of the water flow field on the oil droplet increases, so that most of the oil is washed away by the flow field. When the residual oil height is insufficient to reach the critical shear height h, the residual oil will remain on the substrate.
4.2. The Morphology of the Oil Droplet
We observe the morphological changes of oil droplets in detail by simulating the action process of the flow field. As shown in Figure 5a–e, the morphological changes of oil droplets are divided into five stages:
-
(a)
At the initial moment, the oil droplet spreads on the substrate stably due to the lipophilicity of the substrate.
-
(b)
With the enhancement of the flow field, the end of the oil droplet close to the water inlet gradually rises, and the height of the oil droplet increases in the direction.
-
(c)
The upper surface of the oil droplet will be broken due to the shearing action of the water flow field, causing the oil droplets to split as a whole, and some of the oil droplets will flow out of the system with the water flow field.
-
(d)
Then, the remaining oil droplets restore the morphology of spherical cap due to surface tension. Attributed to the continuous action of the flow field, the oil droplet continues to bulge and shear and break.
-
(e)
Until the volume of the oil droplet on the substrate is reduced to the point that the shearing force of the flow field is not enough to cause the oil droplet to deform in the vertical direction, the continuous flow field scouring no longer has any effect on the cleaning of the oil droplet.
Figure 5.
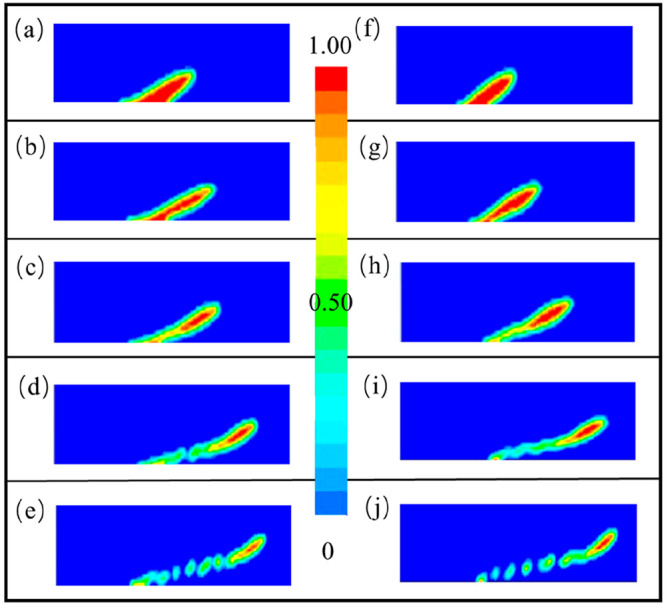
Volume phase distribution of the oil droplet on the substrate before and after treatment at any time, i.e., (a-e) untreated substrate, (f-j) treated substrate.
Although the displacement processes before and after treatment are the same, there are great differences in the deformation and fragmentation of the oil droplet. The bulk phase distribution from the initial state to the final state of the oil droplet on the untreated substrate is shown in Figure 5a–e. The motion morphology of the oil droplet on the treated substrate is shown in Figure 5f–j, and they have a sharp contrast.
By comparing Figure 5a and f, it is found that the oil droplet on the substrate before and after treatment is rapidly deformed and forms a raised oil film after being sheared by the flow field. However, the area where the oil film adheres to the substrate on the treated substrate is smaller than that of the untreated substrate, which indicates that the treated substrate is more efficient to displace oils. Then, the continuous shearing of the flow field breaks the front end of the oil droplet, and part of the oil droplet adheres to the substrate, which is shown in Figure 5d and i. It is worth noting that the locations where the oil droplet breaks are different. The location where the oil film breaks on the treated substrate is closer to the adhesive end; that is, more oil droplets are taken away by the first shearing action of the flow field.
However, the oil droplet on the untreated substrate has to undergo multiple oil droplet shearing and breaking processes. At last, as shown in Figure 5e and j, part of the oil droplet is sheared and broken, and flows out of the watershed along with the flow field. It is clear to see that the final volume of oil remaining on the treated substrate is much less than that of the untreated substrate. This phenomenon also confirms our experimental results that the displacement efficiency of the untreated substrate is far less than that of the treated substrate.
4.3. Effect of Various Factors on Displacement Efficiency
As mentioned above, the effect of each variable on the displacement efficiency is explored by means of controlling variables. First, we keep the velocity of the flow field v = 16 mm/s and the volume of the oil droplet V = 2 cm3 unchanged. Thus, the relation between the flow field flushing time t and the displacement efficiency η is demonstrated in Figure 6.
Figure 6.

Dependence relationship between the oil displacement efficiency and the flow field flushing time t on the hydrophilic and hydrophobic substrates.
The curve shows the displacement efficiency on the two substrates before and after the treatment increases with the increase of the flow field flushing time. When t = 10 min, the curve reaches a stable stage. It indicates that the heavy components such as asphaltenes and gums contained in crude oil adhere stably on the sandstone substrate, and the shear force generated by the existing flow field in the oil droplet area is not sufficient to make this part move. Moreover, the displacement efficiency of the treated substrate is always higher than that of the gradually untreated substrate, and the efficiency reaches the highest value at t = 10 min. At this time, the oil displacement efficiency on the substrate before treatment is 46.3%, and the oil displacement efficiency on the substrate after treatment is 69.2%, which is 1.49 times that of the untreated substrate. Obviously, the treated substrate appears to be both hydrophilic and lipophilic. When the flow field acts on the substrate, it competes with the sticky oil on the interface, which makes the oil droplet more unstable and deforms more than the untreated interface. Then, the remaining part continues to form a new oil film, which is taken away by the flow field under the action of a bigger shear force. In addition, the residual oil droplets can stably adhere to the substrate until the oil droplets have only heavy components and cannot reach the critical state of the oil film height h.
The relationships between the displacement efficiency and the controlling variables mentioned above can also be given according to the numerical simulation. As shown in Figure 6, the simulation results are compared with the experimental results, and the errors are acceptable in engineering. These small errors may be due to the errors in measurement during the experiment, and they cannot be avoided.
Next, we keep t = 8 min and V = 2 cm3, and different velocities of the flow field are injected into the sample. We use the micropump to control the flow rate of the flow field. The Reynolds number Re = ρwvD/μw, which corresponds to the five different flow rates, is 625, 800, 1042, 1563, 2083, and 2863, respectively, and the flow states are all laminar. Thus, the relation between the velocity of the flow field v and the displacement efficiency η is displayed in Figure 7. The curve shows that the velocity has a greater impact on the displacement efficiency, and the values of η on both substrates increase with the increase of v. This is because the greater the flow rate, the greater the shearing force near the oil film. The oil droplet is more likely to be broken due to shearing and move with the flow field, while the unshared oil film still adheres to the substrate. It is also found that, on the untreated substrate, the displacement efficiency first increases with the increase of the flow velocity, and then, the efficiency gradually stabilizes and maintains at 42.1% after the flow velocity reaches v = 20 mm/s. At this time, while the flow rate continues to increase, the displacement efficiency does not change much. Very differently, the surface of the treated substrate is hydrophilic, and the displacement efficiency shows a linear increasing trend with the increase of the flow rate, and the maximum displacement efficiency is up to 68.4%.
Figure 7.

Dependence relationship between the oil displacement efficiency and the velocity of the flow field on the hydrophilic and hydrophobic substrates.
Similarly, the numerical simulation results are also shown in Figure 7. It can be seen that the numerical simulation results are basically consistent with the experimental results, and there are numerical differences. The calculation shows that this error is within 10%, and we believe that this may be caused by the air-tightness of the device.
Finally, the relation between the displacement efficiency η and the volume of oil droplet V is displayed in Figure 8, where the other parameters are taken the same as those in Figure 7. The curve shows that the displacement efficiency of the substrate before and after treatment first increases with the increase of the volume of the oil droplet. Especially, when V = 2.5 cm3, the highest displacement efficiency of treated substrate can amount to the value 68.4%, and that of the untreated substrate can arrive at 45.3%. As is well-known, the oil droplets spread about the same area on the substrate because of the lipophilicity of the substrate, and increasing the oil droplet volume actually increases its height. In addition, the numerical simulation results are also shown in Figure 8, which is in good agreement with the experimental results.
Figure 8.

Dependence relationship between the oil displacement efficiency and the volume of oil droplet V on the hydrophilic and hydrophobic substrates.
As mentioned above, the increase in the height of the oil droplets will cause the oil–water interface to deform due to the shear force, so the oil film is sheared and broken and some oil droplets flow out with the flow field. The residual oil droplets return to the initial state due to the action of surface tension, with the height decreasing. Subsequently, under the action of the flow field, the oil film is deformed and broken again. Until the shear force of the flow field is not enough to deform the oil film, no more oil droplets will be displaced. In addition, the displacement efficiency of the treated substrate is always higher than that of the untreated substrate, which is about 2 times higher. The reason for this difference is that the treated substrate is more hydrophilic, and the effect of the flow field is amplified and the efficiency is higher.
4.4. Scaling Law
The experimental results can be further investigated by way of dimensional analysis, as there are too many factors working and the analytical solution is nearly impossible. The displacement efficiency η is correlated with many variables, which mainly include v, t, V, μo, γWO, H, D, and θY′. According to the principle of dimensional analysis, the scaling law for η reads
| 9 |
where f(θY′) is a function of the apparent contact angle between water and substrate θY.
The above relation can be definitely used to analyze the obtained experimental results. Herein, the parameters take the same values as mentioned in the experiment. First, the dependence relation between the flow field flushing time t and the displacement efficiency η is exhibited in Figure 6. When the other parameters are fixed, by fitting the experimental data we get the following relation
| 10 |
It can be seen that the experimental result is consistent with that derived by the dimensional analysis in eq 10, and thus the experiment is reliable. Among them, the coefficient in eq 10 can be further obtained by fitting the experimental data.
Similarly, the relations between the displacement efficiency η and the other controlling variables, i.e., the velocity of flow field v, and the volume of oil droplet V can be given according to eq 9. If the other parameters are fixed, one can respectively get
| 11 |
| 12 |
It can be seen that these relations in eqs 11 and 12 are in accordance with the experimental data in Figure 7 and Figure 8, respectively. This fact partially indicates that the experimental results are reliable.
5. Further Analysis Based on Force Analysis
As we all know, the displacement efficiency is only a result quantity, and the change of the force field and the movement of the oil droplet during the displacement process are the reasons for the difference in the displacement efficiency. The force in the process of the oil droplet movement is very complex, so we use the average acceleration of the oil droplet’s center of mass to represent the resultant force on the oil droplet. That is to say, there is a functional relationship between the displacement efficiency and the average acceleration of the oil droplet movement. The greater the acceleration, the smaller the resultant force of the resistance on the oil droplet. Based on the flow dynamics of the shearing force of the water flow field, the oil droplet can generate greater deformation and even shear flow, which will also lead to higher displacement efficiency.
Therefore, we analyze the force of the oil droplet and calculate the critical acceleration of the oil droplet. Then we obtain the curve of the acceleration with time during the movement of the oil droplet before and after processing through numerical simulation.
5.1. Theoretical Calculation of the Critical Onset Acceleration
We then calculate the specific value of the oil bottom’s height increase, and the force and movement of the oil droplet at the initial movement time via theoretical analyses. It is found in the experiment that the oil droplet spreads differently on substrates with different surface wettability. The morphology of the oil droplet before spreading can be regarded as a spherical cap, and its volume can be calculated using the classical volume equation.
However, the oil droplets no longer remain spherical after spreading on the substrate. The volume of the spread oil droplet can be expressed as
| 13 |
We find that the heights on the substrate before and after treatment are 3.19 mm and 1.86 mm, respectively. According to the oil droplet morphology shown in Figure 4, we believe that the oil droplet spreads more on the hydrophilic substrate. The theoretically calculated spread radius is consistent with this analysis.
According to eq 13, the radius of the oil droplet R on different interfaces can be calculated
| 14 |
Similarly, the radii of the oil droplet before and after treatment are calculated to be 7.83 mm and 7.81 mm, respectively.
The movement of the oil droplet in the laminar flow field is mainly related to the drag force FD, the elastic force Ff of the oil droplet on the three-phase contact line, the viscous force Fw between the oil droplet and the surrounding water flow, and the viscous force Fs between the oil droplet and the solid wall. Then, we establish the coordinate system shown in Figure 9 to analyze the forces on the oil droplet in the horizontal direction.
Figure 9.

Schematic diagram for the oil droplet force analysis.
According to Newton’s second law, the force analysis of the oil droplet can be obtained as
| 15 |
where a is the average acceleration of the oil droplet’s centroid.
The drag force of the oil droplet by the flow field was first proposed by Stokes and expressed as
| 16 |
The capillary force of the oil droplet acts on the three-phase contact line between the oil droplet and the substrate, and the resultant force can be expressed as
| 17 |
where θR is the receding contact angle between the oil droplet and the substrate surface, and θA is the advancing contact angle. These parameters are measured by experiments, where the receding contact angle of the oil droplet on the substrate before treatment is 22.1° ± 2.1°, and the advancing contact angle is 29.3° ± 1.6°. The value of the receding contact angle of the oil droplet on the treated substrate is 49.3° ± 2.6°, and the advancing contact angle is 60.2° ± 3.2°.
The viscous force Fs between the oil droplet and the solid surface is the viscous resistance when the oil droplet and the substrate move relative to each other and can be expressed as
| 18 |
where vs is the velocity of the oil droplet relative to the substrate, and Ss is the spreading area of the oil droplet on the substrate.
Moreover, the viscous force Fw between the oil droplet and the surrounding water flow can be written as
| 19 |
By substituting eqs 16–19 into eq 15, we can obtain the average acceleration of the center of mass when the oil droplet moves at the initial moment. The values of the base acceleration before and after treatment are a = −0.64 mm/s2 and a = −0.23 mm/s2, respectively, where the minus symbol represents the opposite direction of motion.
According to the calculation results, it can be seen that the oil droplet on the substrate before and after treatment decelerates at the initial moment. This is because the oil droplet is affected by various motion resistances. The difference is that the value of the acceleration on the treated substrate is smaller, which means that the resultant force of the resistance to the movement of the oil droplet on the treated substrate decreases. Most of the oil droplets are easily sheared away by the drag force of the flow field, which is consistent with the previously obtained experimental results of higher displacement efficiency on the treated substrate.
5.2. The Average Acceleration of the Oil Droplet Centroid
The movement of the oil droplet in the flow field is affected by multiple forces, which have been discussed in detail in Section 5.1, and the numerical values of the average acceleration of the oil droplet centroids on the two substrates at the critical start-up moment of the oil droplet are calculated.
However, the movement process of the oil droplet is complicated and changes all the time, so it is impossible to obtain the acceleration value of the oil droplet at each moment through theoretical calculation. Therefore, we obtain the acceleration curve of the oil droplet at any time during the movement of the oil droplet by means of numerical simulation, which can effectively reflect the movement and force of the oil droplet during the movement process.
As shown in Figure 10, it is easy to see that the average motion acceleration values of oil droplets on the substrate before and after treatment are basically the same, and they all gradually increase from smaller negative values. The acceleration value reaches the extreme value at about 600 s, and then gradually decreases. This is consistent with the conclusion obtained in the experiment that the displacement efficiency reaches the extreme value when the action time of the flow field is about 9 min. The difference is that the acceleration values of the two are different, and the extreme values of the acceleration are not equal. Alternatively, the motion acceleration of the oil droplet on the treated substrate is always smaller than that of the untreated substrate, and the extreme value of the acceleration is also smaller than that of the treated substrate. The maximum average motion acceleration of the oil droplet on the treated substrate can reach 9.1 mm/s2, while that on the untreated substrate is only 7.5 mm/s2.
Figure 10.

Plot of the mean velocity of oil droplet centroids over time on the substrate before and after treatment.
6. Conclusion
In conclusion, the influence of sandstone surface wetting behavior on water flooding efficiency is comprehensively explored in the present work, aiming to find a useful strategy to enhance the oil recovery. First, a method of wetting reversal induced by low temperature plasma field on sandstone surface is proposed, and the effect of wetting reversal phenomenon on the oil–water two-phase flow problem is evaluated. The displacement efficiency is measured by the self-developed setup, where different factors, such as the flow field flushing time, the velocity of flow field and the volume of the oil droplet are surveyed as controllable variables. The experimental results can be well verified by the scaling laws according to the principle of dimensional analysis. The numerical simulation is performed to probe the detailed displacement process. The function curves of the displacement efficiency with respect to the controlling variables can also be validated by the numerical simulation. In addition, the numerical simulation also demonstrates the topography of the oil droplet, which further explains the experimental conclusion that the displacement efficiency is higher on the more hydrophilic substrates. The force of the oil droplet under the action of the flow field is analyzed, and the radius and height of the oil droplet spread on the substrates with different wettability are calculated. The critical motion state of the oil droplet is further analyzed, and the critical starting acceleration value of the oil droplet is calculated. Altogether, the simulation results are in excellent agreement with the theoretical calculation.
It should be mentioned that further work can be done in the near future, including the effect of sandstone surface wetting behavior on tertiary displacement technology, and more engineering applications should be extended. All the same, the present findings are beneficial to our better understanding of the improvement of sandstone surface wettability with the aid of external fields and also provide inspirations for the areas of microfluidics, diffusion of pollutant, microsensors, etc.
Acknowledgments
This work was supported by the National Natural Science Foundation (11972375), the Key R & D Program in Shandong Province (2019GHZ001), the Natural Science Foundation of Shandong Province (ZR202011050038), and the State Key Laboratory for GeoMechanics and Deep Underground Engineering, China University of Mining & Technology/China University of Mining & Technology, Beijing (SKLGDUEK2108).
Author Contributions
All authors have given approval to the final version of the manuscript.
The authors declare no competing financial interest.
References
- Han D.; Yuan H.; Wang H. The effect of wettability on oil recovery by alkaline/surfactant/polymer flooding. SPE J. 2006, 1. 10.2118/102564-MS. [DOI] [Google Scholar]
- Jadhunandan P. P.; Morrow N. R. Effect of wettability on waterflood recovery for crude-oil/brine/rock systems. SPE Res. Eng. 1995, 10, 40–46. 10.2118/22597-PA. [DOI] [Google Scholar]
- Kennedy H. T.; Burja E. O.; Boykin R. S. An investigation of the effects of wettability on oil recovery by water flooding. J. Phys. Chem. 1955, 59, 867–869. 10.1021/j150531a015. [DOI] [Google Scholar]
- Anderson W. G. Wettability literature survey-part 6: the effects of wettability on waterflooding. J. Petro. Techn. 1987, 39, 1605–1622. 10.2118/16471-PA. [DOI] [Google Scholar]
- Agbalaka C. C.; Dandekar A. Y.; Patil S. L. The effect of wettability on oil recovery: a review. SPE J. 2008, 1. 10.2118/114496-MS. [DOI] [Google Scholar]
- Jackson M. D.; Valvatne P. H.; Blunt M. J. Prediction of wettability variation within an oil/water transition zone and its impact on production. SPE J. 2005, 10, 185–195. 10.2118/77543-PA. [DOI] [Google Scholar]
- Sheng J. J. Comparison of the effects of wettability alteration and IFT reduction on oil recovery in carbonate reservoirs. Asia-Pacific J. Chem. Eng. 2013, 8, 154–161. 10.1002/apj.1640. [DOI] [Google Scholar]
- Tweheyo M.; Holt T.; Torsæter O. An experimental study of the relationship between wettability and oil production characteristics. J. Petro. Sci. Eng. 1999, 24, 179–188. 10.1016/S0920-4105(99)00041-8. [DOI] [Google Scholar]
- Morrow N. R. Wettability and its effect on oil recovery. J. Petro. Techn. 1990, 42, 1476–1484. 10.2118/21621-PA. [DOI] [Google Scholar]
- Yan J. N. Influence of reservoir rock wettability on oil displacement efficiency during waterflooding. J. Univ. Petro. (Nat. Sci. Ed.). 1998, 22, 43–46. [Google Scholar]
- Johannesen E.; Graue A. Systematic investigation of waterflood reducing residual oil saturations by increasing differential pressures at various wettabilities. SPE J. 2007, 108593. 10.2118/108593-MS. [DOI] [Google Scholar]
- Song X. W.; Zhang L. J.; Cao X. L. Influence of wettability on oil-water seepage characteristics. Oil. Chem. 2008, 25, 305–308. [Google Scholar]
- Zhou X.; Morrow N. R.; Ma S. Interrelationship of wettability, initial water saturation, aging time and oil recovery by spontaneous imbibition and water-flooding. SPE J. 2000, 5, 199–207. 10.2118/62507-PA. [DOI] [Google Scholar]
- Shao T.; Yan P. Atmospheric pressure gas discharge and its plasma application. Beijing: Sci. Press. 2015, 1. 10.13336/j.1003-6520.hve.20160308018. [DOI] [Google Scholar]
- Ni X. L.; Jin F. Y.; Tong H. H. Carbon fiber/resin composites treated by plasma. Acta Mater. Compos. Sin. 2015, 32, 721–727. [Google Scholar]
- Dai D.; Ning W. J.; Shao T. Research status and development trend of atmospheric pressure low temperature plasma. Trans. CES. 2017, 32, 1–9. [Google Scholar]
- Mei D. H.; Fang Z.; Shao T. Research status of characteristics and application of atmospheric pressure low temperature plasma. Proc. CSEE 2020, 40, 1339–1358. [Google Scholar]
- Li H. P.; Yu D. R.; Sun W. T.; Liu D. X.; Li J.; Han X. W.; Li Z. Y.; Sun B.; Wu Y. State-of-the-art of atmospheric discharge plasmas. High Volt. Eng. 2016, 42, 3697–3727. [Google Scholar]
- Ni X. L.; Jin F. Y.; Dan M.; Shen L. R.; Duan X. R. The wettability improvement research of carbon fiber composites modified by plasma activation. J. Funct. Mater. 2014, 45, 21107–21111. [Google Scholar]
- Felten A.; Bittencourt C.; Pireaux J. J.; Van Lier G.; Charlier J. C. Radio-frequency plasma functionalization of carbon nanotubes surface O2, NH3, and CF4 treatments. J. Appl. Phys. 2005, 98, 074308.1–074308.9. 10.1063/1.2071455. [DOI] [Google Scholar]
- Zhang H.; Yan J.; Wang X. W.; Jiao A. D.; Li H.; Zheng L. J.; He T. T. Application of low temperature plasma in surface modification of polyester fiber. J. Text. Res. 2019, 40, 103–107. [Google Scholar]
- Li X. M.; Cao C. Z.; Chen G. Y.; Chen L. X. Influence of plasma treatment on hydrophilicity of raw cotton fabric. J. Text. Res. 2011, 32, 24–27. [Google Scholar]
- Tan G. X.; Chen R.; Ning C. Y.; Zhang L.; Ruan X. J.; Liao J. W. Effect of plasma modification conditions on hydrophilicity and surface energy of PEGDA-HEMA gel. Polym. Mater. Sci. Eng. 2011, 27, 55–57. [Google Scholar]
- Cui X. L.; Yan B.; Zhang B.; Fang Z. Improving surface hydrophobicity of glass using an atmospheric pressure plasma jet array in Ar/TMS. Vacuum. 2018, 151, 15–24. 10.1016/j.vacuum.2018.01.042. [DOI] [Google Scholar]
- García N.; Benito E.; Guzmán J.; Tiemblo P. Use of ptoluenesulfonic acid for the controlled grafting of alkoxysilanes onto silanol containing surfaces: preparation of tunable hydrophilic, hydrophobic, and super-hydrophobic silica. J. Am. Chem. Soc. 2007, 129, 5052–5060. 10.1021/ja067987a. [DOI] [PubMed] [Google Scholar]