Abstract
Simple Summary
Plastids are semi-autonomous plant organelles which play critical roles in photosynthesis, stress response, and storage. The plastid genomes (plastomes) in angiosperms are relatively conserved in quadripartite structure, but variable in size, gene content, and evolutionary rates of genes. The genus Crassula L. is the second-largest genus in the family Crassulaceae J.St.-Hil, that significantly contributes to the diversity of Crassulaceae. However, few studies have focused on the evolution of plastomes within Crassula. In the present study, we sequenced ten plastomes of Crassula: C. alstonii Marloth, C. columella Marloth & Schönland, C. dejecta Jacq., C. deltoidei Thunb., C. expansa subsp. fragilis (Baker) Toelken, C. mesembrianthemopsis Dinter, C. mesembryanthoides (Haw.) D.Dietr., C. socialis Schönland, C. tecta Thunb., and C. volkensii Engl. Through comparative studies, we found Crassula plastomes have unique codon usage and aversion patterns within Crassulaceae. In addition, genomic features, evolutionary rates, and phylogenetic implications were analyzed using plastome data. Our findings will not only reveal new insights into the plastome evolution of Crassulaceae, but also provide potential molecular markers for DNA barcoding.
Abstract
The genus Crassula is the second-largest genus in the family Crassulaceae, with about 200 species. As an acknowledged super-barcode, plastomes have been extensively utilized for plant evolutionary studies. Here, we first report 10 new plastomes of Crassula. We further focused on the structural characterizations, codon usage, aversion patterns, and evolutionary rates of plastomes. The IR junction patterns—IRb had 110 bp expansion to rps19—were conservative among Crassula species. Interestingly, we found the codon usage patterns of matK gene in Crassula species are unique among Crassulaceae species with elevated ENC values. Furthermore, subgenus Crassula species have specific GC-biases in the matK gene. In addition, the codon aversion motifs from matK, pafI, and rpl22 contained phylogenetic implications within Crassula. The evolutionary rates analyses indicated all plastid genes of Crassulaceae were under the purifying selection. Among plastid genes, ycf1 and ycf2 were the most rapidly evolving genes, whereas psaC was the most conserved gene. Additionally, our phylogenetic analyses strongly supported that Crassula is sister to all other Crassulaceae species. Our findings will be useful for further evolutionary studies within the Crassula and Crassulaceae.
Keywords: Crassula, Crassulaceae, plastome, codon usage, codon aversion, DNA barcoding, evolutionary rates, phylogeny
1. Introduction
The family Crassulaceae comprises approximately 1400 species in 34 genera and three subfamilies (Crassuloideae Burnett, Kalanchoideae A. Berger, and Sempervivoideae Arn.) [1,2,3,4,5,6,7]. These subfamilies can be further subdivided into seven major clades: Crassula (Crassuloideae), Kalanchoe (Kalanchoideae), and the other five clades (Sempervivum, Leucosedum, Aeonium, Acre, and Telephium), which form the largest subfamily Sempervivoideae [3,4,5,6,8]. The genus Crassula, with about 200 accepted species, is the only unique genus in the clade Crassula, the second-largest genus of Crassulaceae, and significantly contributes to the diversity of Crassulaceae [3,9,10]. Previous taxonomic revision of Crassula recognized two subgenera: Crassula L. and Disporocarpa Fischer & C.A. Mey. [7,11,12]. The monophyly of the subgenus Crassula was well supported in two recent molecular phylogenetic studies [9,10]. Nevertheless, the monophyly of subgenus Disporocarpa is still controversial [9,10]. Thus, more evidence and further investigations are required to clarify the phylogenetic relationships of Crassula.
Plastids are semi-autonomous plant organelles which have many vital functions, such as photosynthesis, stress response, and storage [13]. In angiosperms, the plastid genome (plastome) generally exhibits a conserved quadripartite circular structure with a size of 120–170 kb, comprising two single copy regions (larger and small regions, namely LSC and SSC, respectively) and two inverted repeat regions (IRs) [14,15,16]. Owing to the low level of recombination, uniparental inheritance, and without interference from paralogs, plastome has been extensively utilized as a super-barcode for plant species identification and evolutionary studies [17,18,19,20,21,22,23,24]. Due to the rapid development and widespread application of high-throughput sequencing technologies (such as Illumina, PacBio, and Nanopore sequencing technologies), an increasing number of complete Crassulaceae plastomes (more than 70 sequences) have been deposited in public databases. However, within the Crassula, only one plastome has been reported to date [6]. The lack of plastome data has limited the progress in investigating the evolutionary history of Crassula. Therefore, more plastome data from Crassula are needed to address this issue.
Codon usage bias (CUB), indicating the preferential utilization of synonymous codons in protein-coding genes (PCGs), has evolved via combined effects of genetic drift, mutation, and natural selection [17,25,26,27,28]. Owing to different species having diverse codon usage patterns, investigations of CUB can reveal phylogenetic relationships between species [17,25,26,27,28]. Codon aversion is defined as the codon which is not used in a certain gene [29,30,31]. The codon aversion motif is phylogenetically conserved in some lineages [29,30,31]. Interestingly, our recent reports in Macaronesian species (Crassulaceae) and Bletilla Rchb.f. species (Orchidaceae Juss.) have suggested that plastid CUB and codon aversion patterns might harbor phylogenetic signals [17,26]. Therefore, the analyses of plastid genes in codon-usage aspects might broaden our understanding of the phylogeny of both Crassula and Crassulaceae.
Evolutionary rate, calculated by the ratio (dN/dS) of nonsynonymous rate (dN) and synonymous rate (dS), can quantify the intensity of the selective force acting on a PCG [32,33,34]. The evolutionary rate can also reflect the pattern of natural selection (dN/dS value >1, =1, and <1 indicate positive, neutral, and purifying selection, respectively) [33,34,35]. The dN/dS values in different genes are variable, which might be influenced by many factors, such as protein function, population size, generation time, and DNA-repair efficiency [36,37]. The dN/dS values of plastid genes have been measured in many plant lineages, and most values were lower than 1, indicating plastid genes were mainly under the purifying selection [13,22,38,39,40]. Currently, the detailed rates and patterns of plastid genes were largely unknow in Crassulaceae. Knowledge of the evolutionary rates and patterns will shed light on how the diversifying selection affected the plastome evolution in Crassulaceae.
To address these issues, we newly sequenced and assembled the plastomes of ten Crassula species (C. alstonii, C. columella, C. dejecta, C. deltoidea, C. expansa subsp. fragilis, C. mesembrianthemopsis, C. mesembryanthoides, C. socialis, C. tecta and C. volkensii) using Illumina sequencing technology. Together with the public data, we performed comprehensive analyses to investigate (1) structural characterizations of Crassula plastomes, (2) unique CUB and codon-aversion patterns for Crassula plastomes, (3) evolutionary rates and patterns of plastid genes of Crassulaceae, and (4) phylogenetic relationships among Crassulaceae species. Our findings will not only shed new insights into the plastome evolution of Crassulaceae, but also provide potential molecular markers for DNA barcoding.
2. Materials and Methods
2.1. Sample Collection, DNA Extraction, and Sequencing
The fresh leaf samples of ten Crassula species were collected from greenhouses of Anhui Normal University, with the voucher codes KL01739, KL01709, KL01449, KL01646, KL02048, KL01731, KL01444, KL01653, KL01657, and KL01688 for C. alstonii, C. columella, C. dejecta, C. deltoidea, C. expansa subsp. fragilis, C. mesembrianthemopsis, C. mesembryanthoides, C. socialis, C. tecta, and C. volkensii, respectively. The Plant Genomic DNA kit (Tiangen, Beijing, China) was used for Genomic DNA extraction. Furtherly, a TruSeq DNA PCR-Free Library Prep Kit (Illumina, San Diego, CA, USA) was employed for library construction. Then, these libraries were sequenced using the Illumina Hiseq X Ten (Illumina, San Diego, CA, USA) platform.
2.2. Plastome Assembly, Genome Annotation, and Comparative Genomic Analysis
All resulting high-quality clean reads were assembled by using GetOrganelle 1.7.5 [41] with the plastome of C. perforata Thunb. (NC_053949) [6] as reference. The plastomes were initially annotated with the online program GeSeq [42] and then checked manually. Bowtie 2.4.1 [43] and Chloroplot [44] were utilized for the sequencing depth estimation and the drawing of a gene map, respectively. Genome comparisons were visualized using mVISTA [45] in Shuffle-LAGAN mode. In order to detect highly variable regions (HVRs) among plastomes, the sliding-window nucleotide diversity (π) values were measured in DnaSP v6.12 (window length = 600 bp, and step size = 200 bp) [46]. The contiguous sliding windows with higher π values (π > πmean + 2 standard deviation) were merged as a HVR [47,48]. The contraction and expansion of IR regions at the junctions of plastomes were subsequently plotted using R package IRscope V0.1.R (Viikki Plant Science Centre, University of Helsinki, Helsinki, Finland) [49].
2.3. Codon Usage and Aversion Indices Analyses
To investigate the codon usage indices, we used CodonW v.1.4.2 (Peden, University of Nottingham, Nottingham, UK) to calculate the values of relative synonymous codon usage (RSCU), and the effective number of codons (ENC) of plastid genes (length ≥300 bp) among 87 Crassulaceae species (10 of which are new in this study, Table S1). The RSCU value for a codon represents the observed frequency divided by the expected frequency (RSCU >1 implies a codon use higher than expected, and vice versa) [50]. The RSCU heatmap was rendered using TBtools 1.098 [51]. In addition, the ENC values, ranging from 20 (extreme bias) to 61 (no bias), quantify the level of CUB of synonymous codons [52]. Furtherly, the parity rule 2 (PR2) plot was performed according to the two formulas: GC-bias = [G3/(G3 + C3)|4] and AT-bias = [A3/(A3 + T3)|4] (“|4” means 4-fold degenerate synonymous codons, and G3, C3, A3 and T3 denotes nucleotide composition at the 3rd codon sites, respectively) [53,54]. The points lying at the centre of plot (AT bias = 0.5 and GC bias = 0.5) indicate no bias, whereas the off-centred points reflect the direction and extent of bias [53,54]. Moreover, the codon aversion motifs harboring strong phylogenetic implications were identified by using CAM v.1.02 [31].
2.4. Nucleotide Substitution Rate Analyses
The 79 PCGs from 87 species of Crassulaceae were employed to evaluate the evolutionary rates (Table S1). The percentage of variable sites (PV) and average π values were measured with DnaSP v6.12 (Departament de Genètica, Universitat de Barcelona, Barcelona, Spain) [46]. The nucleotide substitution rates, including dN, dS, and dN/dS, were inferred with PAML v4.9 [55] under F3X4 and M0 model.
2.5. Phylogenetic Implications Analyses
Phylogenetic relationships among 87 Crassulaceae species were inferred by maximum-likelihood (ML) and Bayesian inference (BI) methods, based on 79 PCGs (Data S1). Recent studies of Lu et al. [9] and Bruyns et al. [10] revealed a sister relationship between Crassulaceae and Haloragaceae R.Br. Therefore, two species of Haloragaceae (Myriophyllum aquaticum (Vell.) Verdc., NC_048889 and Myriophyllum spicatum L., NC_037885) were selected as outgroups. Multiple sequence alignments were generated using MAFFT v7.505 in PhyloSuite v1.2.1 with codon model [56]. The best-fit nucleotide substitution models were evaluated with ModelTest-NG v0.1.7 [57]. Subsequently, we employed RAxML-NG 1.1 [58] and MrBayes v3.2.7a [59] for ML and BI analyses, respectively. For ML analyses, the reliabilities were assessed with 1000 bootstrap replicates, and the convergence was evaluated by using parameter “--bsconverge” in RAxML-NG package (Computational Molecular Evolution Group, Heidelberg Institute for Theoretical Studies, Heidelberg, Germany). For BI analyses, four independent Markov chains and two independent runs (running for 10,000,000 generations, and sampling every 1000 generations) were conducted, with Tracer 1.7.1 (Institute of Evolutionary Biology, University of Edinburgh, Edinburgh, UK) [60] for the convergence. After discarding the first 25% trees as burn-in, the remaining 75% trees were used to estimate the consensus tree and Bayesian posterior probabilities.
3. Results
3.1. Plastome Organizations and Structural Features
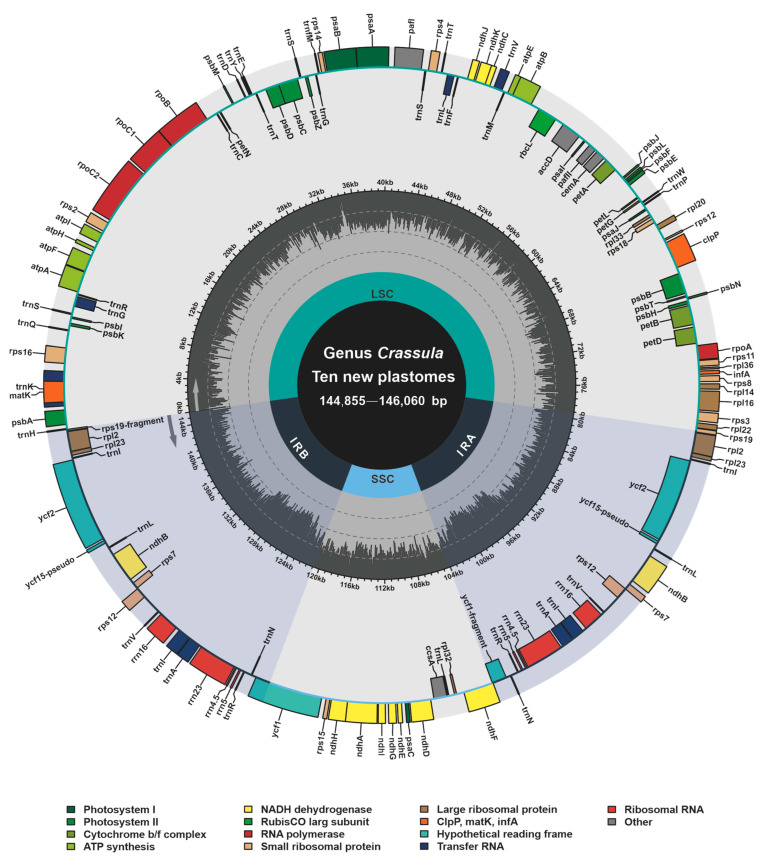
Based on bowtie2 mapping, totally 3,246,461, 1,740,232, 3,915,950, 2,632,260, 2,801,895, 504,972, 5,440,628, 3,398,113, 1,877,288 and 1,530,319 paired reads were mapped to the plastomes of C. alstonii (coverage: 3344.02×), C. columella (coverage: 1762.18×), C. dejecta (coverage: 4020.78×), C. deltoidei (coverage: 5284.33×), C. expansa subsp. fragilis (coverage: 5796.17×), C. mesembrianthemopsis (coverage: 1010.16×), C. mesembryanthoides (coverage: 5557.15×), C. socialis (coverage: 3486.98×), C. tecta (coverage: 1918.07×), and C. volkensii (coverage: 3161.69×), respectively. The new complete plastomes of ten species of Crassula (accession numbers: OP729482–OP729487 and OP882297–OP882300) were typical circular and quadripartite biomolecules (Figure 1), with sizes ranging from 144,855 bp to 146,060 bp. These plastomes contains LSC (78,303–79,707 bp), SSC (16,568–16,871 bp), and IR (24,810–24,878 bp). The overall GC contents of Crassula plastomes were between 37.73% and 38.32%. Notably, the GC contents of IR regions (42.93–43.15%) were found to be higher than those of in the LSC (35.75–36.51%) and SSC regions (31.67–32.40%). In addition, these plastomes contain 134 genes, including 85 PCGs, 37 tRNA genes, 8 rRNA genes and 4 pseudogenes. Among these genes, 6 PCGs, 7 tRNA genes, 4 rRNA genes, and one pseudogene (ycf15), were completely duplicated in the IR regions (Table 1).
Figure 1.
Annotation map of ten new plastomes from Crassula species. Directed with arrows, genes that are listed inside and outside of the circle are respectively transcribed clockwise and counterclockwise. Different colors represent different functional groups.
Table 1.
Plastome characteristics of Crassula species.
| Species | Accession Number | Size (bp) | GC Content (%) | Gene Number | ||||||||||
|---|---|---|---|---|---|---|---|---|---|---|---|---|---|---|
| Genome | LSC | IR | SSC | Genome | LSC | IR | SSC | Total | PCGs | tRNA | rRNA | Pseudo | ||
| C. alstonii † | OP729482 * | 145,507 | 79,304 | 24,813 | 16,577 | 37.82 | 35.86 | 42.96 | 31.85 | 134 (19) | 85 (6) | 37 (7) | 8 (4) | 4 (2) |
| C. columella † | OP729483 * | 145,554 | 79,332 | 24,827 | 16,568 | 37.83 | 35.86 | 42.95 | 31.86 | 134 (19) | 85 (6) | 37 (7) | 8 (4) | 4 (2) |
| C. dejecta † | OP729484 * | 145,870 | 79,495 | 24,859 | 16,657 | 37.73 | 35.76 | 42.93 | 31.67 | 134 (19) | 85 (6) | 37 (7) | 8 (4) | 4 (2) |
| C. mesembrianthemopsis † | OP882297 * | 146,046 | 79,664 | 24,854 | 16,674 | 37.78 | 35.78 | 42.97 | 31.89 | 134 (19) | 85 (6) | 37 (7) | 8 (4) | 4 (2) |
| C. mesembryanthoides † | OP729485 * | 146,057 | 79,707 | 24,858 | 16,634 | 37.78 | 35.78 | 42.94 | 31.9 | 134 (19) | 85 (6) | 37 (7) | 8 (4) | 4 (2) |
| C. perforata † | NC_053949 | 145,737 | 79,465 | 24,810 | 16,652 | 37.75 | 35.75 | 42.97 | 31.77 | 134 (19) | 85 (6) | 37 (7) | 8 (4) | 4 (2) |
| C. socialis † | OP729486 * | 145,842 | 79,549 | 24,828 | 16,637 | 37.79 | 35.8 | 42.95 | 31.86 | 134 (19) | 85 (6) | 37 (7) | 8 (4) | 4 (2) |
| C. tecta † | OP729487 * | 146,060 | 79,662 | 24,854 | 16,690 | 37.78 | 35.78 | 42.97 | 31.88 | 134 (19) | 85 (6) | 37 (7) | 8 (4) | 4 (2) |
| C. deltoidea # | OP882298 * | 145,175 | 78,580 | 24,862 | 16,871 | 38.13 | 36.25 | 43.08 | 32.32 | 134 (19) | 85 (6) | 37 (7) | 8 (4) | 4 (2) |
| C. expansa subsp. Fragilis # | OP882299 * | 144,969 | 78,449 | 24,856 | 16,808 | 38.30 | 36.51 | 43.14 | 32.4 | 134 (19) | 85 (6) | 37 (7) | 8 (4) | 4 (2) |
| C. volkensii # | OP882300 * | 144,855 | 78,303 | 24,878 | 16,796 | 38.32 | 36.51 | 43.15 | 32.4 | 134 (19) | 85 (6) | 37 (7) | 8 (4) | 4 (2) |
† These species belong to subgenus Crassula. #, These speciesbelong to subgenus Disporocarpa. *, The new plastomes were generated in this study. (n), The number of genes located on IRs.
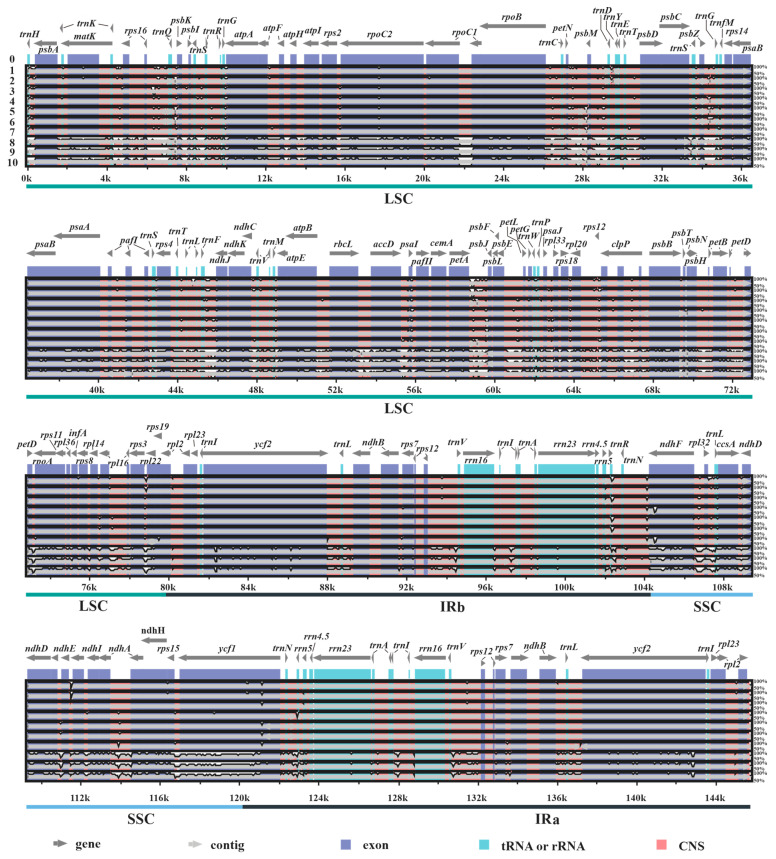
Furthermore, based on the results obtained with mVISTA, in all plastomes investigated it was found that the IR and coding regions (exons, tRNAs, and rRNAs) are more conserved than SC and conserved non-coding regions (CNS), respectively (Figure 2). Additionally, the results also revealed that 3 plastomes (labelled 8–10) of subgenus Disporocarpa exhibited higher divergences than 7 plastomes (labelled 1–7) of subgenus Crassula, when compared with the reference.
Figure 2.
Structure comparisons of ten new Crassula plastomes using the mVISTA program. Y-scale represents the percent identity between 50% and 100%. The labels 0 to 10 indicate C. perforata (reference), C. alstonii, C. columella, C. dejecta, C. mesembryanthoides, C. tecta, C. mesembrianthemopsis, C. socialis, C. volkensii, C. expansa subsp. fragilis, and C. deltoidei, respectively.
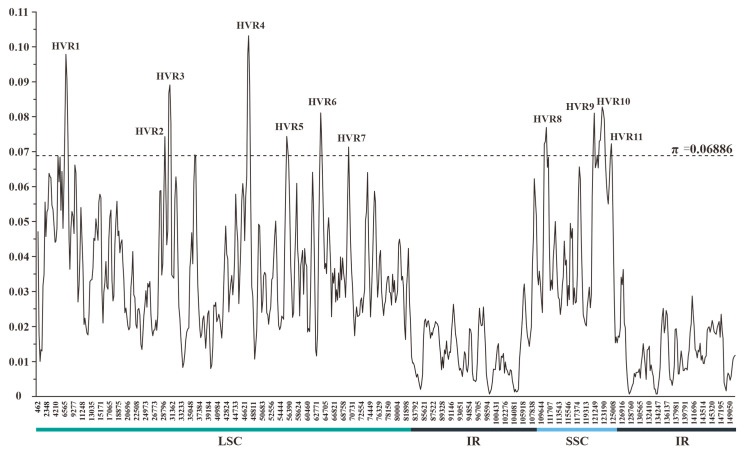
The sliding-window-based π values estimated for 11 plastomes of Crassula ranged from 0.00073 to 0.10315 (Table S2 and Data S2). The mean π value and its standard deviation were 0.02978 and 0.01954, respectively. Thus, a total of 11 HVRs were identified with relatively high variability (π > 0.06886) (Figure 3). These HVRs containing high π values (0.06912–0.08653) and abundant variable sites (111–559) might be used as potential DNA barcodes for species identification within Crassula (Table 2).
Figure 3.
Sliding-window analysis of the plastomes of 11 Crassula species (window length: 600 bp; step size: 200 bp). x-axis: position of the midpoint of a window; y-axis: π value of each window. Regions with higher π values (π > 0.06886) were considered as HVRs.
Table 2.
The HVRs identified in the plastomes of 11 Crassula species.
| HVR | Coordinates | Region Size (bp) | π Value | Variable Sites | Annotations |
|---|---|---|---|---|---|
| HVR1 | 6259–8197 | 1939 | 0.07521 | 240 | rps16–trnQ-UUG |
| HVR2 | 28,684–29,678 | 995 | 0.07427 | 119 | petN–psbM |
| HVR3 | 29,942–31,262 | 1321 | 0.07064 | 182 | psbM–trnD-GUC–trnY-GUA |
| HVR4 | 35,624–36,637 | 1014 | 0.06912 | 114 | psbZ–trnG-GCC |
| HVR5 | 47,003–48,289 | 1287 | 0.08653 | 223 | trnL-UAA–trnF-GAA–ndhJ |
| HVR6 | 55,345–56,290 | 946 | 0.07518 | 158 | rbcL–accD |
| HVR7 | 63,273–64,156 | 884 | 0.07652 | 164 | psbE–petL |
| HVR8 | 69,495–70,212 | 718 | 0.07133 | 111 | clpP–psbB |
| HVR9 | 109,945–111,098 | 1154 | 0.06969 | 192 | ndhF–rpl32–trnL-UAG |
| HVR10 | 120,441–123,490 | 3050 | 0.07259 | 559 | rps15–ycf1 |
| HVR11 | 124,303–124,908 | 606 | 0.07227 | 119 | ycf1 |
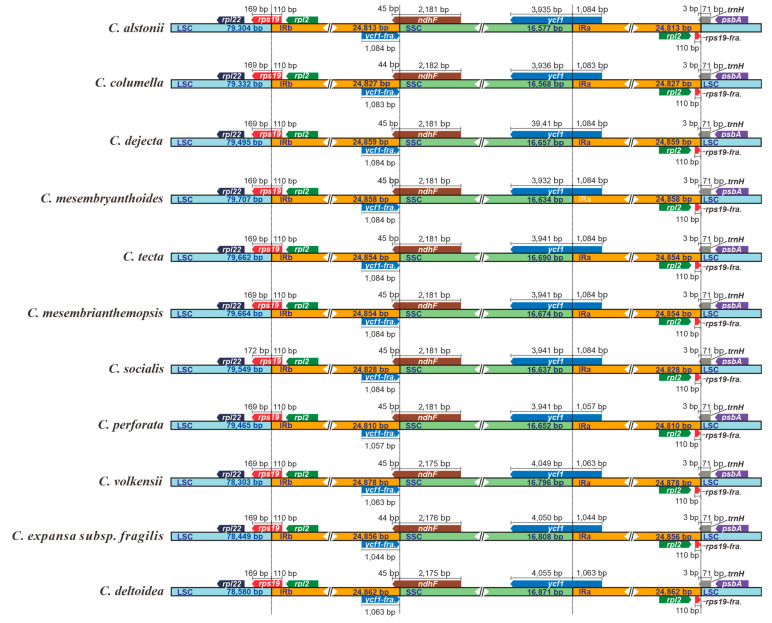
In our current study, all 11 plastomes of Crassula displayed similar IR junction patterns (Figure 4). The SSC/IRa borders are located in the coding regions of ycf1 gene, resulting in the fragmentations of ycf1 (ycf1-fragment) in IRb regions. Moreover, ndhF genes were discovered to occur mainly in SSC, and partly in IRb, regions. Notably, rps19 genes are located at the LSC/IRb junctions, with extension into the IRb regions for 110 bp. Similarly, trnH genes lie at the IRa/LSC junctions, with uniform 3 bp-sized expansions to the IRa regions.
Figure 4.
Comparisons of LSC, SSC, and IR region borders among plastomes of 11 Crassula species. Blue, orange and green blocks represent the LSC, IR and SSC regions, respectively. Gene boxes represented above the block were transcribed clockwise and those represented below the block were transcribed clockwise. “fra.” is the abbreviation of “fragment”.
3.2. Codon Usage and Aversion Patterns
To compare the patterns of codon usage and aversion between Crassula and other Crassulaceae species, four analyses (RSCU, ENC, PR2-plot, and codon aversion motif) of 53 plastid genes (length ≥300 bp) were performed.
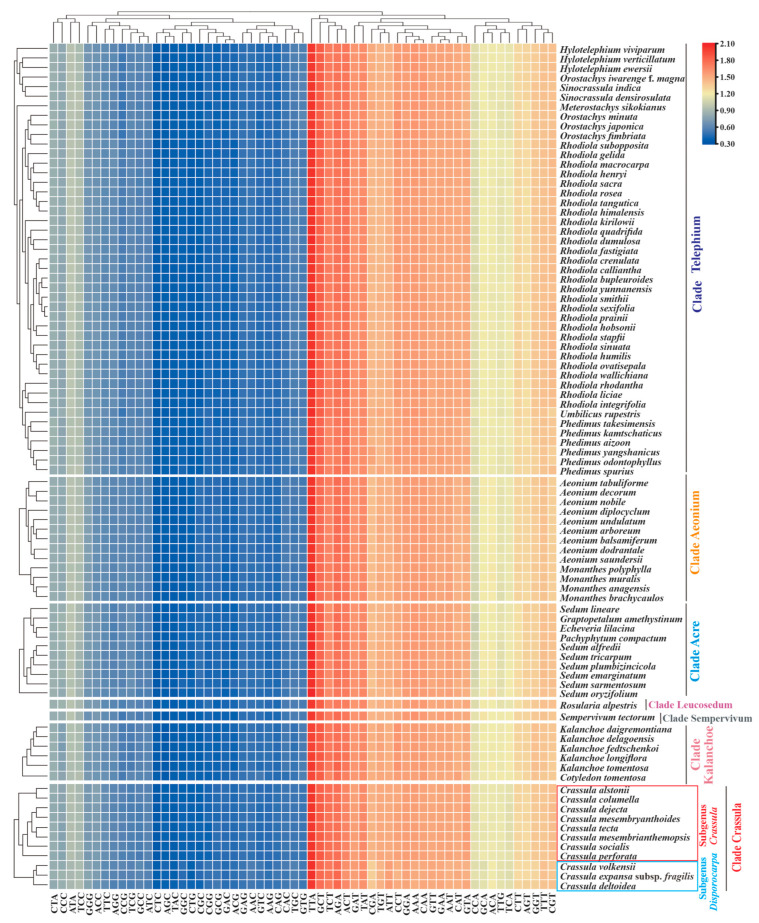
The overall RSCU values ranged from 0.32 (CTC or AGC) to 2.07 (TTA) among Crassulaceae species (Table S3). Similar with other Crassulaceae species, seven taxa of Crassula exhibited significant preference for A/T-ending codons over G/C-ending codons in plastid genes (Figure 5). Importantly, the RSCU heatmap showed two subgenera within the Crassula: subgenus Disporocarpa included C. expansa subsp. fragilis, C. deltoidea and C. volkensii; subgenus Crassula consisted of the remaining eight taxa (Figure 5).
Figure 5.
The heatmap of overall RSCU values among 7 clades of Crassulaceae species based on 53 concatenated plastid genes (length ≥300 bp). The x-axis: the cluster of different codons; y-axis: the clusters of species.
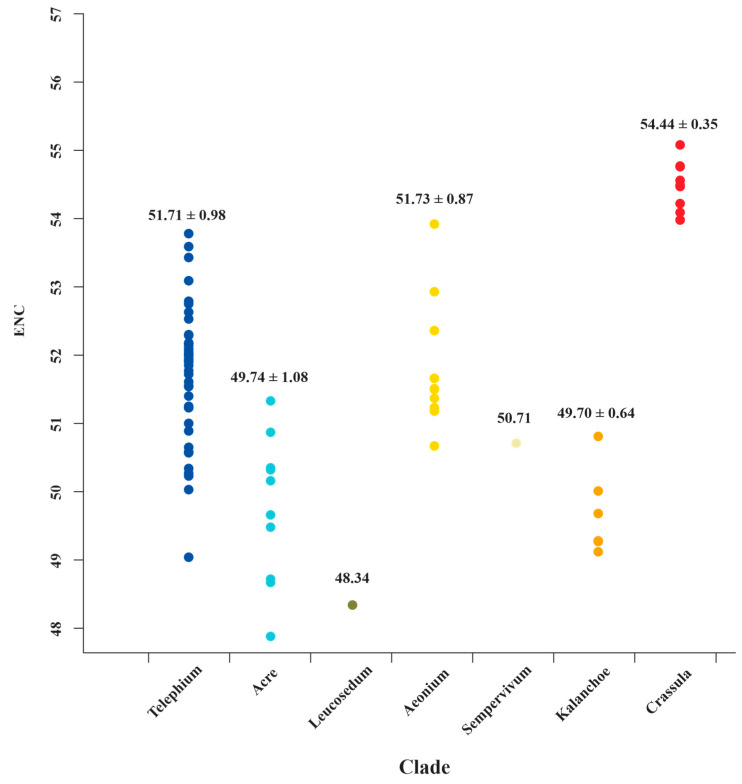
The ENC values ranged from 30.83 (ndhC in Sedum sarmentosum Bunge) to 57.74 (ndhJ in C. volkensii and C. expansa subsp. fragilis) among Crassulaceae species (Table S4). Generally, ENC values ≤35 indicate high codon preference [52,61,62]. The results show that most of the ENC values (99.48%) were higher than 35, indicating a weaker bias. Most surprisingly of all, we detected the ENC values of matK, from the Crassula clade, are significantly higher than those of all other clades (Table S4 and Figure 6). It might prove to be a unique feature for Crassula species. To further verify this finding, more sampling data and comprehensive analyses are need in future studies.
Figure 6.
The ENC value distributions of matK for 7 clades of Crassulaceae. The mean values with standard deviations are labeled.
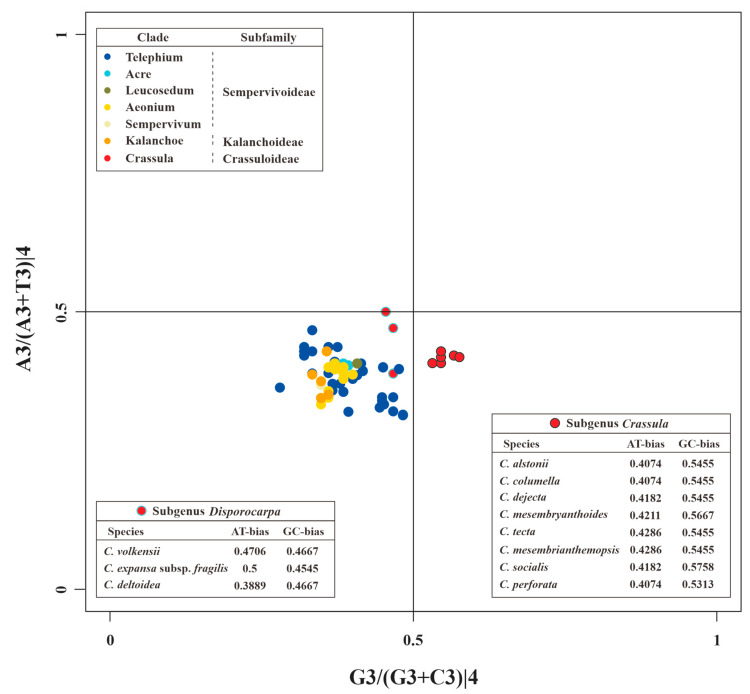
The PR2 plots of matK and 52 other PCGs are presented in Figure 7 and Figure S1, respectively. These results indicated the nucleotide usage at the 3rd codon site of 4-fold degenerate codons is uneven in different genes. For example, rps14, clpP, psbA, and pafII prefer to use A/G, A/C, T/C, and T/G in 4-fold degenerate sites, respectively (Figure S1). In addition, these unbalanced utilizations were also found in different species (Figure S1). Obviously divergent GC-biases were observed in matK genes between species of subgenus Crassula and others. Specifically, all GC-biases of clades from Kalanchoideae and Sempervivoideae, plus subgenus Disporocarpa, were less than 0.5. On the contrary, all these values for the subgenus Crassula were higher than 0.5, which might be unique characteristic for subgenus Crassula. Moreover, species with close relationships had identical nucleotide biases. For example, C. alstonii and C. columella had identical AT-biases (0.4074) and GC-biases (0.5455). Similar phenomena could also be observed in C. mesembryanthoides and C. tecta (AT-biases = 0.4286, and GC-biases = 0.5455).
Figure 7.
The PR2 plot of matK of Crassulaceae. Different colors represent different clades. Within the clade Crassula (or genus Crassula), red circles with black edges and cyan edges represent species of subgenus Crassula and Disporocarpa, respectively.
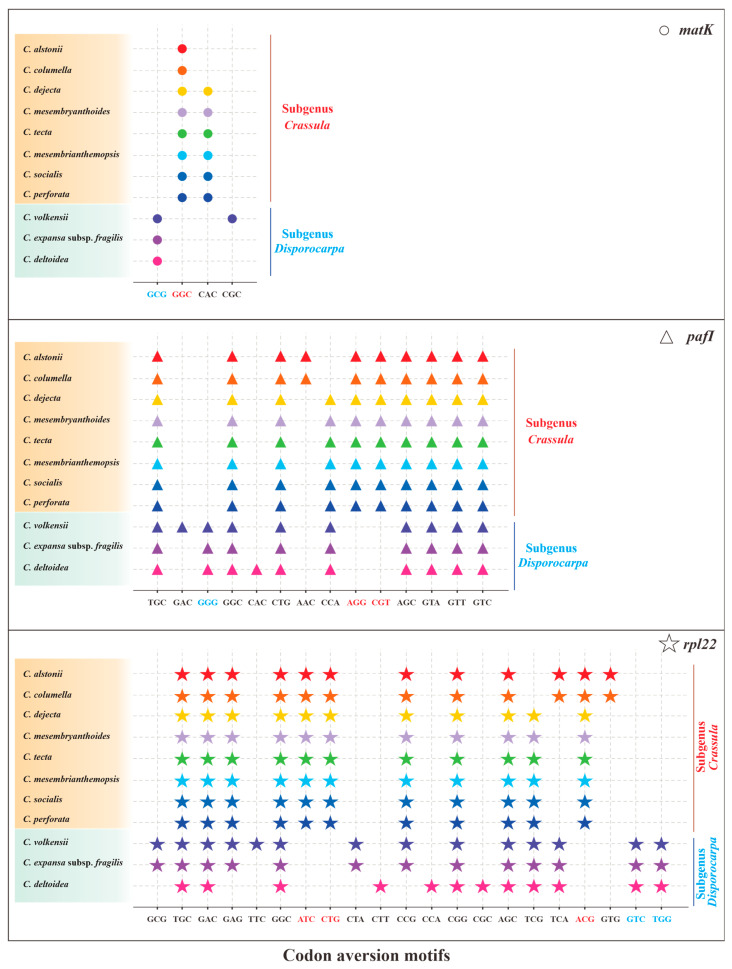
Owing to the codon aversion motifs containing phylogenetic implication, we analyzed codon aversion patterns of genes among Crassulaceae species. Except for rpoB, rpoC2, ycf1 and ycf2, codon aversion motifs were found in the remaining 49 genes (Table S5). It is worth noting that 27 and 16 unique codon aversion motifs were detected for species of subgenus Crassula and subgenus Disporocarpa, respectively (Table 3), which might be used as potential biomarkers for species identification. Further to this, 8 consensus motifs might be considered as the feature of genus Crassula (Table 3). Moreover, the codon aversion motifs from 3 genes (matK, pafI and rpl22) could also divide 11 species into two subgenera (subgenus Crassula and subgenus Disporocarpa) (Figure 8), which is congruent with results from RSCU heatmap.
Table 3.
The specific codon aversion motifs of Crassula within Crassulaceae.
| Gene | Specific Codon Aversion Motifs | ||
|---|---|---|---|
| Subgenus Crassula | Subgenus Disporocarpa | Consensus for Genus Crassula | |
| accD | TGC | ||
| atpB | TGT | CGG | |
| atpI | TGT, CTG, CTA, | ||
| cemA | GGG | ||
| ccsA | GGC | ||
| ndhA | CAT, CCG, CAG, CGG | CAT, CCG | CAT, CCG |
| ndhE | CTC | ||
| ndhI | TCT | TCT | TCT |
| ndhJ | TGT, ACG | ||
| ndhK | TGC, CAC, CTG | TGC, CAC, CTG | TGC, CAC, CTG |
| pafII | AAG | AAG | AAG |
| petB | AAC, AGA | CAG | |
| petD | GGC | GCC | |
| psbB | CGA | ||
| psbD | ACG | ||
| rbcL | GCG, CCC, AGG | ||
| rpl16 | GAT | GAT | GAT |
| rpl20 | TGT | ||
| rps3 | GCG, GTC | ||
| rps4 | TCT | CGG | |
Figure 8.
The specific codon aversion motifs of matK, pafI and rpl22 gene for the 11 species of Crassula. The dots marked in different colors represent different species. Codons in red and green were specific for subgenus Crassula and subgenus Disporocarpa, respectively.
3.3. Evolutionary Rates and Patterns
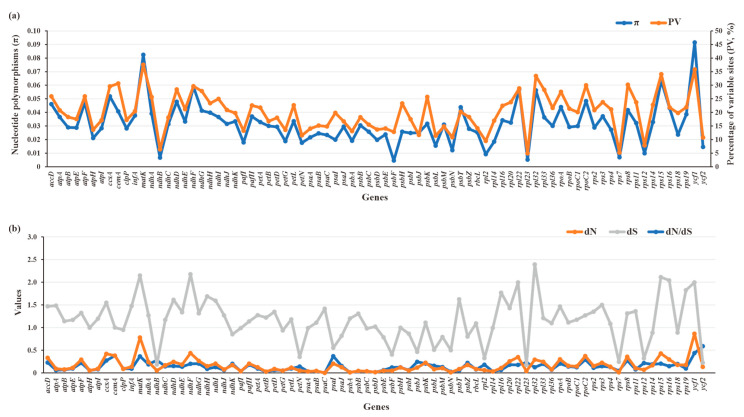
The π (0.00447–0.0914) and PV (4.91–37.52%) values of 79 plastid PCGs of Crassulaceae species were plotted in Figure 9a. Two genes, referring to ycf1 (π = 0.0914, PV = 35.78%) and matK (π = 0.08239, PV = 37.52%), had obviously higher π and PV values than those of the other 77 genes, indicating they might accumulate more mutations than other plastid genes. The detailed data are listed in Table S6.
Figure 9.
Sequence polymorphism among 79 PCGs of 87 Crassulaceae species. (a) Nucleotide diversity (π) and percentages of variable sites (PV). (b) Estimations of nonsynonymous (dN) and synonymous (dS) substitution rates and the dN/dS.
To further quantify the evolutionary rates of PCGs, the nucleotide substitution rates, including dN, dS and dN/dS, were calculated (Figure 9b, Table S6). The dN values ranged from 0 to 0.8671, with higher dN values for ycf1 (dN = 0.8671) and matK (dN = 0.7804) than for others. Compared with dN values, the dS values had relatively wide ranges (0.177–2.3917), resulting in corresponding dN/dS ratios (0–0.5891) of less than 1. This finding indicates the plastid genes from Crassulaceae appear to be evolving under a purifying selective constraint. Among 79 plastid PCGs, ycf2 is the most rapidly evolving gene, with the highest ratio (dN/dS = 0.5891), followed by ycf1, cemA, psaI, and matK. By contrast, psaC was the most conserved gene with the lowest ratio (dN/dS = 0).
3.4. Phylogenetic Implications
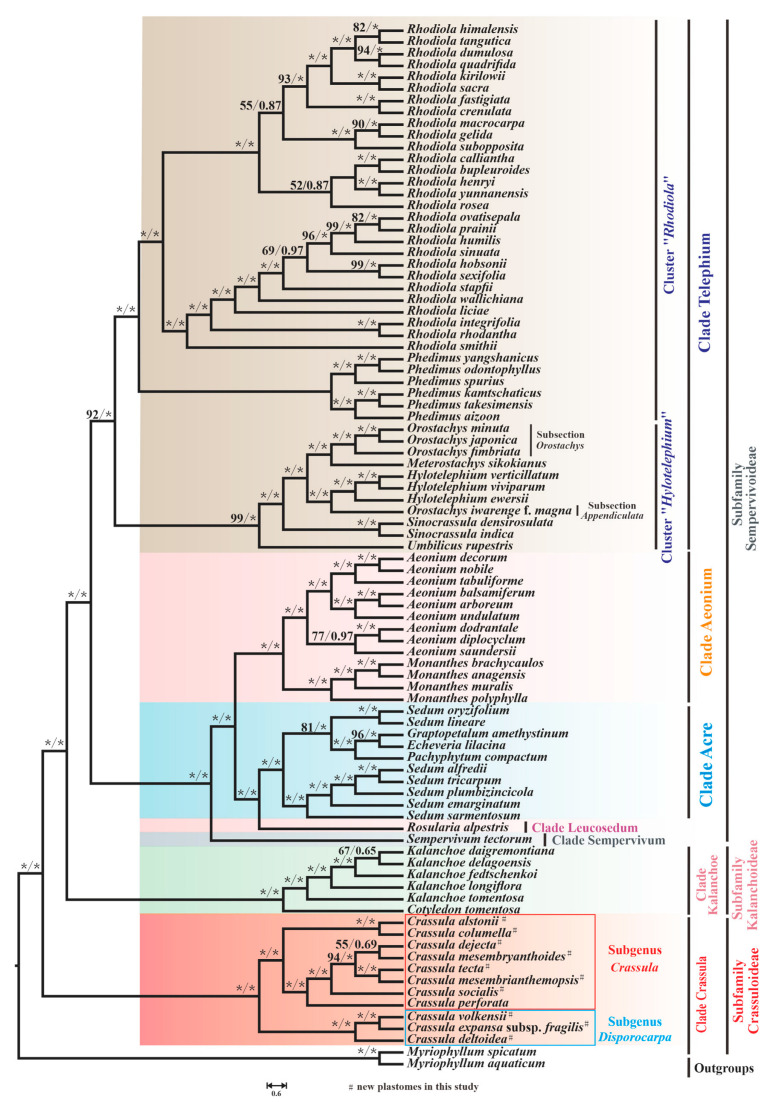
To investigate the evolutionary relationships among 87 species of Crassulaceae, phylogenetic analyses were performed. After a model test, GTR + G4 and GTR + I+G4 were inferred as the optimal substitution models for most genes (the detailed models can be seen in Table S7). As shown in Figure 10, the trees inferred from two methods displayed the same topology.
Figure 10.
The phylogenetic tree of 87 Crassulaceae species based on ML and BI methods. The maximum likelihood bootstrap (BS) and Bayesian posterior probability (PP) values for each node are indicated; * indicates 100% bootstrap or 1.00 PP.
Ten species of Crassula that we sequenced, together with C. perforate, form the well-supported clade Crassula, which is sister to all other Crassulaceae species (maximum likelihood bootstrap [BS] = 100 and bayesian posterior probability [PP] = 1.00). In addition, our phylogenetic tree indicated that this monophyletic clade could be clustered into two subgenera: subgenus Disporocarpa harbored C. volkensii, C. expansa subsp. fragilis and C. deltoidea ([BS] = 100 and [PP] = 1.00). Subgenus Crassula included the remaining eight Crassula species (C. alstonii, C. columella, C. dejecta, C. mesembryanthoides, C. tecta, C. mesembrianthemopsis, C. socialis, and C. perforata) ([BS] = 100 and [PP] = 1.00). Within subgenus Crassula, two species (C. alstonii and C. columella) were sister to six other species (C. dejecta, C. mesembryanthoides, C. tecta, C. mesembrianthemopsis, C. socialis, and C. perforata) ([BS] = 100 and [PP] = 1.00). Further, C. tecta and C. mesembrianthemopsis formed the well-supported sister taxa ([BS] = 100 and [PP] = 1.00). Unfortunately, the sister group of C. dejecta and C. mesembryanthoides had relatively weak support ([BS] = 55 and [PP] =0.69). Due to the limited plastome data within Crassula, there are many unsolved phylogenetic problems in this clade. Therefore, more samples are needed to solve this issue.
As expected, the six species from genus Kalanchoe Adans. and genus Cotyledon L. formed the monophyletic clade Kalanchoe (or subfamily Kalanchoideae) ([BS] = 100 and [PP] = 1.00). The remaining 70 species, belonging to the subfamily Sempervivoideae, can be further grouped into 5 distinct clades: Acre, Aeonium, Leucosedum, Sempervivum, and Telephium. In detail, 7 Sedum L. species and 3 species from other genera respectively (Graptopetalum Rose, Echeveria DC., and Pachyphytum Link, Klotzsch & Otto) formed a well-supported clade Acre ([BS] = 100 and [PP] = 1.0). However, it is clear from our results that Sedum is not monophyletic, with some other taxa embedded within this genus.
In addition, 13 species from genus Aeonium Webb & Berthel. and genus Monanthes Haw. make up the clade Aeonium ([BS] = 100 and [PP] = 1.0). Furthermore, due to sampling in this study, only a single species form Leucosedum and Sempervivum clades, and full resolution of relationships within these clades requires sufficient molecular sequences. Notably, the clade Telephium, with 45 species, consists of clusters “Rhodiola” and “Hylotelephium” [63] ([BS] = 92 and [PP] = 1.0). Within cluster “Hylotelephium“, non-monophyly of Orostachys Fisch. was observed. Three Orostachys species, (O. japonica (Maxim.) A.Berger, O. minuta (Kom.) A.Berger, and O. fimbriata (Turcz.) A.Berger) belonging to the Subsection Orostachys [63] ([BS] = 100 and [PP] = 1.0), were sister to Meterostachys sikokianus (Makino) Nakai, while O. iwarenge f. magna Y.N.Lee (Subsection Appendiculata) and three Hylotelephium H.Ohba species formed a group with strong support ([BS] = 100 and [PP] = 1.0).
4. Discussion
Ten new plastomes of Crassula were reported in the present study. Combined with available data from public database, we conducted comprehensive analyses, including plastome organizations, codon usage and aversion patterns, evolutionary rates, and phylogenetic implications.
The expansion and contraction of IR regions are common evolutionary events and have been considered as the main mechanism for the length variation of angiosperm plastomes [64,65,66]. In our study, we performed comparative analyses among Crassula plastomes, and found that the IRb regions had uniform length (110 bp) expansions to the rps19 gene. This 110-bp expansion had been also observed in Aeonium, Monanthes, and most other taxa of Crassulaceae in our recent study [17]. This finding indicated that the conserved IR organization might act as a family-specific marker for Crassulaceae species.
Interestingly, it was reported that rps19 genes were completely located in the LSC regions in Forsythia suspensa (Thunb.) Vahl, Olea europaea Hoffmanns. & Link L., and Quercus litseoides Dunn [67,68], and were fully encoded by the IR regions in Polystachya adansoniae Rchb.f., Polystachya bennettiana Rchb.f., and Dracaena cinnabari Balf.f. [69,70]. There are several mechanisms that might explain the IR expansion and contraction [71,72,73]. For instance, Goulding et al. [71] proposed that short IR expansions may occur by gene conversion events, whereas large IR expansions involved in double-strand DNA breaks. In order to better reveal the mechanisms of IR expansion and contraction, more extensive investigations in Crassulaceae and Saxifragales are required.
Investigations of codon usage patterns could reveal phylogenetic relationships between organisms [25,74]. In particular, 11 species of Crassula can be divided into two subgenera from the RSCU heatmap, which agreed with the results of phylogenetic analyses. This finding further demonstrates that RSCU values contain phylogenetic implications [75,76,77,78,79,80]. Additionally, we observed codon usage patterns are gene-specific and/or species-specific, reflected in diversified ENC values and various distribution patterns in PR2 plots. Interestingly, we found the codon usage patterns of matK gene in Crassula species are unique among Crassulaceae species with elevated ENC values. Furthermore, the GC-biases of matK gene with specific preference (>0.5) might be the particular feature for subgenus Crassula. Due to rapid evolutionary rate, high universality, and significant interspecific divergence, the matK gene has been broadly used in plant evolutionary studies as one of the core DNA barcodes [9,10,81,82,83,84].
Codon aversion, a novel concept proposed by Miller et al. [29,30,31], is an informative character in phylogenetics. Specifically, the codon aversion motifs in orthologous genes are generally conserved in specific lineages [29,30,31]. To date, these analyses have only been performed in a few plant plastomes [17,26]. For example, the specific codon aversion motifs of rpoA gene could distinguish not only the two genera (Aeonium and Monanthes), but also the three subclades of Aeonium in our recent report [17]. In this work, genus-specific and subgenus-specific codon aversion motifs were identified for 11 Crassula species. These findings suggest codon aversion pattern could be used as a promising tool for phylogenetic study.
Generally, the dN/dS ratios of genes could reflect the extent of selection pressures during evolution [22]. Here, the dN/dS values of plastid PCGs ranged from 0 to 0.5891 within Crassulaceae, indicating all plastid genes were under purifying selection. Among these values, elevated dN/dS ratios were found for ycf1 (0.4349) and ycf2 (0.5891). Similarly, high dN/dS ratios of these two genes were also observed in other families, such as Asteraceae Bercht. & J.Presl [38], Mazaceae Reveal [22], and Musaceae Juss. [13]. The ycf1 gene was related to protein translocation [85]. The ycf2 gene is necessary for cell viability, but the detail function is still unknown [86]. Why ycf1 and ycf2 evolve relatively fast is interesting. The possible reason put forwarded by Barnard-Kubow et al. [87] considered that relaxed purifying selection or positive selection on ycf1, ycf2 and some other genes might result in the development of reproductive isolation and subsequent speciation in plants. Therefore, the results suggested that ycf1 and ycf2 might play important roles in the divergence of Crassulaceae.
Our phylogenetic tree divided 87 species into 3 subfamilies and 7 clades. The clade Crassula is sister to all other 6 clades, which agrees with the phylogeny reported by Gontcharova et al. [4], Chang et al. [6], and Han et al. [17]. Furtherly, 11 Crassula species could be furtherly divided into two subgenera, which generally accords with the morphological differences (floral shape) reported by Bruyns et al. [10] (Table S8). Nevertheless, there are still some unsolved phylogenetic problems within Crassulaceae. The first problem is that the plastid phylogeny of Crassula is not entirely clear due to the limited data. According to the classification proposed by Tölken [11,88], 11 and 9 sections were respectively identified in subgenus Crassula and subgenus Disporocarpa. However, Bruyns et al. [10] indicated that most sections were not monophyletic. Moreover, subgenus Disporocarpa recently has been regarded as a paraphyletic group [9,10]. The second is the genus Sedum, which is not monophyletic in our study, agreeing with the widely accepted viewpoint [3,4,5,89,90]. Finally, the genus Orostachys has been demonstrated to be non-monophyletic based on plastid data, which is consistent with previous analysis based on nuclear internal transcribed spacers (ITS) data [63]. In order to better understand the phylogeny of Crassula or Crassulaceae, more data are needed for the further detailed analyses.
5. Conclusions
In the present study, 10 new plastomes of Crassula species were reported. These plastomes exhibited identical gene content and order, and that they contained 134 genes (130 functional gene and 4 pseudogenes). The 11 identified HVRs with relatively high variability (π > 0.06886) might be used as potential DNA barcodes for species identification within Crassula. The unique expansion pattern, where the IRb regions had uniform length (110 bp) boundary expansions to rps19, might become a plesiomorphy of Crassulaceae. According to RSCU values, the A/T-ending codons were favored in plastid genes. Most importantly, we found the codon usage patterns of the matK gene in Crassula species are unique among Crassulaceae species with elevated ENC values. Furthermore, subgenus Crassula species have specific GC-biases in the matK gene. In addition, the codon aversion motifs from matK, pafI and rpl22 contained phylogenetic implications within Crassula. Compared with other Crassulaceae species, 27 and 16 unique codon aversion motifs were detected for subgenus Crassula and subgenus Disporocarpa, respectively. Additionally, the evolutionary rates analyses indicated all plastid genes of Crassulaceae were under purifying selection. Among these genes, ycf1 (dN/dS = 0.4349) and ycf2 (dN/dS = 0.5891) were the most rapidly evolving genes, whereas psaC (dN/dS = 0) was the most conserved gene. Finally, our phylogenetic analyses strongly supported Crassula is sister to all other Crassulaceae species. Our results will be benefit for further evolutionary studies within the Crassula and Crassulaceae.
Acknowledgments
We kindly acknowledge three anonymous reviewers for the fruitful and critical comments.
Supplementary Materials
The following supporting information can be downloaded at: https://www.mdpi.com/article/10.3390/biology11121779/s1, Figure S1: PR2 plots of 52 plastid genes; Table S1: Accession numbers of Crassulaceae plastomes sampled in this study; Table S2: The sliding window-based π values estimated by 11 plastomes of Crassula; Table S3: The RSCU values of codons among Crassulaceae species; Table S4: The ENC values of 53 plastid genes of Crassulaceae; Table S5: Plastid codon aversion motifs among Crassulaceae species; Table S6: Evolutionary rates of 79 plastid genes of Crassulaceae; Table S7: The best evolutionary models for 79 plastid genes; Table S8: The morphological characteristics of 11 Crassula species; Data S1: Phylogenetic datasets of 79 plastid genes; Data S2: Sequence matrix of 11 plastomes of Crassula for sliding-window analysis.
Author Contributions
Conceptualization, supervision, and project administration, X.K.; resources and validation, L.W. and D.B.; data curation, Y.Y. and J.G.; investigation and formal analysis, S.Z. and J.Y.; software, S.H. and R.Y.; methodology and writing—original draft, H.D.; funding acquisition, H.D., D.B. and X.K; writing—review & editing, X.K. All authors have read and agreed to the published version of the manuscript.
Institutional Review Board Statement
Not applicable.
Informed Consent Statement
Not applicable.
Data Availability Statement
The sequence data generated in this study are available in GenBank of the National Center for Biotechnology Information (NCBI) under the access numbers: OP729482–OP729487 and OP882297–OP882300.
Conflicts of Interest
The authors declare no conflict of interest.
Funding Statement
This study was supported by the Opening Foundation of National Engineering Laboratory of Soil Pollution Control and Remediation Technologies, and Key Laboratory of Heavy Metal Pollution Prevention & Control, Ministry of Agriculture and Rural Affairs (Grant no. NEL&MARA-003), the Basic Research Program (Natural Science Foundation) of Jiangsu Province (Grant no. BK20211078), and the Scientific Research Project Foundation of Postgraduate of the Anhui Higher Education Institutions of China (Grant no. YJS20210136).
Footnotes
Publisher’s Note: MDPI stays neutral with regard to jurisdictional claims in published maps and institutional affiliations.
References
- 1.Thiede J., Eggli U. Crassulaceae. In: Kubitzki K., editor. The Families and Genera of Vascular Plants. Springer; Berlin/Heidelberg, Germany: 2007. pp. 83–118. [Google Scholar]
- 2.Smith G.F., Figueiredo E., Van Wyk A.E. Kalanchoe (Crassulaceae) in Southern Africa: Classification, Biology, and Cultivation. Academic Press; London, UK: 2019. [Google Scholar]
- 3.Messerschmid T.F., Klein J.T., Kadereit G., Kadereit J.W. Linnaeus’s folly–phylogeny, evolution and classification of Sedum (Crassulaceae) and Crassulaceae subfamily Sempervivoideae. Taxon. 2020;69:892–926. doi: 10.1002/tax.12316. [DOI] [Google Scholar]
- 4.Gontcharova S., Gontcharov A. Molecular phylogeny and systematics of flowering plants of the family Crassulaceae DC. Mol. Biol. 2009;43:794–803. doi: 10.1134/S0026893309050112. [DOI] [PubMed] [Google Scholar]
- 5.Mort M., O’Leary T., Carrillo-Reyes P., Nowell T., Archibald J., Randle C. Phylogeny and evolution of Crassulaceae: Past, present, and future. Schumannia. 2010;6:69–86. [Google Scholar]
- 6.Chang H., Zhang L., Xie H., Liu J., Xi Z., Xu X. The Conservation of Chloroplast Genome Structure and Improved Resolution of Infrafamilial Relationships of Crassulaceae. Front. Plant Sci. 2021;12:631884. doi: 10.3389/fpls.2021.631884. [DOI] [PMC free article] [PubMed] [Google Scholar]
- 7.Eggli U. In: Illustrated Handbook of Succulent Plants: Crassulaceae. Eggli U., editor. Springer; Berlin/Heidelberg, Germany: 2003. [Google Scholar]
- 8.Van Ham R.C., Hart H.T. Phylogenetic relationships in the Crassulaceae inferred from chloroplast DNA restriction-site variation. Am. J. Bot. 1998;85:123–134. doi: 10.2307/2446561. [DOI] [PubMed] [Google Scholar]
- 9.Lu M., Fradera-Soler M., Forest F., Barraclough T.G., Grace O.M. Evidence linking life-form to a major shift in diversification rate in Crassula. Am. J. Bot. 2022;109:272–290. doi: 10.1002/ajb2.1797. [DOI] [PubMed] [Google Scholar]
- 10.Bruyns P., Hanáček P., Klak C. Crassula, insights into an old, arid-adapted group of southern African leaf-succulents. Mol. Phylogenet. Evol. 2019;131:35–47. doi: 10.1016/j.ympev.2018.10.045. [DOI] [PubMed] [Google Scholar]
- 11.Tölken H.R. A revision of the genus Crassula in southern Africa. Contrib. Bolus. Herb. 1977;8:1–595. [Google Scholar]
- 12.Mort M.E., Randle C.P., Burgoyne P., Smith G., Jaarsveld E., Hopper S.D. Analyses of cpDNA matK sequence data place Tillaea (Crassulaceae) within Crassula. Plant Syst. Evol. 2009;283:211–217. doi: 10.1007/s00606-009-0227-z. [DOI] [Google Scholar]
- 13.Pandey A., Chaudhary S., Bhat B. The Potential Role of Plastome Copy Number as a Quality Biomarker for Plant Products using Real-time Quantitative Polymerase Chain Reaction. Curr. Genom. 2022;23:289–298. doi: 10.2174/1389202923666220513111643. [DOI] [PMC free article] [PubMed] [Google Scholar]
- 14.Wicke S., Schneeweiss G.M., Depamphilis C.W., Müller K.F., Quandt D. The evolution of the plastid chromosome in land plants: Gene content, gene order, gene function. Plant Mol. Biol. 2011;76:273–297. doi: 10.1007/s11103-011-9762-4. [DOI] [PMC free article] [PubMed] [Google Scholar]
- 15.Ren W., Guo D., Xing G., Yang C., Zhang Y., Yang J., Niu L., Zhong X., Zhao Q., Cui Y. Complete chloroplast genome sequence and comparative and phylogenetic analyses of the cultivated Cyperus esculentus. Diversity. 2021;13:405. doi: 10.3390/d13090405. [DOI] [Google Scholar]
- 16.Jian H.-Y., Zhang Y.-H., Yan H.-J., Qiu X.-Q., Wang Q.-G., Li S.-B., Zhang S.-D. The complete chloroplast genome of a key ancestor of modern roses, Rosa chinensis var. spontanea, and a comparison with congeneric species. Molecules. 2018;23:389. doi: 10.3390/molecules23020389. [DOI] [PMC free article] [PubMed] [Google Scholar]
- 17.Han S., Bi D., Yi R., Ding H., Wu L., Kan X. Plastome evolution of Aeonium and Monanthes (Crassulaceae): Insights into the variation of plastomic tRNAs, and the patterns of codon usage and aversion. Planta. 2022;256:35. doi: 10.1007/s00425-022-03950-y. [DOI] [PubMed] [Google Scholar]
- 18.Ravi V., Khurana J., Tyagi A., Khurana P. An update on chloroplast genomes. Plant Syst. Evol. 2008;271:101–122. doi: 10.1007/s00606-007-0608-0. [DOI] [Google Scholar]
- 19.Yang X., Huang Y., Li Z., Chen J. Complete plastid genome of Primula calliantha Franch.(Primulaceae): An alpine ornamental plant endemic to Hengduan Mountain, China. Mitochondrial DNA Part B. 2021;6:2643–2645. doi: 10.1080/23802359.2021.1963868. [DOI] [PMC free article] [PubMed] [Google Scholar]
- 20.Yin X., Qian C., Yan X., Fang T., Fan X., Zhou S., Ma X.-F. Will the artificial populations be sustainable? A genetic assessment on Caragana korshinskii afforestation in the semiarid regions of North China. Eur. J. For. Res. 2022;141:105–116. doi: 10.1007/s10342-021-01425-5. [DOI] [Google Scholar]
- 21.Zhou H., He W., Liu X., Tembrock L.R., Wu Z., Xu D., Liao X. Comparative Analyses of 35 Complete Chloroplast Genomes from the Genus Dalbergia (Fabaceae) and the Identification of DNA Barcodes for Tracking Illegal Logging and Counterfeit Rosewood. Forests. 2022;13:626. [Google Scholar]
- 22.Zeng S., Li J., Yang Q., Wu Y., Yu J., Pei X. Comparative plastid genomics of Mazaceae: Focusing on a new recognized genus, Puchiumazus. Planta. 2021;254:99. doi: 10.1007/s00425-021-03753-7. [DOI] [PubMed] [Google Scholar]
- 23.Tian X., Guo J., Zhou X., Ma K., Ma Y., Shi T., Shi Y. Comparative and Evolutionary Analyses on the Complete Plastomes of Five Kalanchoe Horticultural Plants. Front. Plant Sci. 2021;12:705874. doi: 10.3389/fpls.2021.705874. [DOI] [PMC free article] [PubMed] [Google Scholar]
- 24.Ding H., Zhu R., Dong J., Bi D., Jiang L., Zeng J., Huang Q., Liu H., Xu W., Wu L. Next-Generation Genome Sequencing of Sedum plumbizincicola Sheds Light on the Structural Evolution of Plastid rRNA Operon and Phylogenetic Implications within Saxifragales. Plants. 2019;8:386. doi: 10.3390/plants8100386. [DOI] [PMC free article] [PubMed] [Google Scholar]
- 25.Parvathy S.T., Udayasuriyan V., Bhadana V. Codon usage bias. Mol. Biol. Rep. 2022:539–565. doi: 10.1007/s11033-021-06749-4. [DOI] [PMC free article] [PubMed] [Google Scholar]
- 26.Han S., Wang R., Hong X., Wu C., Zhang S., Kan X. Plastomes of Bletilla (Orchidaceae) and Phylogenetic Implications. Int. J. Mol. Sci. 2022;23:10151. doi: 10.3390/ijms231710151. [DOI] [PMC free article] [PubMed] [Google Scholar]
- 27.Zhang Y., Shen Z., Meng X., Zhang L., Liu Z., Liu M., Zhang F., Zhao J. Codon usage patterns across seven Rosales species. BMC Plant Biol. 2022;22:65. doi: 10.1186/s12870-022-03450-x. [DOI] [PMC free article] [PubMed] [Google Scholar]
- 28.Yang J., Ding H., Kan X. Codon usage patterns and evolution of HSP60 in birds. Int. J. Biol. Macromol. 2021;183:1002–1012. doi: 10.1016/j.ijbiomac.2021.05.017. [DOI] [PubMed] [Google Scholar]
- 29.Miller J.B., Hippen A.A., Belyeu J.R., Whiting M.F., Ridge P.G. Missing something? Codon aversion as a new character system in phylogenetics. Cladistics. 2017;33:545–556. doi: 10.1111/cla.12183. [DOI] [PubMed] [Google Scholar]
- 30.Miller J.B., McKinnon L.M., Whiting M.F., Ridge P.G. Codon use and aversion is largely phylogenetically conserved across the tree of life. Mol. Phylogenet. Evol. 2020;144:106697. doi: 10.1016/j.ympev.2019.106697. [DOI] [PubMed] [Google Scholar]
- 31.Miller J.B., McKinnon L.M., Whiting M.F., Ridge P.G. CAM: An alignment-free method to recover phylogenies using codon aversion motifs. PeerJ. 2019;7:e6984. doi: 10.7717/peerj.6984. [DOI] [PMC free article] [PubMed] [Google Scholar]
- 32.Alba M.M., Castresana J. Inverse relationship between evolutionary rate and age of mammalian genes. Mol. Biol. Evol. 2005;22:598–606. doi: 10.1093/molbev/msi045. [DOI] [PubMed] [Google Scholar]
- 33.Pajkos M., Dosztányi Z. Functions of intrinsically disordered proteins through evolutionary lenses. Prog. Mol. Biol. Transl. Sci. 2021;183:45–74. doi: 10.1016/bs.pmbts.2021.06.017. [DOI] [PubMed] [Google Scholar]
- 34.Jeffares D.C., Tomiczek B., Sojo V., Reis M.D. A beginners guide to estimating the non-synonymous to synonymous rate ratio of all protein-coding genes in a genome. Methods Mol. Biol. 2015;1201:65–90. doi: 10.1007/978-1-4939-1438-8_4. [DOI] [PubMed] [Google Scholar]
- 35.Kryazhimskiy S., Plotkin J.B. The population genetics of dN/dS. PLoS Genet. 2008;4:e1000304. doi: 10.1371/journal.pgen.1000304. [DOI] [PMC free article] [PubMed] [Google Scholar]
- 36.Li X., Li Y., Sylvester S.P., Zang M., El-Kassaby Y.A., Fang Y. Evolutionary patterns of nucleotide substitution rates in plastid genomes of Quercus. Ecol. Evol. 2021;11:13401–13414. doi: 10.1002/ece3.8063. [DOI] [PMC free article] [PubMed] [Google Scholar]
- 37.Bromham L., Hua X., Lanfear R., Cowman P.F. Exploring the relationships between mutation rates, life history, genome size, environment, and species richness in flowering plants. Am. Nat. 2015;185:507–524. doi: 10.1086/680052. [DOI] [PubMed] [Google Scholar]
- 38.Su Y., Huang L., Wang Z., Wang T. Comparative chloroplast genomics between the invasive weed Mikania micrantha and its indigenous congener Mikania cordata: Structure variation, identification of highly divergent regions, divergence time estimation, and phylogenetic analysis. Mol. Phylogenet. Evol. 2018;126:181–195. doi: 10.1016/j.ympev.2018.04.015. [DOI] [PubMed] [Google Scholar]
- 39.Tang H., Tang L., Shao S., Peng Y., Li L., Luo Y. Chloroplast genomic diversity in Bulbophyllum section Macrocaulia (Orchidaceae, Epidendroideae, Malaxideae): Insights into species divergence and adaptive evolution. Plant Divers. 2021;43:350–361. doi: 10.1016/j.pld.2021.01.003. [DOI] [PMC free article] [PubMed] [Google Scholar]
- 40.Zhang C., Li S.-Q., Xie H.-H., Liu J.-Q., Gao X.-F. Comparative plastid genome analyses of Rosa: Insights into the phylogeny and gene divergence. Tree Genet. Genomes. 2022;18:20. doi: 10.1007/s11295-022-01549-8. [DOI] [Google Scholar]
- 41.Jin J.-J., Yu W.-B., Yang J.-B., Song Y., DePamphilis C.W., Yi T.-S., Li D.-Z. GetOrganelle: A fast and versatile toolkit for accurate de novo assembly of organelle genomes. Genome Biol. 2020;21:241. doi: 10.1186/s13059-020-02154-5. [DOI] [PMC free article] [PubMed] [Google Scholar]
- 42.Tillich M., Lehwark P., Pellizzer T., Ulbricht-Jones E.S., Fischer A., Bock R., Greiner S. GeSeq–versatile and accurate annotation of organelle genomes. Nucleic Acids Res. 2017;45:W6–W11. doi: 10.1093/nar/gkx391. [DOI] [PMC free article] [PubMed] [Google Scholar]
- 43.Langmead B., Salzberg S.L. Fast gapped-read alignment with Bowtie 2. Nat. Methods. 2012;9:357–359. doi: 10.1038/nmeth.1923. [DOI] [PMC free article] [PubMed] [Google Scholar]
- 44.Zheng S., Poczai P., Hyvönen J., Tang J., Amiryousefi A. Chloroplot: An online program for the versatile plotting of organelle genomes. Front. Genet. 2020;11:576124. doi: 10.3389/fgene.2020.576124. [DOI] [PMC free article] [PubMed] [Google Scholar]
- 45.Frazer K.A., Pachter L., Poliakov A., Rubin E.M., Dubchak I. VISTA: Computational tools for comparative genomics. Nucleic Acids Res. 2004;32:W273–W279. doi: 10.1093/nar/gkh458. [DOI] [PMC free article] [PubMed] [Google Scholar]
- 46.Rozas J., Ferrer-Mata A., Sánchez-DelBarrio J.C., Guirao-Rico S., Librado P., Ramos-Onsins S.E., Sánchez-Gracia A. DnaSP 6: DNA sequence polymorphism analysis of large data sets. Mol. Biol. Evol. 2017;34:3299–3302. doi: 10.1093/molbev/msx248. [DOI] [PubMed] [Google Scholar]
- 47.Dong W., Liu J., Yu J., Wang L., Zhou S. Highly variable chloroplast markers for evaluating plant phylogeny at low taxonomic levels and for DNA barcoding. PLoS ONE. 2012;7:e35071. doi: 10.1371/journal.pone.0035071. [DOI] [PMC free article] [PubMed] [Google Scholar]
- 48.Bi Y., Zhang M.-F., Xue J., Dong R., Du Y.-P., Zhang X.-H. Chloroplast genomic resources for phylogeny and DNA barcoding: A case study on Fritillaria. Sci. Rep. 2018;8:1184. doi: 10.1038/s41598-018-19591-9. [DOI] [PMC free article] [PubMed] [Google Scholar]
- 49.Amiryousefi A., Hyvönen J., Poczai P. IRscope: An online program to visualize the junction sites of chloroplast genomes. Bioinformatics. 2018;34:3030–3031. doi: 10.1093/bioinformatics/bty220. [DOI] [PubMed] [Google Scholar]
- 50.Sharp P.M., Li W.-H. An evolutionary perspective on synonymous codon usage in unicellular organisms. J. Mol. Evol. 1986;24:28–38. doi: 10.1007/BF02099948. [DOI] [PubMed] [Google Scholar]
- 51.Chen C., Chen H., Zhang Y., Thomas H.R., Frank M.H., He Y., Xia R. TBtools: An integrative toolkit developed for interactive analyses of big biological data. Mol. Plant. 2020;13:1194–1202. doi: 10.1016/j.molp.2020.06.009. [DOI] [PubMed] [Google Scholar]
- 52.Wright F. The ‘effective number of codons’ used in a gene. Gene. 1990;87:23–29. doi: 10.1016/0378-1119(90)90491-9. [DOI] [PubMed] [Google Scholar]
- 53.Sueoka N. Translation-coupled violation of Parity Rule 2 in human genes is not the cause of heterogeneity of the DNA G+ C content of third codon position. Gene. 1999;238:53–58. doi: 10.1016/S0378-1119(99)00320-0. [DOI] [PubMed] [Google Scholar]
- 54.Sueoka N. Two aspects of DNA base composition: G + C content and translation-coupled deviation from intra-strand rule of A = T and G = C. J. Mol. Evol. 1999;49:49–62. doi: 10.1007/PL00006534. [DOI] [PubMed] [Google Scholar]
- 55.Yang Z. PAML 4: Phylogenetic analysis by maximum likelihood. Mol. Biol. Evol. 2007;24:1586–1591. doi: 10.1093/molbev/msm088. [DOI] [PubMed] [Google Scholar]
- 56.Zhang D., Gao F., Jakovlić I., Zou H., Zhang J., Li W.X., Wang G.T. PhyloSuite: An integrated and scalable desktop platform for streamlined molecular sequence data management and evolutionary phylogenetics studies. Mol. Ecol. Resour. 2020;20:348–355. doi: 10.1111/1755-0998.13096. [DOI] [PubMed] [Google Scholar]
- 57.Darriba D., Posada D., Kozlov A.M., Stamatakis A., Morel B., Flouri T. ModelTest-NG: A new and scalable tool for the selection of DNA and protein evolutionary models. Mol. Biol. Evol. 2020;37:291–294. doi: 10.1093/molbev/msz189. [DOI] [PMC free article] [PubMed] [Google Scholar]
- 58.Kozlov A.M., Darriba D., Flouri T., Morel B., Stamatakis A. RAxML-NG: A fast, scalable and user-friendly tool for maximum likelihood phylogenetic inference. Bioinformatics. 2019;35:4453–4455. doi: 10.1093/bioinformatics/btz305. [DOI] [PMC free article] [PubMed] [Google Scholar]
- 59.Ronquist F., Teslenko M., Van Der Mark P., Ayres D.L., Darling A., Höhna S., Larget B., Liu L., Suchard M.A., Huelsenbeck J.P. MrBayes 3.2: Efficient Bayesian phylogenetic inference and model choice across a large model space. Syst. Biol. 2012;61:539–542. doi: 10.1093/sysbio/sys029. [DOI] [PMC free article] [PubMed] [Google Scholar]
- 60.Rambaut A., Drummond A.J., Xie D., Baele G., Suchard M.A. Posterior summarization in Bayesian phylogenetics using Tracer 1.7. Syst. Biol. 2018;67:901–904. doi: 10.1093/sysbio/syy032. [DOI] [PMC free article] [PubMed] [Google Scholar]
- 61.Chen Z., Zhao J., Qiao J., Li W., Li J., Xu R., Wang H., Liu Z., Xing B., Wendel J.F. Comparative analysis of codon usage between Gossypium hirsutum and G. barbadense mitochondrial genomes. Mitochondrial DNA Part B. 2020;5:2500–2506. doi: 10.1080/23802359.2020.1780969. [DOI] [PMC free article] [PubMed] [Google Scholar]
- 62.Yuan M.L., Zhang L.J., Zhang Q.L., Zhang L., Li M., Wang X.T., Feng R.Q., Tang P.A. Mitogenome evolution in ladybirds: Potential association with dietary adaptation. Ecol. Evol. 2020;10:1042–1053. doi: 10.1002/ece3.5971. [DOI] [PMC free article] [PubMed] [Google Scholar]
- 63.Gontcharova S., Artyukova E., Gontcharov A. Phylogenetic relationships among members of the subfamily Sedoideae (Crassulaceae) inferred from the ITS region sequences of nuclear rDNA. Russ. J. Genet. 2006;42:654–661. doi: 10.1134/S102279540606010X. [DOI] [PubMed] [Google Scholar]
- 64.Li X., Li Y., Zang M., Li M., Fang Y. Complete chloroplast genome sequence and phylogenetic analysis of Quercus acutissima. Int. J. Mol. Sci. 2018;19:2443. doi: 10.3390/ijms19082443. [DOI] [PMC free article] [PubMed] [Google Scholar]
- 65.Turmel M., Otis C., Lemieux C. The chloroplast and mitochondrial genome sequences of the charophyte Chaetosphaeridium globosum: Insights into the timing of the events that restructured organelle DNAs within the green algal lineage that led to land plants. Proc. Natl. Acad. Sci. USA. 2002;99:11275–11280. doi: 10.1073/pnas.162203299. [DOI] [PMC free article] [PubMed] [Google Scholar]
- 66.Jansen R.K., Ruhlman T.A. Plastid Genomes of Seed Plants. In: Bock R., Knoop V., editors. Genomics of Chloroplasts and Mitochondria. Springer; Dordrecht, The Netherlands: 2012. pp. 103–126. [Google Scholar]
- 67.Wang W., Yu H., Wang J., Lei W., Gao J., Qiu X., Wang J. The complete chloroplast genome sequences of the medicinal plant Forsythia suspensa (Oleaceae) Int. J. Mol. Sci. 2017;18:2288. doi: 10.3390/ijms18112288. [DOI] [PMC free article] [PubMed] [Google Scholar]
- 68.Li Y., Wang T.-R., Kozlowski G., Liu M.-H., Yi L.-T., Song Y.-G. Complete Chloroplast Genome of an Endangered Species Quercus litseoides, and Its Comparative, Evolutionary, and Phylogenetic Study with Other Quercus Section Cyclobalanopsis Species. Genes. 2022;13:1184. doi: 10.3390/genes13071184. [DOI] [PMC free article] [PubMed] [Google Scholar]
- 69.Jiang H., Tian J., Yang J., Dong X., Zhong Z., Mwachala G., Zhang C., Hu G., Wang Q. Comparative and phylogenetic analyses of six Kenya Polystachya (Orchidaceae) species based on the complete chloroplast genome sequences. BMC Plant Biol. 2022;22:177. doi: 10.1186/s12870-022-03529-5. [DOI] [PMC free article] [PubMed] [Google Scholar]
- 70.Celiński K., Sokołowska J., Fuchs H., Maděra P., Wiland-Szymańska J. Characterization of the Complete Chloroplast Genome Sequence of the Socotra Dragons Blood Tree (Dracaena cinnabari Balf.) Forests. 2022;13:932. doi: 10.3390/f13060932. [DOI] [Google Scholar]
- 71.Goulding S.E., Olmstead R.G., Morden C.W., Wolfe K.H. Ebb and flow of the chloroplast inverted repeat. Mol. Gen. Genet. 1996;252:195–206. doi: 10.1007/BF02173220. [DOI] [PubMed] [Google Scholar]
- 72.Wang R.J., Cheng C.L., Chang C.C., Wu C.L., Su T.M., Chaw S.M. Dynamics and evolution of the inverted repeat-large single copy junctions in the chloroplast genomes of monocots. BMC Evol. Biol. 2008;8:36. doi: 10.1186/1471-2148-8-36. [DOI] [PMC free article] [PubMed] [Google Scholar]
- 73.Zhu A., Guo W., Gupta S., Fan W., Mower J.P. Evolutionary dynamics of the plastid inverted repeat: The effects of expansion, contraction, and loss on substitution rates. New Phytol. 2016;209:1747–1756. doi: 10.1111/nph.13743. [DOI] [PubMed] [Google Scholar]
- 74.Chi X., Zhang F., Dong Q., Chen S. Insights into comparative genomics, codon usage bias, and phylogenetic relationship of species from Biebersteiniaceae and Nitrariaceae based on complete chloroplast genomes. Plants. 2020;9:1605. doi: 10.3390/plants9111605. [DOI] [PMC free article] [PubMed] [Google Scholar]
- 75.Ma Q., Li C., Wang J., Wang Y., Ding Z. Analysis of synonymous codon usage in FAD7 genes from different plant species. Genet. Mol. Res. 2015;14:1414–1422. doi: 10.4238/2015.February.13.20. [DOI] [PubMed] [Google Scholar]
- 76.Tats A., Tenson T., Remm M. Preferred and avoided codon pairs in three domains of life. BMC Genom. 2008;9:463. doi: 10.1186/1471-2164-9-463. [DOI] [PMC free article] [PubMed] [Google Scholar]
- 77.Liu J., Zhu D., Ma G., Liu M., Wang M., Jia R., Chen S., Sun K., Yang Q., Wu Y. Genome-wide analysis of the synonymous codon usage patterns in Riemerella anatipestifer. Int. J. Mol. Sci. 2016;17:1304. doi: 10.3390/ijms17081304. [DOI] [PMC free article] [PubMed] [Google Scholar]
- 78.Xu Q., Chen H., Sun W., Zhu D., Zhang Y., Chen J.-L., Chen Y. Genome-wide analysis of the synonymous codon usage pattern of Streptococcus suis. Microb. Pathog. 2021;150:104732. doi: 10.1016/j.micpath.2021.104732. [DOI] [PubMed] [Google Scholar]
- 79.Kattoor J.J., Malik Y.S., Sasidharan A., Rajan V.M., Dhama K., Ghosh S., Bányai K., Kobayashi N., Singh R.K. Analysis of codon usage pattern evolution in avian rotaviruses and their preferred host. Infect. Genet. Evol. 2015;34:17–25. doi: 10.1016/j.meegid.2015.06.018. [DOI] [PubMed] [Google Scholar]
- 80.Brandão P.E. The evolution of codon usage in structural and non-structural viral genes: The case of Avian coronavirus and its natural host Gallus gallus. Virus Res. 2013;178:264–271. doi: 10.1016/j.virusres.2013.09.033. [DOI] [PMC free article] [PubMed] [Google Scholar]
- 81.Yu J., Xue J.H., Zhou S.L. New universal matK primers for DNA barcoding angiosperms. J. Syst. Evol. 2011;49:176–181. doi: 10.1111/j.1759-6831.2011.00134.x. [DOI] [Google Scholar]
- 82.Li F.-W., Kuo L.-Y., Rothfels C.J., Ebihara A., Chiou W.-L., Windham M.D., Pryer K.M. rbcL and matK earn two thumbs up as the core DNA barcode for ferns. PLoS ONE. 2011;6:e26597. doi: 10.1371/journal.pone.0026597. [DOI] [PMC free article] [PubMed] [Google Scholar]
- 83.Surveswaran S., Gowda V., Sun M. Using an integrated approach to identify cryptic species, divergence patterns and hybrid species in Asian ladies’ tresses orchids (Spiranthes, Orchidaceae) Mol. Phylogenetics Evol. 2018;124:106–121. doi: 10.1016/j.ympev.2018.02.025. [DOI] [PubMed] [Google Scholar]
- 84.Ashokan A., Leong-Škorničková J., Suksathan P., Newman M., Kress W.J., Gowda V. Floral evolution and pollinator diversification in Hedychium: Revisiting Darwin’s predictions using an integrative taxonomic approach. Am. J. Bot. 2022:1410–1427. doi: 10.1002/ajb2.16039. [DOI] [PubMed] [Google Scholar]
- 85.Kikuchi S., Bédard J., Hirano M., Hirabayashi Y., Oishi M., Imai M., Takase M., Ide T., Nakai M. Uncovering the protein translocon at the chloroplast inner envelope membrane. Science. 2013;339:571–574. doi: 10.1126/science.1229262. [DOI] [PubMed] [Google Scholar]
- 86.Drescher A., Ruf S., Calsa Jr T., Carrer H., Bock R. The two largest chloroplast genome-encoded open reading frames of higher plants are essential genes. Plant J. 2000;22:97–104. doi: 10.1046/j.1365-313x.2000.00722.x. [DOI] [PubMed] [Google Scholar]
- 87.Barnard-Kubow K.B., Sloan D.B., Galloway L.F. Correlation between sequence divergence and polymorphism reveals similar evolutionary mechanisms acting across multiple timescales in a rapidly evolving plastid genome. BMC Evol. Biol. 2014;14:268. doi: 10.1186/s12862-014-0268-y. [DOI] [PMC free article] [PubMed] [Google Scholar]
- 88.Tölken H.R. In: Flora of Southern Africa. Leistner O.A., editor. Vol. 14. National Botanical Institute; Pretoria, South Africa: 1985. pp. 1–244. [Google Scholar]
- 89.Nikulin V.Y., Gontcharova S.B., Stephenson R., Gontcharov A.A. Phylogenetic relationships between Sedum L. and related genera (Crassulaceae) based on ITS rDNA sequence comparisons. Flora. 2016;224:218–229. doi: 10.1016/j.flora.2016.08.003. [DOI] [Google Scholar]
- 90.Carrillo-Reyes P., Sosa V., Mort M.E. Molecular phylogeny of the Acre clade (Crassulaceae): Dealing with the lack of definitions for Echeveria and Sedum. Mol. Phylogenet. Evol. 2009;53:267–276. doi: 10.1016/j.ympev.2009.05.022. [DOI] [PubMed] [Google Scholar]
Associated Data
This section collects any data citations, data availability statements, or supplementary materials included in this article.
Supplementary Materials
Data Availability Statement
The sequence data generated in this study are available in GenBank of the National Center for Biotechnology Information (NCBI) under the access numbers: OP729482–OP729487 and OP882297–OP882300.


