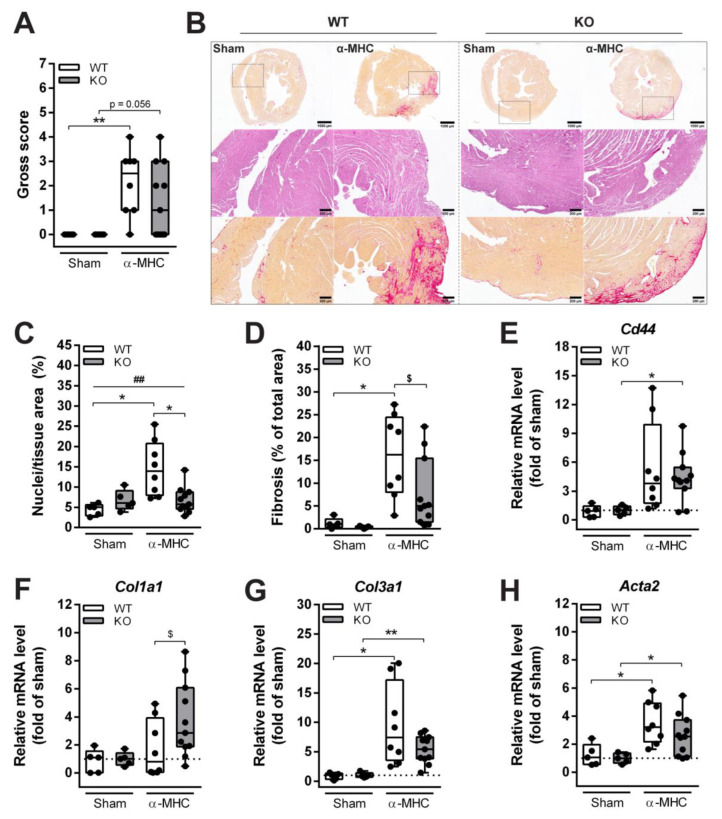
Figure 2.
Histological and biochemical characterization of cardiac remodeling induced by EAM. (A) The gross score of the dissected mice hearts 65 days after EAM induction. ** (p < 0.01) marks statistically significant differences, by the Kruskal–Wallis test, and differences between groups were determined by Dunn’s post hoc test. (B) Representative sections of whole mouse hearts 65 days after EAM induction (upper panel, 1.5× magnification) stained with Sirius red for collagen (red) (scale bar—1000 µm), sections stained with H&E (middle panel, 6× magnification) (scale bar—200 µm) and Sirius red (lower panel, 6× magnification) (scale bar—200 µm). (C) Quantitative analysis of infiltrates found in the heart. (D) Quantification of heart fibrosis. The mRNA expression of (E) Cd44, (F) Col1a1, (G) Col3a1, and (H) Acta2, data were normalized to corresponding 18S rRNA levels and presented as the fold change versus the corresponding sham control; the dotted line marks sham levels. WT-Sham (n = 5), WT-α-MHC (n = 8), KO-Sham (n = 5) and KO-α-MHC (n = 11). Data represented as median ± IQR. Black dots denote individual animals. * (p < 0.05), ** (p < 0.01) marks statistically significant differences and ## (p < 0.01) marks statistically significant differences in interaction between genotype and immunization, by robust ANOVA followed by Lincon post hoc. $ (p < 0.05) marks statistically significant differences between α-MHC-immunized groups, by ANCOVA (Gross score was used as a covariate) followed by EMMs post hoc.

