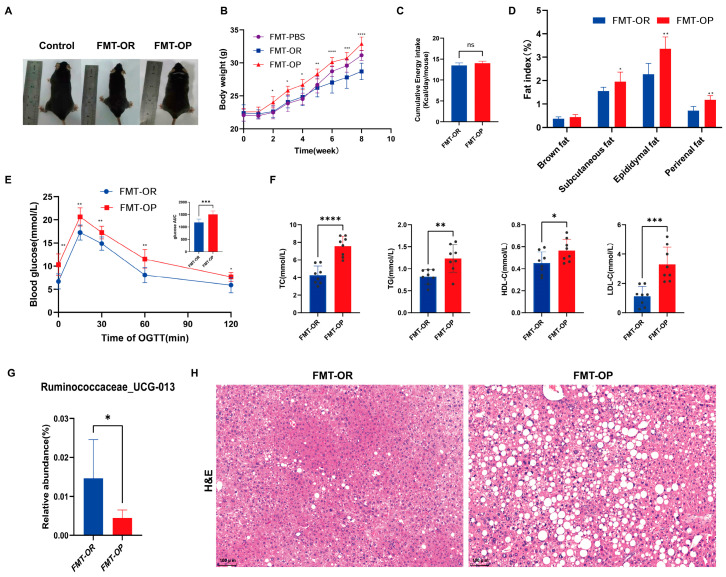
Figure 5.
The physiological change and relative abundance of Ruminococcaceae_UCG-013 change in the Mice with obesity-prone fecal flora transplanted (FMT-OP)and Mice with obesity-resistant fecal flora transplanted (FMT-OR) groups. (A) Images of mice representative of the species. (B) Body weight. * p < 0.05, ** p < 0.01, *** p < 0.001 and **** p < 0.0001 vs. the FMT-OR group. (C) Energy intake. (D) Fat index. (E) Blood glucose levels were measured by an oral glucose tolerance test (OGTT) performed in the eight weeks of FMT. (F) Serum biochemical parameters. A sample is represented by each black dot. (G) The relative abundance of Ruminococcaceae_UCG-013 in different groups at week 8. (H) Representative images of H&E staining of liver sections. The scale bar for H&E staining represents 100 µm. Data are expressed as the mean ± SD (n = 8 per group). **** p < 0.0001, *** p < 0.001, ** p < 0.01 and * p < 0.05 were considered significant. ns, not significant.

