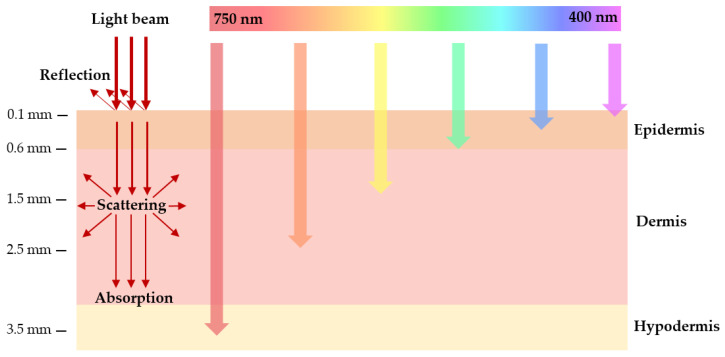
Figure 3.
Schematic representation of wavelength-dependent light penetration into biological tissue. The schematic shows a section of the skin layers (epidermis, dermis, and subcutaneous layer). The arrows represent the penetration power of light with different wavelengths in the tissues. Blue light penetrates less efficiently into the tissue, while red light penetrates more deeply.

