

ABSTRACT
Error in self-reported food and beverage intake affects the accuracy of dietary intake data. Systematically synthesizing available data on contributors to error within and between food groups has not been conducted but may help inform error mitigation strategies. In this review we aimed to systematically identify, quantify, and compare contributors to error in estimated intake of foods and beverages, based on short-term self-report dietary assessment instruments, such as 24-h dietary recalls and dietary records. Seven research databases were searched for studies including self-reported dietary assessment and a comparator measure of observed intake (e.g., direct observation or controlled feeding studies) in healthy adults up until December 2021. Two reviewers independently screened and extracted data from included studies, recording quantitative data on omissions, intrusions, misclassifications, and/or portion misestimations. Risk of bias was assessed using the QualSyst tool. A narrative synthesis focused on patterns of error within and between food groups. Of 2328 articles identified, 29 met inclusion criteria and were included, corresponding to 2964 participants across 15 countries. Most frequently reported contributors to error were omissions and portion size misestimations of food/beverage items. Although few consistent patterns were seen in omission of consumed items, beverages were omitted less frequently (0–32% of the time), whereas vegetables (2–85%) and condiments (1–80%) were omitted more frequently than other items. Both under- and overestimation of portion size was seen for most single food/beverage items within study samples and most food groups. Studies considered and reported error in different ways, impeding the interpretation of how error contributors interact to impact overall misestimation. We recommend that future studies report 1) all error contributors for each food/beverage item evaluated (i.e., omission, intrusion, misclassification, and portion misestimation), and 2) measures of variation of the error. The protocol of this review was registered in PROSPERO as CRD42020202752 (https://www.crd.york.ac.uk/prospero/).
Keywords: misreporting, error, bias, controlled feeding, direct observation, 24-h dietary recall, dietary record, omission, intrusion, portion size
Statement of Significance: This review is, to our knowledge, the first to examine contributors to error in dietary intake estimation within and between food groups. Although there was inconsistency in measures across studies, some patterns in tendency for omission or substantial portion misestimation were identified according to food group. Portion misestimation made a large contribution to dietary intake measurement error; however, more variation in error existed within food groups and within individual studies than between food groups.
Introduction
Self-reported dietary intake data collected using short-term instruments, such as 24-h dietary recall interviews and dietary records, is a central part of population nutrition surveillance (1). Limitations of these instruments lead to error in the measurement of dietary intake data and therefore the quality of the surveillance. Much of the measurement error in data collected using short-term instruments, such as 24-h dietary recall interviews, is random error, which can be partially accounted for using repeat measures and statistical modeling (2). In contrast, without an objective measure (e.g., a recovery biomarker or measure of true intake), systematic error cannot be mitigated (3); therefore, an understanding of the contributors to systematic error is required to develop instruments in which this source of error is minimized.
Many studies of dietary intake measurement error have focused on evaluating the difference between energy intakes derived from self-reported dietary intake data and energy expenditure or estimated energy requirements (4–7). These methods of identifying error in energy intake estimation assume good alignment between energy intake and expenditure, and make various other assumptions, for example, about physical activity levels (4), and the length of the observation required to obtain a representative estimate (8). Although the estimation of energy intake is often poorly assessed using short-term self-report instruments (9), other dietary components, such as protein and potassium, seem to be assessed with lower levels of measurement error (10, 11). Therefore, a broader understanding of measurement error is required, beyond the accuracy of energy intake estimation alone.
Biomarker-based studies have quantified systematic and random error present in the estimation of energy and selected nutrients from short-term dietary assessment instruments (9–11). Less investigation has taken place into the types of foods and beverages for which intake is misestimated by participants and how the misestimation arises. Such investigation requires a comparator measure of food and beverage intake, which can be collected using direct observation by researchers, or controlled feeding studies where food weights are known. Studies using observation or known weights have provided evidence that patterns of measurement error differ according to food type. For example, compared with observed intake weights, snacks, beverages, and condiments (12, 13), and in some studies, vegetables (14, 15), were subject to greater omission relative to other types of food. Thus, it is likely that measurement error is differential across different foods and beverages, and the type and form of food may be an important factor.
Food and beverage intake is multidimensional and dynamic, and assessment instruments are selected based on the purpose, context, and population (3). A number of cognitive domains are thought to be involved when a participant is reporting dietary intake, including attention, perception, working memory, conceptualization of memory, and response formulation (16–18). Given the cognitive challenge of accurately recalling and reporting dietary intake for participants, error may be affected by administration mode of the dietary assessment instrument (interviewer compared with self-administered), the number of foods being assessed, the time between consumption and reporting, and how well any portion size aids apply to the foods consumed. Thus, error in the measurement of food or beverage intake occurs during an interaction between a participant and the selected dietary assessment instrument. This interaction is affected by the characteristics of the instrument, how burdensome it is, and the degree of alignment of the instrument with cognitive capabilities of the target population.
Figure 1 depicts the process of accurate assessment of dietary intake, and the possible contributors to error during this process. This process is applicable to open-ended short-term self-report dietary assessment methods, such as 24-h dietary recall interviews or dietary records. In controlled feeding or direct observation studies to evaluate self-report instruments, actual food and beverage intake is known to researchers. As the food weight is known, these studies enable the examination of measurement error by type of food, as well as accuracy of portion size estimation. In these studies, contributors to error in dietary reporting (14, 15, 19) have been considered in terms of the following factors: 1) intrusion, also known as addition, which is a food or beverage item that is reported but not consumed; 2) omission, also known as deletion or exclusion, which is a food or beverage item that is consumed but not reported; 3) misclassification, also known as a close or far match, which is a similar (e.g., in the same food grouping) but inaccurate description of the characteristics of the consumed food or beverage; and 4) portion misestimation, also known as a mass error or quantity over-/underestimation, which is a difference between the weight of the consumed and reported food or beverage. Intrusion and omission constitute systematic error, as they result in a deviation from the true value in a consistent direction (estimates in excess of the true value for intrusions, below the true value for omissions). In contrast, misclassification and portion misestimation can result in both random and systematic deviations from the true value. For example, a milk that is very low in fat may tend to be misclassified as having a higher fat content, and this would be systematic error. On the other hand, regular-fat milk may be misclassified as high fat or low fat by different participants. A small feeding study indicated systematic differences in these error contributors across food groups and across individuals. For example, portion misestimation accounted for 99% of the misestimation of energy intake from sweets (confectionery, sweetened spreads, syrups), but only 20% of the error for vegetables (19). The frequency and extent of these error contributors within and between food groups could enable better understanding of characteristics of dietary assessment instruments that lead to measurement error. However, to our knowledge no previous studies have synthesized the evidence on the presence and extent of contributors to measurement error, according to foods and beverages.
FIGURE 1.
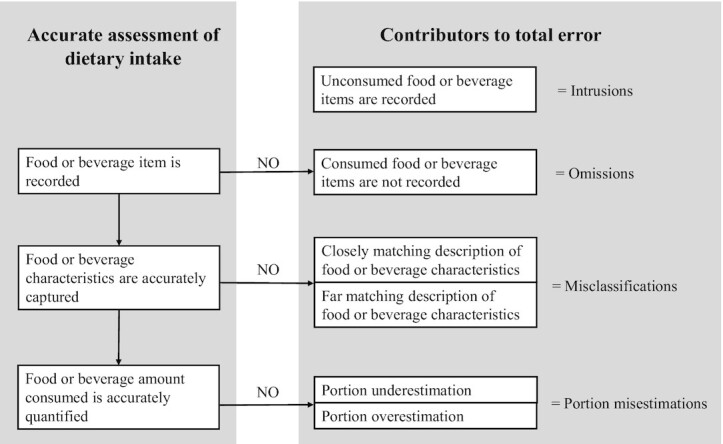
Processes of accurate food and beverage reporting, illustrating the stages at which each error contributor can arise.
Therefore, this study aimed to summarize the evidence on the contributions of intrusions, omissions, misclassifications, and portion misestimations on measurement error in dietary intake data collected using short-term instruments.
Methods
This review was conducted and reported according to the PRISMA (Preferred Reporting Items for Systematic reviews and Meta-Analyses) 2020 statement (20). We referred to the SWiM (Synthesis Without Meta-analysis) reporting guideline to inform reporting in this review (21). Before screening commenced the study protocol was registered with PROSPERO (https://www.crd.york.ac.uk/prospero/), an international prospective register of systematic reviews, with the registration ID CRD42020202752.
Publication inclusion criteria
Studies were selected for review using the PICOS (population, intervention, comparison, outcome, study design) criteria (Table 1). Briefly, included studies involved healthy adults (aged ≥18 y) who had self-reported their dietary intake for a specific date and time, using either open-ended (e.g., dietary records or 24-h dietary recall interviews) or closed-ended methods (e.g., a food checklist). A comparator reference measure of observed food/beverage intake (e.g., direct observation, video recording, or controlled feeding studies) must also have been included. A detailed description of study inclusion and exclusion criteria can be found in Table 2.
TABLE 1.
PICOS criteria for inclusion of studies
| Criterion | Description |
|---|---|
| Population | Healthy adults aged ≥18 y, noninstitutionalized |
| Intervention | A measure of self-reported intake of the foods/beverages consumed at a specific date and time, using either open-ended (e.g., dietary records or 24-h dietary recall interviews) or closed-ended methods (e.g., an FFQ or food checklist) |
| Comparison | A measure of observed food/beverage intake (e.g., direct observation, video recording, or controlled feeding studies), contemporaneous with the self-report measure |
| Outcome | Quantitative assessment of the error within food groups, contributing to discrepancy between self-reported and observed intake (e.g., difference in grams or as a percentage between observed and reported intake; proportion of observed items omitted from reports) |
| Study design | Observational studies published as research articles, conference papers, and proceedings, and theses in English language |
TABLE 2.
Inclusion and exclusion criteria used by reviewers during screening
| Inclusion criteria |
| 1. Research articles, conference papers/proceedings, theses, dissertations |
| 2. Published in English language |
| 3. Observational studies comparing self-reported with observed food/beverage intake |
| 4. Self-reported intake of the foods/beverages consumed at a specific date/time, for example food records, 24-h dietary recall interviews, or a food checklist related to a recent eating occasion |
| 5. Observed/true/known food/beverage intake is measured by researchers in controlled feeding studies or estimated by researchers using direct observation or indirect observation (e.g., video recording), or duplicate plates. |
| 6. There is overlap between the timeframes of the actual intake measurement and the self-reported intake measurement |
| Exclusion criteria |
| 1. Conference abstracts, books, reports, reviews, editorials, commentaries, letters to the editor, personal views, protocols |
| 2. Studies in animals |
| 3. In-patient populations e.g., hospitalized |
| 4. Studies that do not include an objective measure of food and beverage intake, such as biomarker studies (doubly labeled water, urinary nitrogen) which assess error in misestimation of energy or nutrient intake but not food/beverage intake |
| 5. Reference measure provided by participant e.g., photographs |
| 6. The self-report instrument assessed habitual/usual dietary intake (such as FFQs), rather than the food eaten at a given date and time |
| 7. Foods/beverages were seen by participants but not consumed |
| 8. No results on specific food groups e.g., overall matches, intrusions, omissions are reported without any breakdown by food group (e.g., cereals, vegetables, snacks) |
Search strategy
Searches were conducted in the following scientific databases, given the topic matter, including all available dates up until December 2021: Ovid (including MEDLINE and PsychInfo), EBSCOHOST (including CINAHL), Scopus, Web of Science Core Collection, ProQuest Theses and Dissertations, and Open Grey. A combination of subject headers and keywords were used in Medline, CINAHL, and PsychInfo (Supplementary Table 1). In Web of Science, Scopus, Proquest, and Open Grey, the searches used keywords only (Supplementary Table 1). Reference lists of included articles were checked to identify additional eligible studies. Searches were piloted to assess whether they could identify 4 clearly eligible studies (12–15), and refined to ensure the 4 eligible studies were detected.
Study selection
Database results were imported into Covidence© systematic review software (22), and duplicate results were automatically removed. Two reviewers (CW and CRG) independently screened titles and abstracts of all retrieved papers, constituting a double-screening process. To ensure reviewer consistency in applying the inclusion and exclusion criteria and reduce the number of conflicting judgements arising, a prescreening training was conducted using 10 articles. The full text of each potentially relevant publication was assessed for study eligibility by 2 reviewers independently, and conflicts were resolved by the principal investigator (DAK).
Data extraction
A data extraction form was developed and piloted by the 2 reviewers. After refinements to outcome descriptors, the form was used to collect study descriptors, sample characteristics, dietary assessment methods, and study outcomes. The 2 reviewers independently extracted all available information on the details of the food/beverage items and the form in which they were served, from published tables, text, and menus. Data were extracted on the 4 error contributors (intrusions, omissions, misclassifications, and portion misestimation) (Figure 1), as well as total error. We sought to extract quantitative information on error contributors according to food/beverage type. Thus, where possible, we extracted means/medians with a measure of variation, such as SD, SE, IQR, and 95% CI, and any related statistical test results. We also extracted descriptive data for study samples, such as counts. Results of demographic correlates of measurement error were also extracted.
Study quality assessment
The QualSyst tool developed by the Alberta Heritage Foundation for Medical Research (23) was selected to evaluate study quality because of its breadth and relevance to quantitative observational studies. Eleven out of the 14 QualSyst items were used, as 3 were not applicable (randomization, confounding, and participant blinding). A score was assigned by 2 reviewers independently (CW and CRG) to indicate the extent to which each criterion was fulfilled (2 for fulfilling, 1 for partially fulfilling, and 0 for not fulfilling). Disagreements between reviewers were resolved through discussion, and with a third reviewer (MER) to arbitrate. The maximum score a study could receive was 22.
Data synthesis
As a wide variety of foods were reported in studies, we categorized individual food items into broad food groups containing conceptually similar items of similar mass per unit volume (beverages; bread and bread products; breakfast cereals; cakes, desserts, and puddings; cheese; milk products excluding cheese; composite dishes; condiments; fruit; meat, fish, and eggs; nuts, seeds, and legumes; rice, pasta, and other grains; potatoes; savory snacks; soup; spreads; and vegetables). To evaluate the certainty of findings, we considered measures of variation around estimates rather than statistical significance based on P values. Where necessary, SEs or SDs were converted into CIs using standard formulas (24) to enable comparison of similar food items between studies. We did not generate pooled estimates by food group due to heterogeneity in the form of the food. For example, within a single food group, items could be served as single units, multiple small pieces, or amorphous shapes (i.e., without a clearly defined form). We generated forest plots and included (when available) detailed descriptions of individual food items to enable interpretation, which were stratified into panels according to broad food group. In a narrative synthesis, we described and summarized effect estimates for intrusions, omissions, misclassifications, portion misestimations, and total error, making comparisons across food groups.
Results
This section summarizes the following features of this study 1) the characteristics of the included studies and the assessment of risk of bias, 2) measures and results extracted on intrusions, omissions, misclassifications, portion misestimations, and total error, and 3) results extracted on demographic correlates of error.
Study selection
Database searches identified 2579 results, of which 251 were duplicates (Figure 2). Title and abstract screening of the remaining 2328 results led to exclusion of 2231 items. Full texts of 97 articles were evaluated for eligibility. Of these, 18 were included. Two articles were based on the same study sample, but each reported different outcome measures and so were included as separate studies. Eleven further articles were identified from reference lists of included articles. As a result, 29 study reports were included (12–15, 19, 25–48).
FIGURE 2.

PRISMA 2020 flow diagram for new systematic reviews on study identification, screening, and inclusion. Adapted from (20). PRISMA, Preferred Reporting Items for Systematic reviews and Meta-Analyses. CINAHL, Cumulative Index of Nursing and Allied Health Literature.
Study characteristics
The characteristics of the 29 included study reports are summarized in Table 3. Eleven studies took place in the United States (14, 19, 27, 28, 32, 33, 36–40), 4 took place in the United Kingdom (13, 30, 31, 47), and 2 in Canada (15, 41). The remaining 12 studies were conducted in Australia, Belgium, Bolivia, Burkina Faso, Cameroon, Italy, Kenya, Malawi, Nepal, New Zealand, South Korea, and Tunisia. Most studies used a controlled feeding protocol at a research center (n = 16) (13–15, 19, 27, 28, 30, 31, 33, 36–38, 40, 43, 44, 47). Ten studies used controlled feeding protocols in other settings, including a restaurant (n = 2) (39, 45), participant households (n = 6) (25, 26, 29, 34, 35, 48), community center (n = 1) (46), and workplace (n = 1) (32). Two studies used images captured passively from a wearable camera as the comparator reference method (12, 42). One study used direct observation methodology in a cafeteria (41). Nineteen of the controlled feeding studies allowed ad libitum intake. The controlled feeding studies tested varying numbers of food/beverage items, ranging from 3 to >100 items. In 15 studies, participants served food to themselves, rather than being served by researchers. Only 8 studies provided information on how the food was presented (14, 26–28, 30, 33, 37, 40), for example, in the original packaging, on a plate with no packaging, or with a label describing the contents/portion size, which provides context on the level of detail a participant may be able to provide during recall. Among the controlled feeding studies that provided mixed dishes, none reported whether standardized recipes had been used. In most studies, self-reported dietary intake data were collected using interviewer-administered recall interviews (n = 16), or self-administered 24-h dietary recall (n = 5). Studies captured dietary intake over 1 d (n = 12), 1 meal/snack (n = 10), 3 d (n = 4), 2 d (n = 2), or 2 meals (n = 1). Self-reported data were collected immediately after eating (n = 3) or 1 d after eating (n = 25). Standard food images were the most commonly used portion size estimation aid (n = 18); 9 studies provided printed images, 8 studies provided digital images, and 1 study provided both printed and digital images. The number of images per food varied by study from 1 to >10. In some studies (n = 12), participants were able to indicate that the portion they consumed fell between the displayed images, rather than being restricted to selecting a displayed image only.
TABLE 3.
Characteristics of studies (n = 29) identified in a systematic review of food and beverage misestimation in healthy adults compared with controlled feeding or direct observation methods 1
| Authors, date, country | Study aims | n | Female | Age, y | Weight status | Reference period | Reference method, setting, items tested | Self-report method and timeframe | Portion estimation aid | Food group misreporting correlates |
|---|---|---|---|---|---|---|---|---|---|---|
| Amougou et al., 2016, (34) Cameroon | Develop and test validity of 2 books of food portion photographs to be used as visual aids for adults and children in 24-h dietary recall | 361 | 191 (53%) | M 24 ± 7, F 30 ± 15 (14–84) | — | 1 d (1 meal) | Participants prepared and served food in household; interviewer weighed all ingredients, dishes served, and leftovers | Photo atlas used next day for portion identification | Printed food portion photo atlas; 7 images per food; portion identification as greater/less than/between displayed images was possible | Sex |
| Blake et al. 1989, (36) USA | Determine how accurately participants estimated recalled portion sizes | 94 | 94 (100%) | 40 ± 12 | Overweight n = 69; normal weight n = 48 | 1 d (1 meal) | Controlled feeding, standard portions; 7 food/beverage items tested; mode of service unknown | Interviewer-administered meal recall, by telephone, day of conduct unknown | None | Weight status (overweight vs. normal weight) |
| Bouchoucha et al., 2016, (35) Tunisia | Develop and validate modified 24-h recall method with manual of food photographs | 31 | 14 (45%) | 33.6 ± 14.5 (9–89) | BMI: 25.7 ± 4.9 | 1 d (3 meals) | Participants prepared and served food in household; interviewer weighed ingredients, dishes served, and leftovers | Interviewer-administered 24-h dietary recall next day | Printed food portion photo atlas; 3 images per food; portion identification as greater/less than/between displayed images was possible | None |
| Chambers et al., 2000, (37) USA | Determine recall accuracy of selected snack foods and beverages with various measurement aids | 202 | 107 (53%) | 15–65 | — | 1 d (1 snack) | Controlled feeding, ad libitum, while watching a 30-min video; 2–3 food/beverage items tested per participant; items provided in bowls, bags, bottles, or glasses | Interviewer-administered recall next day | Various: printed diagrams; bean bags; bowls, measuring cups; plastic mounds; glasses; no aids | None |
| Chan et al., 2021, (42) Australia | Compare foods and beverages omitted when dietary intake assessed with 24-h recall and smartphone app vs. camera images | 133 | 73 (55%) | 18–24 (n = 73; 55%); 25–30 (n = 60; 45%) | BMI: <25 (n = 83; 62%); ≥25 (n = 50; 38%) | 3 d (all eating occasions) | Automated wearable camera (Autographer), community | Interviewer-administered web-based ASA24 next day, and text-entry food record app (EaT) | ASA24: digital food images; 1–10 images per food; able to state more/less than largest/smallest image | None |
| De Keyzer et al., 2011, (44) Belgium | Investigate perception and conceptualization skills of adults in nutritional surveillance context using 2D models | 111 | 62 (56%) | 53.0 ± 5.2 (45–65) | BMI: 25.9 ± 3.7 | 1 d (1 meal) | Controlled feeding, ad libitum, study center; 8 food/beverage items served by researchers (of which 4 were tested) | Interviewer-administered meal recall, by telephone, 1–2 d (n = 48) or 4 d (n = 63) after feeding | Printed photograph book; 4–6 images per food | Sex |
| Faggiano et al., 1992, (45) Italy | Validate accuracy in portion size recall through use of pictures | 103 | 52 (50%) | 35–64 | — | 1 d (1 meal) | Controlled feeding, ad libitum, restaurant; 17 items tested; participants served themselves | Interviewer-administered meal recall next day | Printed images of foods; 7 images of each food | Age, gender |
| Flax et al., 2019, (46) Malawi | Validate digitally displayed photographic portion-size estimation aids | 300 | 300 (100%) | 29.1 ± 7.6 (18–45) | — | 1 d (1 meal) | Controlled feeding, ad libitum, community center; 6 items tested; participants served themselves | Interviewer-administered meal recall next day | Printed and digital images of foods or actual prepared foods; 3 portion sizes of each food | Education level (≤4 or ≥5 y), urban/rural residence |
| Garden et al., 2018, (47) UK | Quantify food groups under- or overreported and identify food groups apparently forgotten by participants | 59 | 29 (49%) | 20–65 | BMI: 20–25 (n = 27) or >25 (n = 32) | 6 d (all eating occasions) | Controlled feeding, ad libitum access to ≤41 ingredients/foods; residential research institute; participants prepared own meals/snacks | Weighed dietary record on feeding day (3 d, n = 59) and interviewer-administered 24-h dietary recall (3 d, n = 59) next day | None | None |
| Gemming and Ni Mhurchu, 2016, (58) New Zealand | Assess meals and contexts in which foods were typically unreported | 40 | 20 (50%) | M: 35 ± 17; F 28 ± 7 | BMI: M 27 ± 4; F 22 ± 2 | 3 d (all eating occasions) | Automated wearable camera (Sense cam), community | Interviewer-administered 24-h dietary recalls (no photos) next day | None | None |
| Gewa et al., 2009, (48) Kenya | Evaluate relative validity of recalled intake | 42 | 42 (100%) | — | — | 1 d (all eating occasions) | Participants prepared and served food in household; interviewer weighed ingredients, dishes served, and leftovers | Interviewer-administered 24-h dietary recall next day | Food models, measuring cylinders | None |
| Godwin et al., 2004, (38) USA | Compare accuracy of respondent reported food intake using 2D vs. 3D PSEAs, different interview venues (in person vs. telephone), and formats (guided to a possible set of PSEAs vs. free choice of any or no aid) | 120 | 120 (68%) | 18–65 | — | 1 d (1 meal) | Controlled feeding, ad libitum, study center; 13 items tested; main food items served by researchers; beverages and condiments served by participants | Interviewer administered meal recall next day | 2D or 3D portion size aids (spoons, cups, glasses, bowls, ruler, wedge, rectangles, bean bags) | Age group, gender, ethnicity |
| Harnack et al., 2004, (39) USA | Examine accuracy of reporting of large food portions; evaluate whether size of food portion estimation visual aid may affect accuracy | 49 | 23 (55%) | 25–39 (7%); 40–54 (21%); 55–84 (71%) | BMI: <25 (24%); ≥25 (76%) | 1 d (1 meal) | Controlled feeding, restaurant; 3 food items tested; food served by restaurant staff | Portion identification using food models immediately after eating | Regular size plastic food models; larger size plastic food models | None |
| Harris-Fry et al., 2016, (25) Nepal | Develop and validate a photographic food atlas | 95 | 77 (81%) | 35.6 ± 15.5 | Mid–upper arm circumference: 24.6 ± 3.0 cm | 1 d (1 meal) | Participants prepared and served food in household; interviewer weighed all ingredients, dishes served, and leftovers | Interviewer-administered meal recall next day | Printed photographic food atlas; ≤6 images of each food | None |
| Hernandez et al., 2006, (40) USA | Determine error magnitude and direction in estimating food amounts using computer-based portion anchors; compare errors with use of computer and poster-displayed anchors and assess reasonably expected accuracy for different food types | 101 | Site 1: 32 (63%); site 2: 29 (58%) | Site 1: mean 33; site 2: mean 41 | — | 1 d (1 snack) | Controlled feeding, standard portions, study center; 3 food/beverage items tested; food served in single-serve packs; beverage self-poured into cup | Portion identification using digital images immediately after eating | Digital images of foods; 2 images of each food; able to state portion as proportion of amount displayed in images | None |
| Huybregts et al., 2008, (26) Burkina Faso | Validate food photographs for food portion size estimation of frequently consumed dishes | 257 | 257 (100%) | 15–45 | — | 1 d (2 meals) | Controlled feeding, standard portions, households; 4 food/beverage items tested per participant; foods served on plates/bowls by researchers | Portion identification using photograph atlas next day | Printed food portion photo atlas; 4 images per food; portion identification as greater/less than/between displayed images was possible | Location (village of residence), pregnancy status, education (school attendance) |
| Kim et al., 2021, (43) South Korea | Assess accuracy of food item and portion size estimation of estimated food records, before and after a short education session on recording intake | 30 | 30 (100%) | 20.2 ± 1.8; 18–24 | BMI: 22.0 ± 3.4, 15.8–31.1 | 3 d (6 meals and 5 snacks) | Controlled feeding, individualized portions according to estimated energy requirements, study center; 15–21 food/beverage items tested; served by researchers | Self-administered food record completed each morning of days following consumption | Photos of foods consumed captured by some participants | None |
| Kirkpatrick et al., 2014, (14) USA | Assess criterion validity of ASA24 through feeding study in which true intake known for 3 meals | 81 | 42 (52%) | 20–34 (n = 24), 35–54 (n = 27), 55–70 (n = 30) | BMI: <25 (n = 21); 25.0–29.9 (n = 28); ≥30 (n = 29) | 1 d (3 meals) | Controlled feeding, ad libitum, study center; 42 food/beverage items available self-served from buffet including platters, bowls, and packaged items | Interviewer-administered 24-h recall (AMPM) (n = 41), or ASA24 (n = 40) next day | AMPM: printed food model booklet with standard images of vessels and utensils; ASA24: digital food images, 1–10 images per food; able to state more/less than largest/smallest image | Sex |
| Kirkpatrick et al., 2016, (27) USA | Assess accuracy of portion size reporting in ASA24 dietary recall system compared with interviewer-administered recalls | 81 | 42 (52%) | 20–34 (n = 24); 35–54 (n = 27); 55–70 (n = 30) | BMI: <25 (n = 21); 25.0–29.9 (n = 28); ≥30 (n = 29) | 1 d (3 meals) | Controlled feeding, ad libitum, study center; 42 food/beverage items available; self-served from buffet including platters, bowls, and packaged items | Interviewer-administered 24-h recall (AMPM) (n = 41), or Automated web-based self-administered 24-h recall (ASA24) (n = 40) next day | AMPM: printed food model booklet with standard images of vessels and utensils; ASA24: digital images of foods; 1–10 images per food; able to state more/less than largest/smallest image | None |
| Kirkpatrick et al., 2019, (28) USA | Evaluate accuracy of ASA24 completed independently and with assistance | 302 | 302 (100%) | 20–34, n = 100; 35–54, n = 139; 55–82, n = 63 | BMI: <25 (n = 101); 25.0–29.9 (n = 71); ≥30 (n = 118) | 1 d (3 meals) | Controlled feeding, ad libitum, study center; 42 food/beverage items available; self-served from buffet foods in original packaging or labeled containers | ASA24 assisted (n = 148) and unassisted (n = 154), next day | Digital images of foods; 1–10 images per food; able to state more/less than largest/smallest image | None |
| Lafrenière et al., 2017, (57) Canada | Validate newly developed automated self-administered web-based 24-h dietary recall (R24W), within a population of adults taking part in fully controlled feeding studies | 62 | 29 (47%) | 21–71; > 25: n = 5 (8.1%); 25–50: n = 30 (48.4%); > 50: n = 27 (43.5%) | BMI: 21-52; < 25 (n = 7, 11.3%); 25.0–29.9 (n = 25, 40.3%); ≥ 30 ( n = 30, 48.4%) | 2 d (each d 3 meals, 1 snack) | Controlled feeding, individualized portions according to estimated energy requirements, 16 items per d; lunch served at research institute; breakfast, snack, dinner were packed | Automated web-based self-administered 24-h recall (R24W), day of conduct unknown | Digital images of foods; ≤8 images of each food; able to select a multiplicative or a fraction of each portion shown | Age, sex, BMI |
| Lazarte et al., 2012, (29) Bolivia | Develop and validate modified 24-h recall method with digital food photographs as a tool for subject recall of intake and a photo atlas with standard food portion sizes commonly consumed in area to simplify consumed portion estimation | 45 | 45 (100%) | 20–52; 35 ± 8.6 | BMI: 24.8 ± 4.1; < 18.5 (n = 3, 7%); 18.5–24.9 (n = 24, 56%); 25.0–29.9 (n = 11, 26%); 30.0–34.9 (n = 5, 11%) | 1 d (all eating occasions) | Participants prepared and served food in household; interviewer weighed all ingredients, dishes served, and leftovers | Image-assisted interviewer-administered 24-h dietary recall next day | Printed photograph atlas; 3–7 images per food | None |
| Nelson et al., 1996, (30) UK | Determine errors in conceptualization of portion size using photographs | 136 | 62 (46%) | 18–90; <30, n = 45; 30–44, n = 37; 45–64, n = 33; ≥65, n = 21 | BMI: M 26.8 ± 4.2; F 24.4 ± 3.8 | 1 d (1 meal) | Controlled feeding, ad libitum, research institute; 22 items available; food/beverages self-served from plates | Portion identification using photograph atlas immediately after eating | Printed photograph atlas; 8 images per food; able to state portion was greater/less than/between displayed images | Sex, age, BMI |
| Poppitt et al., 1998, (13) UK | Test whether underreporting in participants with and without obesity is selective for specific food types | 33 | 33 (100%) | 42 ± 14 | BMI: 32.9 ± 10.6; <30, n = 15; ≥30, n = 18 | 1 d (all eating occasions) | Controlled feeding, ad libitum, residential research institute; 84 items available; researchers served main meals, participants served snacks, condiments, and beverages | Self-administered previous day recall questionnaire | None | None |
| Robson and Livingstone, 2000, (31) UK | Evaluate errors incurred by young adults using single portion size color food photographs to quantify foods and nutrients consumed at 6 meals on 2 nonconsecutive days | 30 | 15 (50%) | 24.4 ± 3.6; 18–36 | BMI 23.0 ± 2.4 | 2 d (each day 3 meals) | Controlled feeding, ad libitum, research institute; 25 items available; participants self-served | Portion identification using photograph atlas next day | Printed food photographs; 1 image per food; able to select multiplicative or fraction of portion shown | Gender |
| Rumpler et al., 2008, (19) USA | Investigate magnitude and relative contribution of different sources of measurement errors in food intake estimation via 24-h recall | 12 | 0 (0%) | 39 ± 9 | BMI: 24.1 ± 1.4 | 2 d (all eating occasions) | Controlled feeding, ad libitum, research institute; >100 items available per d; foods served by researchers | Interviewer-administered 24-h dietary recall (AMPM), by telephone, next day | Printed food model booklet with images of vessels and utensils | None |
| Subar et al., 2010, (32) USA | Assess portion-size estimate accuracy and participant preferences using various digital image presentations | 29 | ∼50% | 18–69 | — | 2 meals | Controlled feeding, ad libitum, office setting; 9 items tested; self-served by participants | Web-based self-administered photo atlas for portion size recall next day | Digital images of foods; 4 or 8 images; able to state more/less than largest/smallest image | None |
| Wein et al., 1990, (41) Canada | Investigate accuracy of recalled estimates of portion sizes of food consumed at meals previous day | 61 | 27 (44%) | 17–55 | — | 1 day (1–3 meals) | Direct observation, standard portions, cafeteria; 39 items available; served by cafeteria staff | Portion identification next day | Food models and containers | Sex |
| Widaman et al., 2017, (33) USA | Validate use of computer-based dietary assessment method in women with overweight and obesity | 45 | 45 (100%) | 37.4 ± 9.7; 19–50 | BMI: 31.1 ± 3.6, 27–39.9 | 1 d (3 meals, 1 snack) | Controlled feeding, standard portions, research institute; breakfast, lunch, and afternoon snack served by research staff; dinner meal packed; each item labeled with food type and quantity | ASA24 next day | Digital images of foods; 1–10 images per food; able to state more/less than largest/smallest image | None |
Values are presented as means ± SDs or ranges unless otherwise indicated. ASA24, Automated Self-Administered 24-h dietary recall system; AMPM, interviewer-administered Automated Multiple-Pass Method recall; R24W, self-administered web-based 24-h dietary recall; PSEA = portion size estimation aid.
Data from 2964 participants were included, with sample sizes ranging from 12 to 361 participants across studies. Most studies included men and women (n = 19), whereas 9 studies included only women (13, 26, 28, 29, 33, 36, 43, 46, 48), and 1 study included only men (19). Participants aged 30–50 y were most commonly included, although 16 of the studies included participants aged ≥60 y. Fourteen studies included participants with diverse weight status (BMIs ranging from <25 to >30 kg/m2), whereas 10 studies did not report the weight status of the participants.
Risk of bias assessment
The risk of bias in studies (assessed by the QualSyst tool) ranged from 8 to 22 (median 18), of a maximum of 22 points (Table 4). The most frequently unfulfilled criteria were “investigator blinding” and “appropriate sample size.” Seven of the 29 studies reported that investigators collecting or processing self-reported dietary intake data had not been present during the collection of observed dietary intake data. Only 2 studies reported a power calculation, and 7 studies noted small sample size as a study limitation. Additionally, in more than half of the studies, the participants did not consume every food tested, further reducing the power when all foods were not consumed. The study with the lowest-bias assessment score (8) was reported as a short communication (12), which was limited by word count on the level of detail that could be included. No studies were excluded from the systematic review based on their quality score.
TABLE 4.
Risk of bias assessment of included studies (n = 29) using the QualSyst tool1
| Authors, date | Research question | Study design | Participant selection | Description of participant characteristics | Investigator blinding | Well-defined outcome | Appropriate sample size | Analytic methods | Estimate of variance | Results | Conclusions | Total score (max 22) |
|---|---|---|---|---|---|---|---|---|---|---|---|---|
| Amougou et al., 2016 (34) | 2 | 2 | 2 | 2 | 0 | 2 | 1 | 2 | 2 | 2 | 1 | 18 |
| Blake et al., 1989 (36) | 2 | 2 | 1 | 2 | 0 | 2 | 1 | 2 | 2 | 2 | 2 | 18 |
| Bouchoucha et al., 2016 (35) | 2 | 2 | 1 | 2 | 0 | 2 | 0 | 2 | 2 | 2 | 2 | 17 |
| Chambers et al., 2000 (37) | 2 | 2 | 0 | 1 | 0 | 2 | 1 | 2 | 2 | 2 | 2 | 16 |
| Chan et al., 2021 (42) | 2 | 2 | 2 | 2 | 0 | 2 | 1 | 2 | 0 | 2 | 2 | 17 |
| De Keyzer et al., 2011 (44) | 2 | 2 | 2 | 2 | 0 | 2 | 1 | 2 | 2 | 2 | 2 | 19 |
| Faggiano et al., 1992 (45) | 2 | 2 | 2 | 1 | 1 | 2 | 1 | 2 | 2 | 2 | 2 | 19 |
| Flax et al., 2019 (46) | 2 | 2 | 2 | 2 | 0 | 2 | 2 | 2 | 2 | 2 | 2 | 20 |
| Garden et al., 2018 (47) | 2 | 2 | 2 | 2 | 0 | 2 | 1 | 2 | 2 | 2 | 2 | 19 |
| Gemming and Ni Mhurchu, 2016 (58) | 0 | 1 | 0 | 2 | 0 | 1 | 0 | 1 | 0 | 1 | 2 | 8 |
| Gewa et al., 2009 (48) | 2 | 2 | 2 | 1 | 0 | 2 | 1 | 2 | 2 | 1 | 2 | 17 |
| Godwin et al., 2004 (38) | 2 | 2 | 2 | 2 | 0 | 2 | 1 | 2 | 2 | 2 | 2 | 19 |
| Harnack et al., 2004 (39) | 2 | 2 | 2 | 2 | 0 | 2 | 1 | 2 | 2 | 1 | 2 | 18 |
| Harris-Fry et al., 2016 (25) | 2 | 2 | 2 | 2 | 2 | 2 | 1 | 2 | 2 | 2 | 2 | 21 |
| Hernandez et al., 2006 (40) | 2 | 2 | 1 | 2 | 0 | 2 | 1 | 2 | 2 | 2 | 2 | 18 |
| Huybregts et al., 2008 (26) | 2 | 2 | 2 | 1 | 2 | 2 | 2 | 2 | 2 | 2 | 2 | 21 |
| Kim et al., 2021 (43) | 2 | 2 | 2 | 2 | 0 | 2 | 0 | 2 | 0 | 2 | 2 | 16 |
| Kirkpatrick et al., 2014 (14) | 2 | 2 | 2 | 2 | 2 | 2 | 1 | 2 | 2 | 2 | 2 | 21 |
| Kirkpatrick et al., 2016 (27) | 2 | 2 | 2 | 2 | 2 | 2 | 1 | 2 | 2 | 2 | 2 | 21 |
| Kirkpatrick et al., 2019 (28) | 2 | 2 | 2 | 2 | 2 | 2 | 2 | 2 | 2 | 2 | 2 | 22 |
| Lafrenière et al., 2017 (57) | 2 | 2 | 2 | 2 | 0 | 2 | 1 | 2 | 2 | 2 | 2 | 19 |
| Lazarte et al., 2012 (29) | 2 | 2 | 1 | 2 | 2 | 2 | 0 | 2 | 2 | 2 | 2 | 19 |
| Nelson et al., 1996 (30) | 2 | 2 | 2 | 2 | 0 | 2 | 1 | 2 | 2 | 2 | 1 | 18 |
| Poppitt et al., 1998 (13) | 2 | 2 | 2 | 2 | 2 | 2 | 1 | 2 | 2 | 1 | 1 | 19 |
| Robson and Livingstone, 2000 (31) | 2 | 2 | 2 | 2 | 0 | 2 | 0 | 2 | 2 | 2 | 2 | 18 |
| Rumpler et al., 2008 (19) | 2 | 2 | 1 | 2 | 0 | 2 | 0 | 2 | 2 | 2 | 2 | 17 |
| Subar et al., 2010 (32) | 2 | 2 | 2 | 0 | 0 | 2 | 0 | 2 | 1 | 1 | 1 | 13 |
| Wein et al., 1990 (41) | 2 | 1 | 1 | 1 | 0 | 2 | 1 | 2 | 2 | 2 | 2 | 16 |
| Widaman et al., 2017 (33) | 2 | 2 | 2 | 2 | 0 | 2 | 1 | 2 | 2 | 2 | 2 | 19 |
2, yes; 1, partial; 0, no. Three QualSyst items not applicable to this review: description of randomization, blinding of participants, and confounding.
Intrusion measures and results
Measures relating to intrusions of food items were reported in 7 studies (Table 5), but only 2 reported intrusions according to food group (19, 43). Using variance decomposition methods on the variance of the mean difference between observed and reported intake, Rumpler et al. (19) reported the proportion of variance in energy intake error within a food group attributable to intrusions. The total variance in error was calculated by summing the variance for each of the 4 error contributors, plus the covariances for each pair of contributors (e.g., the covariance between intrusion and misclassification). In that study, intrusions contributed to the greatest proportion of variance in error in intake of meats (53%), followed by fruits and juices (46%), beverages (23%), grains (11%), vegetables (4%), and other items (2%). Intrusions contributed to no variance in error in intake of dairy, fats and oils, and sweets (19). Kim et al. (43) reported the mean number of intrusions for each food type. Intrusions were found only for the condiment kimchi, which was reported by 2 participants (out of 30) on occasions on which it had not been served or consumed (43).
TABLE 5.
Food group error outcomes and effect size metrics reported, by study, among studies identified in a systematic review of food and beverage misestimation1
| Authors, date | Error contributor reported | ||||
|---|---|---|---|---|---|
| Total error | Intrusions | Omissions | Misclassifications | Portion misestimation | |
| Amougou et al., 2016 (34) | — | — | — | — | Count and percentage of estimations correct (within 10%), overestimated (>10%), and underestimated (<10%) |
| Blake et al., 1989 (36) | Mean ± SD estimated weight in ounces or teaspoons; observed weight in ounces or teaspoons; percentage difference between observed and estimated weight; percentage of estimations correct, overestimated, and underestimated (not defined) | — | — | — | — |
| Bouchoucha et al., 2016 (35) | Mean ± SD estimated weight in grams; mean ± SD observed weight in grams; mean percentage difference (P value, 95% CI, LOA) between estimated and observed weight; Bland–Altman plots of estimated and observed weights for meat, vegetables, and fruits | — | — | — | — |
| Chambers et al., 2000 (37) | Mean difference in grams or mL (P value) between estimated and observed weight; mean percentage difference (P value) between estimated and observed weight/volume | — | — | — | — |
| Chan et al., 2021 (42) | — | — | Counts of times excluded for most excluded items | — | — |
| De Keyzer et al., 2011 (44) | — | — | Number of people making omissions | — | Mean difference in grams (± SD, P value) between estimated and observed weight; mean percentage difference between estimated and observed weight |
| Faggiano et al., 1992 (45) | Mean difference in grams (95% CL) between estimated and observed weight; mean percentage difference between estimated and observed weight | — | — | — | — |
| Flax et al., 2019 (46) | Mean difference in grams (SE, P value) between estimated and observed weight; mean percentage difference between estimated and observed weight | — | — | — | — |
| Garden et al., 2018 (47) | Median (IQR) estimated weight in grams; median (IQR, P value above/below 0.05) of observed weight in grams; mean percentage difference in grams between estimated and observed weight | — | Proportion of foods recalled (%) calculated as total number of times an item was reported divided by total number of times it was consumed (inverse of omission rate) | — | — |
| Gemming and Ni Mhurchu, 2016 (58) | — | — | Counts of times excluded | — | — |
| Gewa et al., 2009 (48) | Ratio (%) of recalled to weighed intakes | Proportion of participants with ≥1 intrusion (%) | Proportion of participants with ≥1 omission (%) | — | — |
| Godwin et al., 2004 (38) | — | — | — | — | Mean percentage difference ± SD between estimated and observed weight, presented in figure with estimates shown |
| Harnack et al., 2004 (39) | — | — | — | — | Mean ± SD estimated weight in ounces and kilocalories; mean ± SD observed weight in ounces and kilocalories |
| Harris-Fry et al., 2016 (25) | — | — | — | — | Mean ± SD estimated weight in grams; mean ± SD observed weight in grams; mean percentage difference (SE) between estimated and observed weight |
| Hernandez et al., 2006 (40) | — | — | — | — | Mean ± SD estimated weight in grams or mL; mean ± SD observed weight in grams or mL; mean difference in grams or mL ± SD between estimated and observed weight; mean percentage difference ± SD between estimated and observed weight |
| Huybregts et al., 2008 (26) | — | — | — | — | Mean difference in grams (SE, P value) between estimated and observed weight of food using portion atlas; mean percentage difference between estimated and observed weight of food using portion atlas |
| Kim et al., 2021 (43) | — | Average number of intrusions per participant for each food group for each study day | Mean proportion of exclusions for each food group for each study day | Mean proportion of “close” matches for each food group for each study day; mean proportion of “far” matches for each food group for each study day | Mean proportion of accurate estimates (90–110% of observed intake) for each food group for each study day; mean proportion of similar estimates [underestimates] (51–89% of observed intake) for each food group for each study day; mean proportion of similar estimates [overestimates] (111–199% of observed intake) for each food group for each study day; mean proportion of inaccurate estimates [underestimates] (≤50% of observed intake) for each food group for each study day; mean proportion of inaccurate estimates [overestimates] (≥200% of observed intake) for each food group for each study day; mean proportion of missing portion sizes |
| Kirkpatrick et al., 2014 (14) | — | Mean proportion of intrusions (all foods combined) | Mean proportion of exclusions for all foods combined; counts of times excluded for most excluded items | Proportion of total “close” and “far” matches of food descriptions (all foods combined) | Mean difference in cups/ounces (95% CI) between estimated and observed weight |
| Kirkpatrick et al., 2016 (27) | — | — | — | — | Mean difference in grams (95% CI) between estimated and observed weight; mean ratio (95% CI) of estimated to observed weight |
| Kirkpatrick et al., 2019 (28) | — | Average number of intrusions per participant (all foods combined) | Mean proportion of exclusions for all foods combined; total number of times excluded/total number of times consumed, for each food group; average excluded mass in grams among excluders, for each food group; average excluded energy in kcal among excluders, for each food group | Proportion of total “close” and “far” matches of food descriptions (all foods combined) | Mean difference in cups/ounces (95% CI) between estimated and observed weight; mean proportion of estimates within 10% and 25% of observed amount |
| Lafrenière et al., 2017 (57) | — | Average number of intrusions per participant (all foods combined) | Mean proportion of omissions for all foods combined; total number of times excluded/total number of times offered, for each food group; mean percentage contribution of omissions to daily energy intake | Proportion of total “close” and “far” matches of food descriptions (all foods combined) | — |
| Lazarte et al., 2012 (29) | Median difference in grams (IQR), and geometric mean ratio (95% LOA) between estimated and observed weight | — | — | — | — |
| Nelson et al., 1996 (30) | — | — | — | — | Mean difference in grams ± SD, P value) between estimated and observed weight of food using portion atlas; mean percentage difference ± SD between estimated and observed weight of food using portion atlas |
| Poppitt et al., 1998 (13) | — | — | Percentage frequency that observed foods were recalled (presented in a figure without exact values shown) | — | — |
| Robson and Livingstone, 2000 (31) | — | — | — | — | Mean ± SD estimated weight in grams using food portion atlas; mean (± SD, P value) observed weight in grams, mean percentage difference between estimated and observed weight of food using portion atlas |
| Rumpler et al., 2008 (19) | Average difference (joules) between estimated and observed intake | Proportion of variance in energy (joules) error attributed to intrusion error (%) | Proportion of variance in energy (joules) error attributed to omission error (%) | Proportion of variance in energy (joules) error attributed to misclassification error (%) | Proportion of variance in energy (joules) error attributed to mass error (%) |
| Subar et al., 2010 (32) | — | — | — | — | Mean absolute difference in grams between estimated and observed weight; percentage of estimates within 10% of observed weight |
| Wein et al., 1990 (41) | — | — | — | — | Mean percentage ± SD of observed portion size that was estimated; distribution of percentage differences between estimated and observed amounts |
| Widaman et al., 2017 (33) | — | Mean ± SD proportion of falsely included items (all foods combined) | Mean ± SD proportion of items not reported; odds of exclusion of each food group as compared with average exclusion rate (OR, 95% CI, beta, SE, P value) | Mean proportion of “close” and “far” matches of food descriptions (all foods combined) | Mean (SE) estimated weight in grams of exact matches; mean (SE) observed weight in grams of exact matches; mean percentage difference (SE, P value) between estimated and observed weight of exact matches |
CL, confidence limits; LOA, limits of agreement.
Three studies reported the average number of intrusions per participant (14, 15, 28), 1 study provided the proportion of intrusions (33), and 1 study reported the proportion of participants with ≥1 intrusion (48). None of these studies presented this information according to food type, which may be because intrusions were low in frequency; thus, comparisons across food groups were not possible.
Omission measures and results
Twelve studies reported measures of omission, using a range of approaches (Table 5). Table 6 presents all results reported on omission measures. Four studies reported the number of times an item was omitted in relation to the number of times it was offered (15, 28, 33, 43); of these, 2 studies reported mean omission rates at the participant level (33, 43), but only 1 included a measure of dispersion (33). Widaman et al. (33) reported the variation in individual omission rates within food groups, which was highest for sugars added to foods/beverages (SD 50.0%), and lowest for food sources of animal protein (SD 22.9%). Widaman et al. (33) also reported the odds of omission for each food in comparison with the average rate of omission. Higher odds of excluding sugars added to foods/beverages (OR: 4.06; 95% CI: 2.88, 7.22) and nuts/seeds (OR: 1.80; 95% CI: 1.18, 2.76) were observed compared with the overall study average (33). In contrast, lower odds of excluding food sources of animal protein were observed (OR: 0.29; 95% CI: 0.14, 0.61). Kim et al. (43) provided estimates of mean omission rates by food group from a 3-d study that included training on completing dietary records and estimating portion size on day 2. Overall omission rates were lower on day 3 of the study. Omission rates were lowest for rice on days 2 and 3 (0%), and highest for soup (15%, day 2) and spreads (14%, day 2) (43).
TABLE 6.
Results on items omitted in included studies reporting this outcome measure (n = 10), arranged according to self-report dietary assessment instrument
| Authors | Omission-related outcome measure | Food/beverage items reported in study | Value |
|---|---|---|---|
| Interviewer-administered dietary recalls | |||
| Chan et al., 2021 (42) | Counts of times excluded for most excluded items | Vegetables | 93 |
| Savory sauces and condiments | 73 | ||
| Fruit | 72 | ||
| Confectionery | 56 | ||
| Breads and cereals | 39 | ||
| Milk/milk alternatives | 52 | ||
| Tea | 40 | ||
| Sugar-sweetened beverages | 28 | ||
| Coffee | 26 | ||
| Juice | 14 | ||
| Body-building and related beverages | 14 | ||
| Garden et al., 2018 (47) | Match rate, %, group totals (correctly reported/eaten * 100) (values in this table are derived; 100 minus proportion of matches) | Beans, lentils, peas (pulses) | 10% |
| Beers and ciders | 11% | ||
| Biscuits | 17% | ||
| Breakfast cereals | 8% | ||
| Cakes, pastries, buns, and savories | 16% | ||
| Carbonated drinks | 12% | ||
| Cheeses | 14% | ||
| Condiments | 32% | ||
| Confectionery (chocolate) | 14% | ||
| Confectionery (non-chocolate) | 4% | ||
| Eggs | 17% | ||
| Fish | 22% | ||
| Flours, grains, and starches | 33% | ||
| Fruit | 17% | ||
| Fruit juices | 15% | ||
| Herbs and spices | 48% | ||
| Ice cream | 9% | ||
| Meat | 11% | ||
| Milk, milk-based drinks, and creams | 2% | ||
| Nuts and seeds | 29% | ||
| Oils | 34% | ||
| Pasta | 9% | ||
| Pizza | 0% | ||
| Potato chips and potato products | 13% | ||
| Potatoes | 8% | ||
| Puddings and chilled dessert | 20% | ||
| Rice | 21% | ||
| Salt | 80% | ||
| Sandwiches and breads | 20% | ||
| Sauces | 15% | ||
| Savory snacks | 16% | ||
| Soups | 11% | ||
| Spirits | 7% | ||
| Spreading fats | 10% | ||
| Squash and cordials | 32% | ||
| Sugar and sweeteners | 7% | ||
| Syrups and preserves | 9% | ||
| Vegetables and vegetable dishes | 9% | ||
| Water and drinks | 19% | ||
| Wines | 13% | ||
| Yogurts | 19% | ||
| Gemming and Ni Mhurchu, 2016 (58) | Counts of times excluded | Alcohol | 7 |
| Beverages | 40 | ||
| Breads/rice/cereals | 23 | ||
| Condiments | 50 | ||
| Dairy | 18 | ||
| Fruit and vegetables | 47 | ||
| Meat/fish/eggs | 11 | ||
| Other items | 5 | ||
| Snacks (e.g., biscuits, muesli bars, and chips) | 64 | ||
| Kirkpatrick et al., 2014 (14) | Omission rate, %, group total (omitted/eaten * 100) | Drinks | 6% |
| Fruit and vegetables | 27% | ||
| Sweets, snacks, and desserts | 3% | ||
| Counts of times excluded for most excluded items | Tomatoes | 26 | |
| Mustard | 17 | ||
| Green and/or red pepper | 19 | ||
| Cucumber | 14 | ||
| Cheddar cheese | 18 | ||
| Lettuce | 17 | ||
| Mayonnaise | 12 | ||
| Rumpler et al., 2008 (19) | Proportion of variance in energy (joules) error attributed to omission error | Beverages | 5% |
| Dairy | 30% | ||
| Fruits and juices | 26% | ||
| Grains | 64% | ||
| Fats and oils | 18% | ||
| Meats | 0% | ||
| Other | 27% | ||
| Sweets | 0% | ||
| Vegetables | 18% | ||
| Self-administered 24-h dietary recalls | |||
| Kirkpatrick et al., 2014 (14) | Omission rate, %, group total (omitted/eaten * 100) | Drinks | 5% |
| Fruit and vegetables | 33% | ||
| Sweets, snacks, and desserts | 13% | ||
| Counts of times excluded for most excluded items | Tomatoes | 42 | |
| Mustard | 17 | ||
| Green and/or red pepper | 16 | ||
| Cucumber | 15 | ||
| Cheddar cheese | 14 | ||
| Lettuce | 12 | ||
| Mayonnaise | 9 | ||
| Kirkpatrick et al., 2019 (28) | Number of times excluded/number of times consumed, group total Derived for this table: Omission rate, %, (omitted/eaten × 100) | ASA24, assisted by interviewer | |
| Bread, white | 9% | ||
| Broccoli, cooked | 27% | ||
| Carrots, cooked | 20% | ||
| Cheddar cheese | 40% | ||
| Cookie | 28% | ||
| Cucumber | 69% | ||
| Garlic bread | 55% | ||
| Lettuce | 20% | ||
| Mayonnaise | 53% | ||
| Mustard | 58% | ||
| Pasta with pesto sauce | 29% | ||
| Red or green peppers | 77% | ||
| Rice pilaf | 29% | ||
| Sugar | 37% | ||
| Tomatoes | 51% | ||
| Vegetable lasagna | 20% | ||
| Water, bottled, unsweetened | 11% | ||
| White potato chips | 23% | ||
| ASA24, unassisted by interviewer | |||
| Bread, white | 13% | ||
| Broccoli, cooked | 32% | ||
| Carrots, cooked | 39% | ||
| Cheddar cheese | 45% | ||
| Cookie | 25% | ||
| Cucumber | 69% | ||
| Garlic bread | 63% | ||
| Lettuce | 19% | ||
| Mayonnaise | 49% | ||
| Mustard | 77% | ||
| Pasta with pesto sauce | 40% | ||
| Red or green peppers | 71% | ||
| Rice pilaf | 26% | ||
| Sugar | 39% | ||
| Tomatoes | 54% | ||
| Vegetable lasagna | 19% | ||
| Water, bottled, unsweetened | 19% | ||
| White potato chips | 28% | ||
| Average consumed mass (g) among excluders, mean ± SE | ASA24, assisted and unassisted | ||
| Tomatoes | 12.3 ± 0.37 | ||
| Red or green peppers | 14.7 ± 0.55 | ||
| Cucumber | 5.75 ± 0.22 | ||
| Cheddar cheese | 12.1 ± 0.73 | ||
| Lettuce | 7.32 ± 0.80 | ||
| Garlic bread | 17.6 ± 1.19 | ||
| Mustard | 2.19 ± 0.07 | ||
| Mayonnaise | 6.25 ± 0.25 | ||
| Rice pilaf | 64.3 ± 4.72 | ||
| Broccoli, cooked | 45.9 ± 3.24 | ||
| Pasta with pesto sauce | 62.0 ± 4.49 | ||
| Carrots, cooked | 44.8 ± 3.50 | ||
| Cookie | 30.7 ± 2.64 | ||
| Vegetable lasagna | 108 ± 10.3 | ||
| White potato chips | 22.7 ± 1.14 | ||
| Bread, white | 29.0 ± 2.51 | ||
| Sugar | 11.1 ± 1.37 | ||
| Water, bottled, unsweetened | 342 ± 22.4 | ||
| Average consumed energy (kcal) among excluders, mean ± SE | Tomatoes | 2.35 ± 0.07 | |
| Red or green peppers | 1.47 ± 0.05 | ||
| Cucumber | 0.69 ± 0.03 | ||
| Cheddar cheese | 51.1 ± 3.10 | ||
| Lettuce | 1.14 ± 0.11 | ||
| Garlic bread | 66.9 ± 4.51 | ||
| Mustard | 1.47 ± 0.05 | ||
| Mayonnaise | 42.5 ± 1.73 | ||
| Rice pilaf | 87.4 ± 6.42 | ||
| Broccoli, cooked | 22.9 ± 1.62 | ||
| Pasta with pesto sauce | 179 ± 13.0 | ||
| Carrots, cooked | 22.4 ± 1.75 | ||
| Cookie | 124 ± 10.7 | ||
| Vegetable lasagna | 139 ± 13.3 | ||
| White potato chips | 123 ± 6.16 | ||
| Bread, white | 40.0 ± 3.19 | ||
| Sugar | 43.1 ± 5.27 | ||
| Water, bottled, unsweetened | 0 ± 0 | ||
| Lafrenière et al., 2017 (57) | Omission rate, %, group total (omitted/eaten * 100) | BBQ sauce | 19% |
| Blueberries | 11% | ||
| Broccoli (as a side dish) | 11% | ||
| Cauliflower (as a side dish) | 11% | ||
| Celery (in a mixed dish) | 53% | ||
| Cheddar cheese | 37% | ||
| Chicken | 23% | ||
| Coleslaw (as a side dish) | 9% | ||
| Corn (in a mixed dish) | 38% | ||
| Cranberries | 23% | ||
| Cucumbers (as a side dish) | 15% | ||
| Cucumbers (in a mixed dish) | 85% | ||
| Feta cheese | 77% | ||
| Mayonnaise | 46% | ||
| Milk | 17% | ||
| Milk shake | 12% | ||
| Onions (in a mixed dish) | 54% | ||
| Peppers (in a mixed dish) | 53% | ||
| Potatoes (as a side dish) | 13% | ||
| Raspberries | 33% | ||
| Salsa | 54% | ||
| Sweet bread/muffin | 8% | ||
| Sweet potatoes (as a side dish) | 66% | ||
| Tomatoes (as a side dish) | 15% | ||
| Tomatoes (in a mixed dish) | 23% | ||
| Vinaigrette | 54% | ||
| Yogurt | 10% | ||
| Mean contribution of omissions to daily energy intake (%) | Vegetables in a salad or mixed dish | 1% | |
| Side vegetables | 3% | ||
| Snacks/drinks | 6% | ||
| Sauces | 2% | ||
| Ingredients in a salad | 4% | ||
| Widaman et al., 2017 (33) | Average omission rate, %, mean ± SD (omitted/eaten * 100) | Dairy | 12.1% ± 32.7% |
| Added fat | 15.6% ± 36.4% | ||
| Fruit | 21.5% ± 41.3% | ||
| Grain | 15.1% ± 35.9% | ||
| Nuts/seeds | 25.6% ± 43.9% | ||
| Animal protein | 5.5% ± 22.9% | ||
| Added sugars | 45.5% ± 50.0% | ||
| Vegetables | 12.0% ± 32.6% | ||
| Odds of exclusion (OR, 95% CI) | Dairy | 0.68 (0.45, 1.01) | |
| Added fat | 0.94 (0.56, 1.60) | ||
| Fruit | 1.37 (0.85, 2.21) | ||
| Grain | 0.85 (0.59, 1.23) | ||
| Nuts/seeds | 1.80 (1.18, 2.76) | ||
| Animal protein | 0.29 (0.14, 0.61) | ||
| Added sugars | 4.06 (2.28, 7.22) | ||
| Vegetables | 0.65 (0.41, 1.03) | ||
| Dietary record | |||
| Chan et al., 2021 (42) | Counts of times excluded for most excluded items | Savory sauces and condiments | 142 |
| Vegetables | 95 | ||
| Confectionery | 68 | ||
| Fruit | 56 | ||
| Dairy and alternatives | 55 | ||
| Milk/milk alternatives | 55 | ||
| Alcohol | 32 | ||
| Tea | 29 | ||
| Sugar-sweetened beverages | 28 | ||
| Coffee | 22 | ||
| Kim et al., 2021 (43) | Average omission rate, %, mean (omitted/eaten * 100) | Beverages, day 1 | 10.0% |
| Beverages, day 2 | 6.7% | ||
| Beverages, day 3 | 0.0% | ||
| Fruits, day 1 | 10.0% | ||
| Fruits, day 2 | 13.3% | ||
| Fruits, day 3 | 2.2% | ||
| Grains, day 1 | 4.7% | ||
| Grains, day 2 | 3.0% | ||
| Grains, day 3 | 1.1% | ||
| Kimchi, day 1 | 3.3% | ||
| Kimchi, day 2 | 5.0% | ||
| Kimchi, day 3 | 1.1% | ||
| Meat, fish, eggs, and beans, day 1 | 9.2% | ||
| Meat, fish, eggs, and beans, day 2 | 10.0% | ||
| Meat, fish, eggs, and beans, day 3 | 0.0% | ||
| Rice, day 1 | 5.0% | ||
| Rice, day 2 | 0.0% | ||
| Rice, day 3 | 0.0% | ||
| Side dishes, day 1 | 5.7% | ||
| Side dishes, day 2 | 7.8% | ||
| Side dishes, day 3 | 1.3% | ||
| Snacks, day 1 | 3.3% | ||
| Snacks, day 2 | 4.0% | ||
| Snacks, day 3 | 3.1% | ||
| Soup, day 1 | 8.3% | ||
| Soup, day 2 | 15.0% | ||
| Soup, day 3 | 2.2% | ||
| Spreads, day 1 | 10.0% | ||
| Spreads, day 2 | 14.4% | ||
| Vegetables, day 1 | 6.6% | ||
| Vegetables, day 2 | 5.5% | ||
| Vegetables, day 3 | 1.8% | ||
Two studies calculated omission rate using summed data from the whole study sample, rather than a mean omission rate at the participant level (15, 28). Lafrenière et al. examined the contribution of omission to daily energy intake by food group; the contribution was highest for snacks/drinks (6.2% of energy intake), and lowest for vegetables in a salad or mixed dish (0.7% of energy intake) (15). One study reported the inverse of the omission rate, known as the match rate, i.e., the total number of times an item was reported divided by the total number of times it was consumed in the study (47). Similarly, 1 study provided the percentage frequency of observed foods/beverages that were reported (13). Savory sauces and sugar added to foods/beverages were underreported with the greatest magnitude, and snacks were underreported to a greater extent than main meals (13).
Using variance decomposition methods on the variance of the mean difference between observed and reported intake, 1 study reported the proportion of variance in energy intake error within a food group that was attributable to omissions (19). In that study, 64% of variance in error in grain intake was due to omission, whereas no more than 30% of the variance in error was attributed to omission in other food groups. Omissions did not contribute to variance in error in intake of meats and sweets (19).
Three studies reported counts of the number of times items were excluded for various food items (12, 14, 42). Kirkpatrick et al. (14) reported that additions to main items or ingredients rather than main items were more frequently omitted. For example, the most commonly omitted item was tomato (in salad and in sandwiches), followed by mustard (in sandwich), green and/or red pepper (in a salad), cucumber (in a salad), cheddar cheese (grated in salad), lettuce (green salad), and mayonnaise (in a sandwich) (14). Gemming et al. (12) reported that snacks (e.g., biscuits, muesli bars, and chips), followed by condiments and fruit and vegetables, were the most frequently omitted items (12). In a study using both a dietary record and an interviewer-administered 24-h dietary recall, Chan et al. (42) reported that savory sauces and condiments and vegetables were the most commonly omitted items from both methods, but were omitted to a greater extent with the dietary record (42). Other omission measures reported were the proportion of participants with ≥1 omission (48) and the number of people making omissions (44) (Table 6).
Figure 3 displays the omission rates from the 6 studies in which this measure was reported or derived for this review (14, 15, 28, 33, 43, 47). Among these studies, 3 provided participants with ad libitum intake of foods and beverages (14, 28, 47) and 3 provided preportioned items (15, 33, 43). Most items were omitted less than one-third of the time. The highest omission rates (>50%) were observed for vegetables, condiments, cheese, and bread and bread products. Some food groups included very broad ranges of omission rates, such as vegetables (vegetables not further specified, 2%; cucumber, 85%). Broad ranges of omission rates were also observed for condiments (kimchi, 1%; mustard, 77%; salt, 80%), cheese (cheese not further specified, 14%; feta cheese, 77%), and bread products (bread, 3%; garlic bread 63%). For vegetables, this broad range appeared to be related to how the vegetable was prepared and served (Figure 4). Vegetables within composite dishes such as salads or sandwiches tended to have higher omission rates than vegetables served as a side dish to a main meal.
FIGURE 3.

Bubble plot of omission rates (proportion of times omitted/observed * 100) by food group in n = 6 studies [K14 (14), K19 (28), W (33), Ga (47), L (57), K (43)]. ASA24, Automated Self-Administered 24-h dietary recall system; AMPM, interviewer-administered Automated Multiple-Pass Method recall; Int 24HR, interviewer-administered 24-h recall; R24W, self-administered web-based 24-h dietary recall; Record, dietary record.
FIGURE 4.

Bubble plot of omission rates (proportion of times omitted/observed * 100) among vegetables reported in n = 5 studies [K19 (28), W (33), Ga (47), L (57), K (43)]. ASA24, Automated Self-Administered 24-h dietary recall system; Int 24HR, interviewer-administered 24-h recall; R24W, self-administered web-based 24-h dietary recall; Record, dietary record.
A narrower range of omission rates was observed for beverages (beverages not further defined, 0%, cordials, 32%), dairy excluding cheese (yogurt, 10%; yogurt, 19%), snacks (sweets, snacks, and desserts, 2%; nuts and seeds, 29%), fruit (fruits not further defined, 2%; raspberries, 33%), and pasta/grains (rice, 0%; pasta with pesto, 40%) (Figure 3). The variation and the limited number of data points in most food groups makes generalization difficult; however, beverages tended to be among the least frequently omitted items.
Misclassification measures and results
Two studies reported misclassifications according to food groups (19, 43) (Table 5). Examples of misclassifications were reporting of fried chicken as baked chicken (19), and reporting of soup with spinach as soup with another vegetable (43). Rumpler et al. (19) reported that misclassification contributed to the greatest proportion of energy misestimation among items in the “other” category (soups, nut butters, and frozen dairy desserts) (42%), followed by vegetables (40%), beverages (11%), dairy (9%), meats (8%), fats and oils (3%), grains (2%), and sweets (1%). Misclassification did not contribute to any error in intake of fruits and juices (19). Kim et al. (43) reported the proportion of close and far matches for each food group for each of 3 study days, and found that misclassification error was consistently present among side dishes (in 9–19% of items reported), and consistently absent among rice, grains, or kimchi. Misclassification error was low for beverages (0–3% of items) and variable among other food groups (43).
In 4 studies, foods and beverages reported by participants were coded as exact matches, close matches, or far matches (14, 15, 28, 33). None of these studies reported the proportion of exact, close, and far matches by food group, which may be because misclassifications were low in frequency; thus, comparisons across food groups were not possible.
Portion misestimation measures and results
Seventeen studies reported measures of portion size misestimation (Table 5), the most common of which was the mean difference between the estimated and observed weight of consumed items (n = 13). This mean difference was reported as grams/ounces in 8 studies (14, 26–28, 30, 32, 40, 44), as a percentage/ratio of observed intake in 9 studies (25–27, 30, 31, 33, 38, 41, 44), and as both grams and a percentage in 5 studies (26, 27, 30, 40, 44). Among the 8 studies reporting the difference between observed and estimated intake in grams, 6 studies reported a measure of dispersion (SDs, n = 3; SEs, n = 1; 95% CIs, n = 3). Four studies reported P values evaluating the difference between observed and estimated intake in grams (paired tests, n = 3; linear regression, n = 1). One study reported the portion misestimation in grams as an absolute difference between consumed and reported amount, but did not indicate the direction ( 32). Figures 5A and 5B present the data extracted on portion misestimation as difference in grams, according to food groups, between observed and estimated weights, from the 6 studies reporting a difference with a measure of dispersion. Results from Kirkpatrick et al. (14) are not presented in the figure as they originate from the same data as the Kirkpatrick et al. (27) study. In general, across food groups, estimates were within 50 g of the observed weight, but variable in direction (underestimates and overestimates). Fruits and vegetables were more often overestimated than underestimated. Within each food group, the majority of items had estimates with CIs that included zero, and this occurred for food items tested with larger sample sizes (n > 50), as well as those tested with smaller sample sizes. Exceptions included meats, in which single-unit items were significantly underestimated but other forms of meat were significantly overestimated; spreads (margarine), for which most items were significantly overestimated; and potato chips (2 data points), which were significantly underestimated.
FIGURE 5.

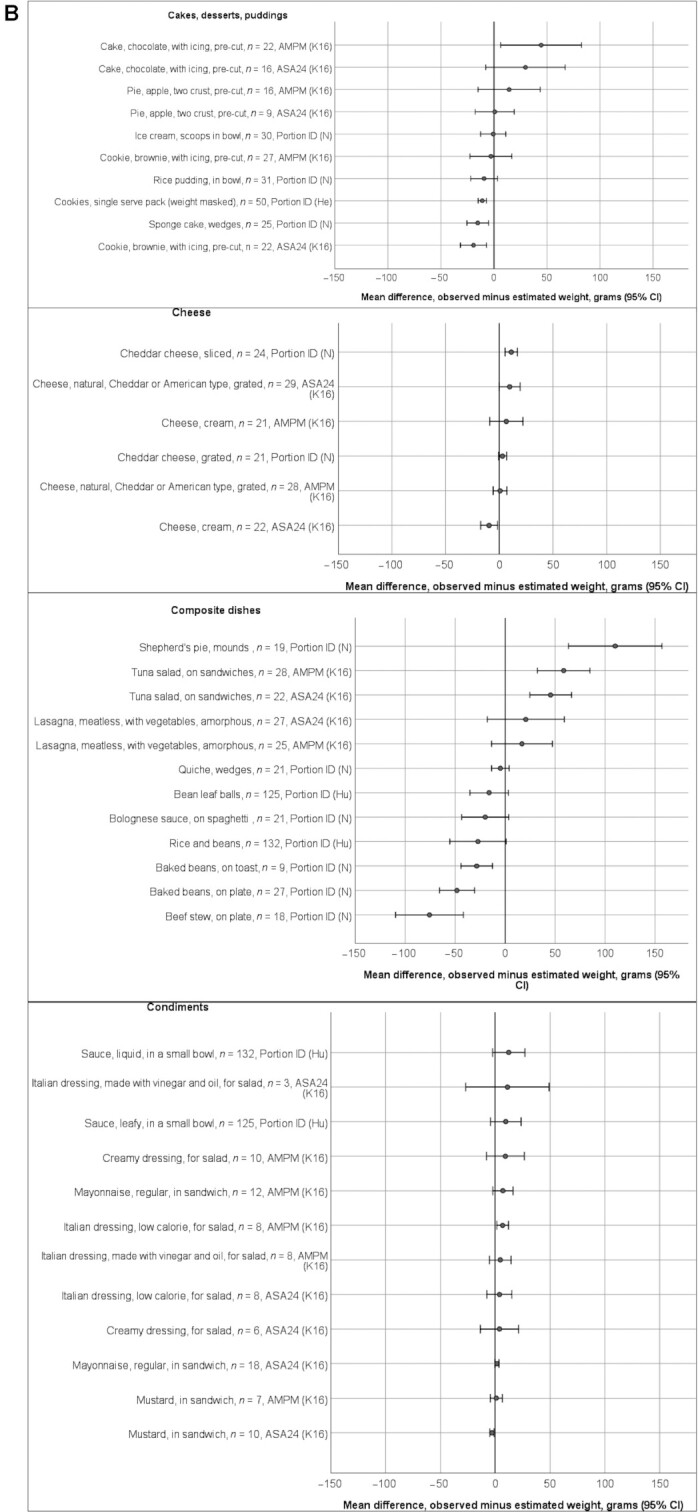

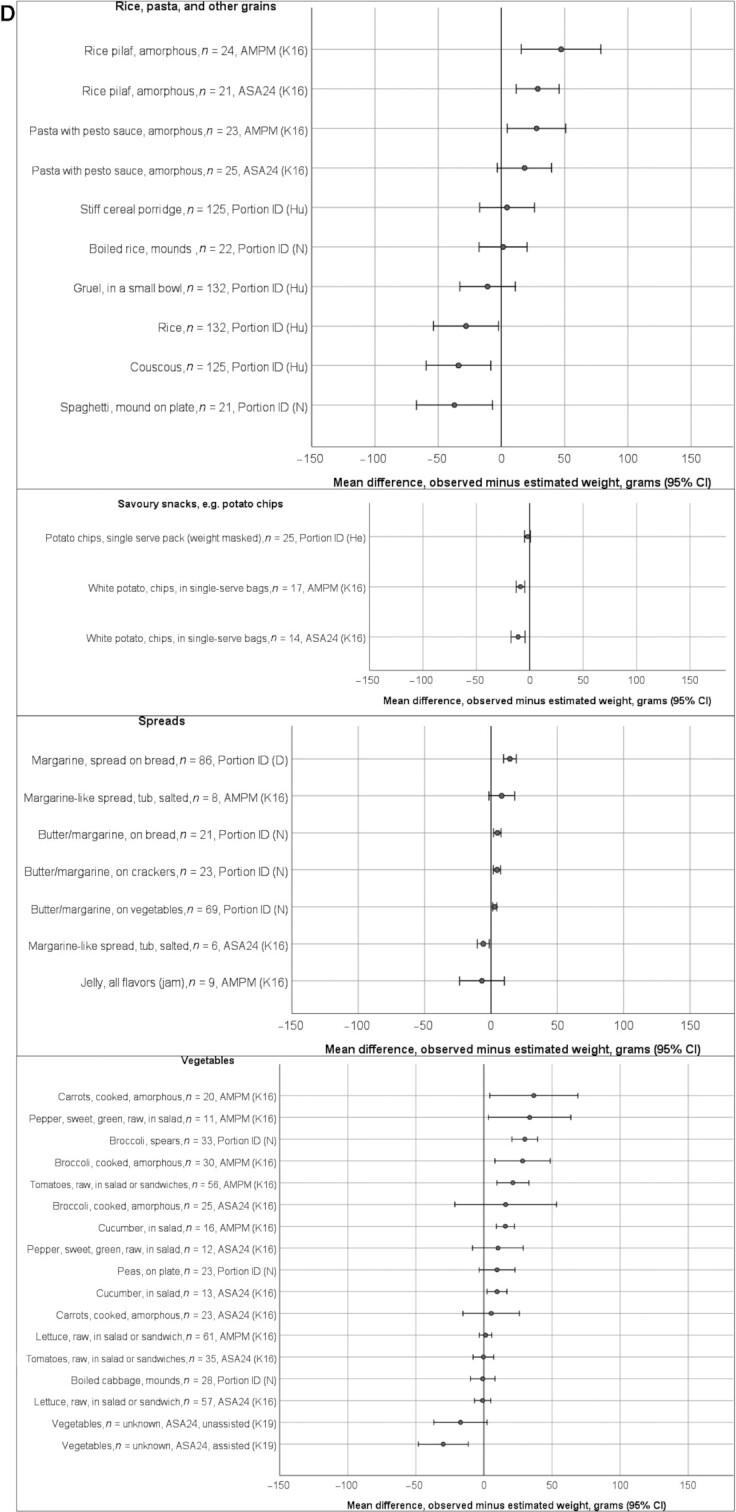
Mean differences in grams between estimated and observed weights of foods/beverages the following studies (n = 6):D (44), He (40), Hu (26), K16 (27), K19 (28), and N (30), presenting portion misestimation (observed minus estimated) with a measure of dispersion. The x-axis shows the food/beverage name, the sample size (n), the method, and the study. Results from (14) are not presented as they originate from the same data as (27). CIs were not reported, but derived from P values, SEs, or SDs for the following studies: (26, 30, 40, 44). Methods used: ASA24, AMPM, and Portion ID. The following groups are included: added sugar; beverages; bread and bread products; breakfast cereals (A); cakes, desserts, puddings; cheese; composite dishes; condiments (B); fruit; meat, fish, eggs; milk products (excluding cheese); potatoes and potato products (C); rice, pasta, and other grains; savory snacks; spreads; vegetables (D). ASA24, Automated Self-Administered 24-h dietary recall system; AMPM, interviewer-administered Automated Multiple-Pass Method recall; Portion ID, portion identification using photograph atlas.
The broadest CIs were observed for beverage items, indicating that across almost all studies there was between-participant variation in whether items were under- or overestimated. Greater magnitude of misestimations was observed in food groups in which items tended to be of greater mass or be consumed in greater amounts. For example, among composite dishes across studies, shepherd's pie (cooked minced meat topped with mashed potato) was the item with the largest overestimate (110 g; 95% CI: 63, 157) (30) whereas beef stew was the largest underestimate (−76 g; 95% CI: −110, −42) (30). Broad variation in estimates was also seen with beverages, with the largest overestimates for cow's milk, 2% fat (84 g; 95% CI: −1040, 1200) and coffee (72 g; 95% CI: 11, 132) and the largest underestimates for cola (−90 g; 95% CI: −450, 269) and cow's milk, 1% fat (−42 g; 95%: CI −95, 10) (Figure 5A). There were no obvious patterns in portion misestimation according to dietary assessment method (e.g., interviewer administered compared with self-administered; use of portion size estimation aids) or according to observation method.
Seven of the 9 studies reporting portion misestimation as a percentage or ratio of observed intake (25–27, 30, 31, 33, 38, 41, 44) reported a measure of dispersion (SDs, n = 3; SEs, n = 2; 95% CIs, n = 1; P25, P75, n = 1), and 1 study reported P values (linear regression). Figures 6A and 6B present the percentage difference between observed and estimated weights, according to food groups, from the 6 studies reporting a difference with a measure of dispersion from which a CI could be ascertained. In most food groups, most estimates were within ∼50% of the observed amount. However, in all food groups, there were estimates with CIs covering ±50% of the observed amount. Particularly large overestimates were observed among spreads and in the vegetables group, with estimates of some salad items (cucumber, tomatoes) close to twice the amount observed. CIs were broader for items that were typically consumed in smaller quantities or had smaller mass (such as condiments, added sugar, raw salad vegetables).
FIGURE 6.
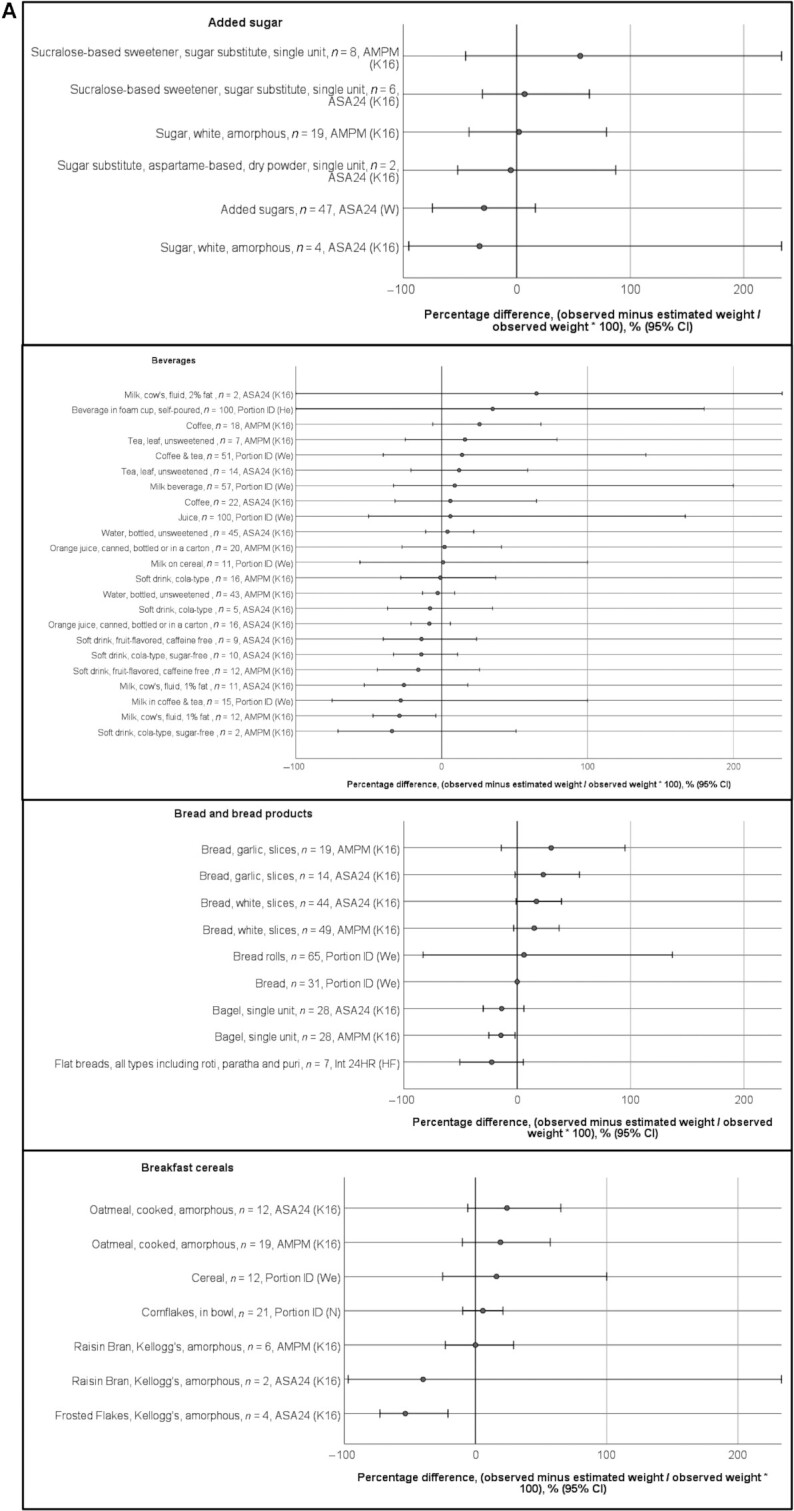
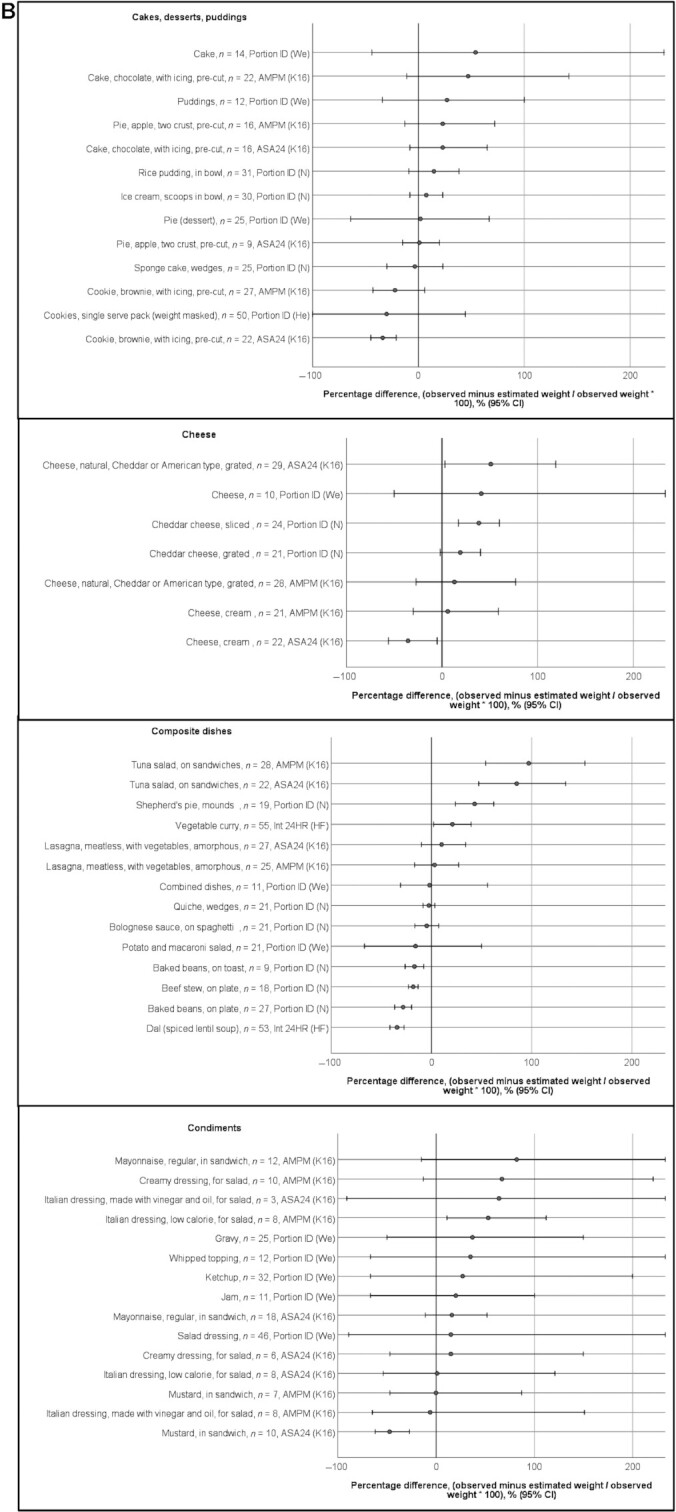
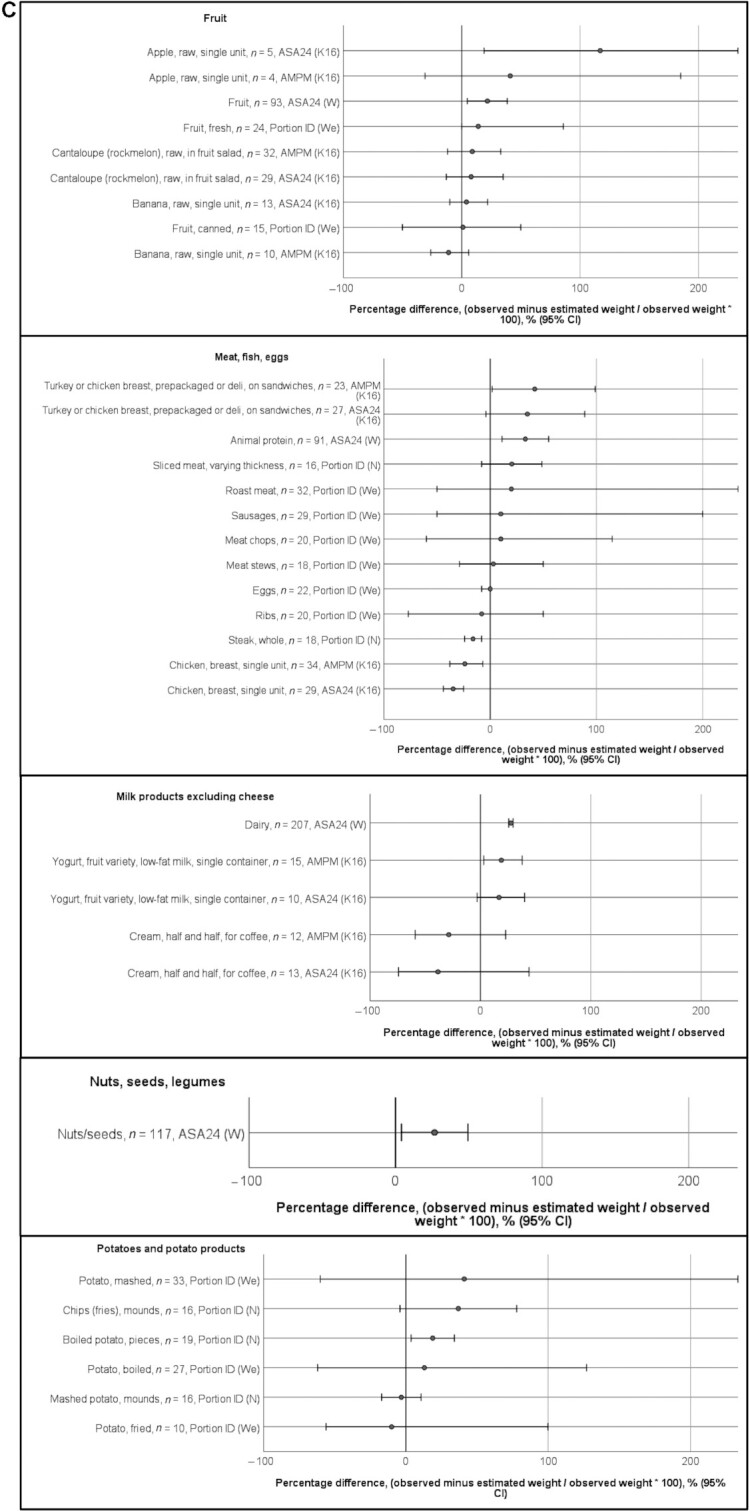

Percentage differences between estimated and observed weights of food in studies (n = 6) [Ha (25), He (40), K16 (27), N (30), We (41), and W (33)] presenting portion misestimation (observed − estimated/observed × 100) with a measure of dispersion. The x-axis shows the food/beverage name, the sample size (n), the method, and the study. CIs were not reported, but derived from P values, SEs, or SDs for the following studies: (25, 30, 33, 40, 41). Methods used: ASA24, AMPM, and Portion ID. The following groups are included: added sugar; beverages; bread and bread products; breakfast cereals(A); cakes, desserts, puddings; cheese; composite dishes; condiments (B); fruit; meat, fish, eggs; milk products (excluding cheese); potatoes and potato products (C); rice, pasta, and other grains; savory snacks; spreads; vegetables (D). ASA24, Automated Self-Administered 24-h dietary recall system; AMPM, interviewer-administered Automated Multiple-Pass Method recall; Portion ID, portion identification using photograph atlas.
Using variance decomposition techniques on the variance of the mean difference between observed and reported intake, 1 study reported the proportion of variance in energy intake error of a food group attributable to portion misestimation error (19). Portion misestimation contributed to the greatest proportion of variance in error in estimated energy intake in sweets (99%), followed by fats and oils (75%), beverages (60%), dairy (55%), meats (41%), fruit and juices (27%), grains (26%), other (23%), and vegetables (20%) (19). Although substantial variation was observed in the distribution of error contributors between food groups, portion misestimation contributed to the largest proportion of error in 6 of the 9 food groups (19).
Two studies reported the proportion of portion size estimations that were correct, over- and underestimated within each food group (34, 43). In 1 of those studies, rice tended to be overestimated whereas beverages tended to be underestimated (43). In the other study, stew, sauce, and meat were most frequently overestimated whereas leguminous food, cereal, and fish most frequently underestimated (34). Amorphous foods were overestimated and underestimated to the same extent, whereas for solid foods, there were significantly more overestimates than underestimates of portion size (P < 0·05) (34). Portion sizes were estimated correctly (within 10% of observed amounts) significantly more often in relation to clearly defined solid foods, compared with sauces and amorphous foods (P < 0.05) (34).
Two studies presented results according to the form of the food (27, 32). According to Subar et al. (32) amorphous foods (i.e., without a clearly defined shape) were difficult to estimate, whereas single unit foods were easiest to estimate. Kirkpatrick et al. (27) reported that amorphous or soft foods were overestimated by ∼20% using the interviewer-administered Automated Multiple-Pass Method recall (AMPM).
Total error measures and results
One study (19) reported the contribution of intrusion, omission, misclassification, and portion misestimation to total error within food groups using variance decomposition methods on the variance of the mean difference between observed and reported intake. Portion misestimation contributed to the largest proportion of variance in error in 6 of the 9 food groups. Overall, omissions and portion misestimations each contributed to approximately one-third of the total error (19).
Nine studies reported total measurement error by food group but did not partition the error according to omission, intrusion, misclassification, and portion misestimation (19, 29, 35–37, 45–48). Eight studies evaluated portion size estimation aids rather than food/beverage recall and portion size estimation; therefore, intrusion, omission, and misclassification errors were not applicable, as participants were asked to recall portion sizes only (26, 30–32, 34, 39–41).
Four studies presented total error as a difference in grams between estimated and observed weights (29, 37, 45, 46) (Figure 7). Most food and beverage items were reported to within 50 g of the observed amount. Items that were statistically significantly overestimated originated from 1 study (45) and included cheeses, carrot, steak, and veal. The same study also contributed the most underestimated item (rice). Other dense staples (potato, spaghetti, porridge) were among items that were significantly underestimated.
FIGURE 7.

Mean difference in grams between estimated and observed weights of food in studies reporting total measurement error (n = 4). The x-axis shows the food/beverage name, the sample size (n), the method, and the study. CIs were not reported, but derived from P values, SEs, or SDs for the following studies: (37, 46). Data from (29) are medians. Method used: Int 24HR (interviewer-administered 24-h recall method).
Eight studies reported the difference between estimated and observed weight as a percentage/ratio of observed intake (Table 7). Within food groups, there was little evidence of consistency in the direction of estimations (over compared with under). An exception was with cheese and milk products, for which all data points (n = 7) indicated overestimation, and savory snacks, which tended to be underestimated. In general, there were small sample sizes, broad variations in estimates within studies, and few statistically significant findings. The magnitude of proportional error was highest in the condiments group and nuts/seeds group, for which serving sizes are typically small.
TABLE 7.
Percentage difference between estimated and observed weights of foods/beverages in studies reporting total measurement error (n = 8)1
| Foods and beverages2 | Difference between estimated and observed weights, % | Measure of dispersion | Statistically significant difference3 | n | Self-report method | Source |
|---|---|---|---|---|---|---|
| Added sugar | ||||||
| Added sugars and sweets | 31 | — | — | 27 | Int 24HR | (48) |
| Sugar | −11 | — | — | 25 | Int 24HR and WDR | (47) |
| Alcoholic beverages | ||||||
| Beers and ciders | 12 | — | — | 25 | Int 24HR and WDR | (47) |
| Spirits | −19 | — | — | 10 | Int 24HR and WDR | (47) |
| Wines | −3 | — | — | 28 | Int 24HR and WDR | (47) |
| Beverages, nonalcoholic | ||||||
| Beverage (soft drink, lemonade, water, or tea), 228-mL glass | 26 | 95% CI: −20, 71 | <0.05 | 26 | Int 24HR | (37) |
| Beverage (soft drink, lemonade, water, or tea), 285-mL glass | 25 | 95% CI: −19, 69 | <0.05 | 21 | Int 24HR | (37) |
| Beverage (soft drink, lemonade, water, or tea), 456-mL glass | 35 | 95% CI: −27, 98 | <0.05 | 45 | Int 24HR | (37) |
| Beverage (soft drink, lemonade, water, or tea), 580-mL bottle | 2 | 95% CI: −1, 5 | NS | 99 | Int 24HR | (37) |
| Beverages | 2 | — | >0.05 | 19 | Int 24HR | (29) |
| Beverages (tea, cocoa and coffee) | 70 | — | — | 19 | Int 24HR | (48) |
| Carbonated drinks | −22 | — | — | 28 | Int 24HR and WDR | (47) |
| Fruit juices | −22 | — | — | 28 | Int 24HR and WDR | (47) |
| Lemonade, 7-oz | −11 | 95% CI: −31, 9 | NS | 10 | Int 24HR, NW | (36) |
| Lemonade, 7-oz | −14 | 95% CI: −39, 11 | NS | 10 | Int 24HR, OW | (36) |
| Lemonade, 12-oz | 8 | 95% CI: −6, 22 | NS | 10 | Int 24HR, NW | (36) |
| Lemonade, 12-oz | 7 | 95% CI: −5, 19 | NS | 10 | Int 24HR, OW | (36) |
| Milk & milk−based drinks and creams | −28 | — | — | 55 | Int 24HR and WDR | (47) |
| Squash and cordials | −7 | — | — | 18 | Int 24HR and WDR | (47) |
| Water | −22 | — | <0.001 | 300 | Int 24HR | (46) |
| Water and drinks | −21 | — | — | 58 | Int 24HR and WDR | (47) |
| Bread and bread products | ||||||
| Bread | 5 | 95% CI: −8, 21 | NS | 25 | Int 24HR | (35) |
| Bread | −2 | — | 0.050 | 26 | Int 24HR | (29) |
| Sandwiches and breads | −7 | — | — | 58 | Int 24HR and WDR | (47) |
| Breakfast cereals | −18 | — | — | 45 | Int 24HR and WDR | (47) |
| Cakes, desserts, puddings | ||||||
| Biscuits | −14 | — | — | 38 | Int 24HR and WDR | (47) |
| Cake | 60 | 95% CI: −46, 166 | NS | 15 | Int 24HR, NW | (36) |
| Cake | 5 | 95% CI: −4, 14 | NS | 15 | Int 24HR, OW | (36) |
| Cakes, pastries, buns and savories | 1 | — | — | 28 | Int 24HR and WDR | (47) |
| Ice cream | 9 | — | — | 25 | Int 24HR and WDR | (47) |
| Puddings and chilled dessert | 1 | — | — | 18 | Int 24HR and WDR | (47) |
| Sweet products | −5 | 95% CI: −27, 9 | NS | 26 | Int 24HR | (35) |
| Cheese | ||||||
| Cheeses | 5 | — | — | 46 | Int 24HR and WDR | (47) |
| Berna cheese | 49 | — | <0.05 | 39 | Int 24HR | (45) |
| White cheese | 62 | — | <0.05 | 22 | Int 24HR | (45) |
| Fresh cheese | 89 | — | <0.05 | 30 | Int 24HR | (45) |
| Milk products excluding cheese | ||||||
| Dairy | 64 | — | — | 22 | Int 24HR | (48) |
| Dairy products | 2 | 95% CI: 1, 10 | <0.05 | 29 | Int 24HR | (35) |
| Yogurts | 7 | — | — | 32 | Int 24HR and WDR | (47) |
| Composite dishes | ||||||
| Kidney bean stew | −17 | — | <0.001 | 300 | Int 24HR | (46) |
| Pizza | −12 | — | — | 12 | Int 24HR and WDR | (47) |
| Green leafy vegetable stew | −9 | — | <0.001 | 300 | Int 24HR | (46) |
| Condiments | ||||||
| Condiments | −19 | — | — | 48 | Int 24HR and WDR | (47) |
| Fats | 55 | — | — | 29 | Int 24HR | (48) |
| Herbs and spices | 13 | — | — | 48 | Int 24HR and WDR | (47) |
| Mayonnaise | 13 | 95% CI: −10, 36 | NS | 14 | Int 24HR, NW | (36) |
| Mayonnaise | 40 | 95% CI: −31, 111 | NS | 10 | Int 24HR, OW | (36) |
| Oils | −39 | — | — | 47 | Int 24HR and WDR | (47) |
| Salad dressing | 17 | 95% CI: −13, 47 | NS | 28 | Int 24HR, NW | (36) |
| Salad dressing | 33 | 95% CI: −26, 92 | NS | 36 | Int 24HR, OW | (36) |
| Salsa, 10-oz jar | 27 | 95% CI: −21, 76 | <0.05 | 46 | Int 24HR | (37) |
| Salt | −71 | — | — | 33 | Int 24HR and WDR | (47) |
| Sauces | −56 | — | — | 36 | Int 24HR and WDR | (47) |
| Confectionery | ||||||
| Confectionery (nonchocolate) | −10 | — | — | 4 | Int 24HR and WDR | (47) |
| Confectionery (chocolate) | −3 | — | — | 37 | Int 24HR and WDR | (47) |
| Fruit | ||||||
| Bananas | 6 | — | NS | 300 | Int 24HR | (46) |
| Fruit | −25 | — | — | 55 | Int 24HR and WDR | (47) |
| Fruits | 4 | 95% CI: −17, 26 | NS | 21 | Int 24HR | (35) |
| Fruits | 75 | — | — | 19 | Int 24HR | (48) |
| Meat, fish, eggs | ||||||
| Animal products | −10 | 95% CI: −22, 1 | NS | 30 | Int 24HR | (35) |
| Chopped veal | 20 | — | <0.05 | 19 | Int 24HR | (45) |
| Egg | −7 | — | 0.03 | 15 | Int 24HR | (29) |
| Eggs | −2 | — | — | 33 | Int 24HR and WDR | (47) |
| Fish | −42 | — | <0.05 | 16 | Int 24HR | (45) |
| Fish | 8 | — | — | 39 | Int 24HR and WDR | (47) |
| Meat | −15 | — | — | 54 | Int 24HR and WDR | (47) |
| Meat | −5 | — | >0.05 | 48 | Int 24HR | (29) |
| Meats | 84 | — | — | 4 | Int 24HR | (48) |
| Mixed ham and salami | −3 | — | >0.05 | 33 | Int 24HR | (45) |
| Roast beef | 9 | — | >0.05 | 19 | Int 24HR | (45) |
| Sliced turkey, 2-oz | 30 | 95% CI: −23, 83 | NS | 18 | Int 24HR, NW | (36) |
| Sliced turkey, 2-oz | 50 | 95% CI: −39, 139 | NS | 17 | Int 24HR, OW | (36) |
| Sliced turkey, 4-oz | 0 | 95% CI: 0, 0 | NS | 15 | Int 24HR, NW | (36) |
| Sliced turkey, 4-oz | −18 | 95% CI: −42, 6 | <0.01 | 17 | Int 24HR, OW | (36) |
| Steak | 46 | — | <0.05 | 44 | Int 24HR | (45) |
| Nuts, seeds, legumes | ||||||
| Groundnuts | −25 | — | <0.001 | 300 | Int 24HR | (46) |
| Legumes/nuts | 113 | — | — | 35 | Int 24HR | (48) |
| Mixed nuts, 9-oz bowl | 39 | 95% CI: −30, 107 | <0.05 | 44 | Int 24HR | (37) |
| Nuts and seeds | 180 | — | — | 11 | Int 24HR and WDR | (47) |
| Rice, pasta, and other grains | ||||||
| Flours, grains, and starches | −58 | — | — | 12 | Int 24HR and WDR | (47) |
| Noodles | −5 | — | >0.05 | 43 | Int 24HR | (29) |
| Nsima (cornmeal porridge) | −12 | — | <0.001 | 300 | Int 24HR | (46) |
| Pasta | 19 | 95% CI: 11, 54 | <0.05 | 19 | Int 24HR | (35) |
| Pasta | −12 | — | — | 35 | Int 24HR and WDR | (47) |
| Pasta | −3 | — | >0.05 | 18 | Int 24HR | (45) |
| Rice | −50 | — | <0.05 | 23 | Int 24HR | (45) |
| Rice | 4 | — | — | 27 | Int 24HR and WDR | (47) |
| Rice | −7 | — | <0.001 | 43 | Int 24HR | (29) |
| Spaghetti | −24 | — | <0.05 | 37 | Int 24HR | (45) |
| Starchy foods | 93 | — | — | 41 | Int 24HR | (48) |
| Potatoes and tubers | ||||||
| Potatoes | 2 | 95% CI: −17, 21 | NS | 7 | Int 24HR | (35) |
| Potatoes | −18 | — | <0.05 | 20 | Int 24HR | (45) |
| Potatoes | −6 | — | — | 47 | Int 24HR and WDR | (47) |
| Potatoes | −6 | — | 0.032 | 80 | Int 24HR | (29) |
| Cassava | −2 | — | >0.05 | 19 | Int 24HR | (29) |
| Savory snacks | ||||||
| Flavored tortilla chips, 9-oz bag | −11 | 95% CI: −31, 9 | NS | 24 | Int 24HR | (37) |
| Flavored tortilla chips, 64-oz bowl | 26 | 95% CI: −20, 73 | NS | 24 | Int 24HR | (37) |
| Popcorn, 6-oz bag | 1 | 95% CI: −1, 2 | NS | 25 | Int 24HR | (37) |
| Popcorn, 16-oz bowl | −20 | 95% CI: −55, 15 | <0.05 | 24 | Int 24HR | (37) |
| Popcorn, 64-oz bowl | −37 | 95% CI: −102, 28 | <0.05 | 24 | Int 24HR | (37) |
| Potato chips and potato products | −12 | — | — | 28 | Int 24HR and WDR | (47) |
| Potato chips, 32-oz bowl | −7 | 95% CI: −19, 5 | NS | 27 | Int 24HR | (37) |
| Savory snacks | −10 | — | — | 43 | Int 24HR and WDR | (47) |
| Tortilla chips, 16-oz bowl | −11 | 95% CI: −31, 9 | <0.05 | 25 | Int 24HR | (37) |
| Tortilla chips, 32-oz bowl | −1 | 95% CI: −2, 1 | NS | 25 | Int 24HR | (37) |
| Soup | ||||||
| Minestrone | 6 | — | >0.05 | 27 | Int 24HR | (45) |
| Soup | −21 | 95% CI: −42, 0 | <0.001 | 27 | Int 24HR, NW | (36) |
| Soup | −2 | 95% CI: −6, 2 | NS | 28 | Int 24HR, OW | (36) |
| Soups | 10 | — | — | 29 | Int 24HR and WDR | (47) |
| Spreads | ||||||
| Syrups and preserves | 9 | — | — | 41 | Int 24HR and WDR | (47) |
| Spreading fats | 18 | — | — | 54 | Int 24HR and WDR | (47) |
| Vegetables | ||||||
| Beans, lentils, peas (pulses) | −12 | — | — | 32 | Int 24HR and WDR | (47) |
| Carrots | 30 | — | <0.05 | 23 | Int 24HR | (45) |
| Green salad | −43 | — | <0.05 | 19 | Int 24HR | (45) |
| Leafy vegetables | 9 | — | >0.05 | 17 | Int 24HR | (29) |
| Mixed salad | −1 | — | >0.05 | 19 | Int 24HR | (45) |
| Spinach | 3 | — | >0.05 | 19 | Int 24HR | (45) |
| Tossed salad, 8 oz | −10 | 95% CI: −28, 8 | NS | 25 | Int 24HR, NW | (36) |
| Tossed salad, 8 oz | −5 | 95% CI: −14, 4 | NS | 17 | Int 24HR, OW | (36) |
| Tossed salad, 12 oz | −21 | 95% CI: −58, 16 | NS | 11 | Int 24HR, NW | (36) |
| Tossed salad, 12 oz | −3 | 95% CI: −8, 2 | NS | 23 | Int 24HR, OW | (36) |
| Vegetables | 4 | 95% CI: −7, 16 | NS | 28 | Int 24HR | (35) |
| Vegetables | 73 | — | — | 38 | Int 24HR | (48) |
| Vegetables | −5 | — | 0.039 | 198 | Int 24HR | (29) |
| Vegetables and vegetable dishes | −8 | — | — | 57 | Int 24HR and WDR | (47) |
NS, not statistically significant; Int 24HR, interviewer-administered 24-h dietary recall interview; WDR, weighed diet record, Int24 and WDR, average of reports from recalls and weighed diet record; OW, overweight; NW, normal weight
Individual foods and beverages are worded as reported in articles. Food groupings were devised by the authors of the systematic review.
Based on P values from paired tests, or CIs for gram difference.
Demographic correlates of error
Twelve studies assessed demographic correlates of measurement error (14, 15, 26, 30, 31, 34, 36, 38, 41, 44–46), of which 9 studies assessed the association of sex/gender with error. Using a printed photograph atlas with 8 images of each food, Nelson et al. (30) found that men tended to overestimate portion sizes more than women, and that older men (>65 y) tended to overestimate portion sizes more than younger men. These analyses were controlled for portion sizes, as smaller portion sizes tend to be overestimated, and larger portion sizes tend to be underestimated (30). Kirkpatrick et al. (14) reported some gender differences using the Automated Multiple Pass Method (AMPM). Men but not women underestimated vegetables (by −0.47 cups; 95% CI: −0.84, −0.10) and sugars added to foods/beverages (by −.69 teaspoons; 95% CI: −8.58, −0.81), whereas women but not men overestimated milk (by 0.22 cups; 95% CI: 0.03, 0.41) (14). Wein et al. (41) found no difference in reporting accuracy between men and women for 36 foods, but found that women overestimated intake of boiled potatoes to a greater extent and overestimated coffee and tea to a lesser extent than men. In contrast, 6 studies (15, 31, 34, 38, 44, 45) reported no association between gender/sex and food/beverage measurement error.
Some studies also assessed the association of age, across a broad range (20–71 y; 35–64 y; 18–65 y) (15, 38, 45), and weight status (15, 30, 36), but found no association with measurement error. Using digital images and actual food as portion size estimation aids, Flax et al. (46) found no difference between groups according to education level (≤4 y or ≥5 y) or urban/rural residence for proportions of portion size estimations within 20% of the observed weight. In contrast, Huybregts et al. (26) reported lower likelihood of selecting the correct portion size from a printed photographic atlas displaying 4 images of each food among participants who had not attended school compared with those who had attended school (OR 0.52; 95% CI: 0.38, 0.72), controlled for portion sizes consumed. In the same study, pregnancy status and village of residence were not associated with selecting the correct portion size (26). Godwin et al. reported that ethnicity (African American or white) was not associated with measurement error (38).
Discussion
In the current systematic review, more variation in error existed within food groups and within individual studies than between food groups. Although there was inconsistency in measures across studies, some patterns in tendency for omission or substantial portion misestimation were identified according to food group.
Data were synthesized from 29 studies, with most studies using a 24-h dietary recall as the self-report method, and controlled feeding as the comparator method. Broad variation existed in study duration, ranging from 1 meal/snack to 3 d, and in the characteristics of the self-report method and portion size estimation aids. Furthermore, each type of self-report method and portion size estimation aid likely contributes to measurement error in a unique way, and the interaction between each method and any given population will likely vary. As such, the diversity of self-report methods, portion size estimation aids, comparator methods, and study populations introduces biases that cannot be accounted for in this review. Characterizing contributors to measurement error in consistent ways across studies could enable synthesis to inform instrument development and improvement. Furthermore, few studies partitioned error according to all 4 contributors simultaneously (omissions, intrusions, misclassifications, and portion misestimations); thus, the relative importance of each contributor could not be clearly ascertained. Similarly, the potential counteracting or compounding effects, such as underestimation caused by omission being compensated for by portion size overestimation, could not be clearly ascertained.
Average portion misestimation and overall group-level omissions were the most commonly reported outcome measures, although with omissions, there was little consistency between studies in the unit used to report this outcome measure. In general, the studies in this review did not report how much variation existed between participants in relation to omissions of items, and whether any trends in portion misestimation existed among individuals who tended to omit items. Most studies focused on portion misestimation or total measurement error. Despite the lack of cohesive evaluation of all error contributors simultaneously, some findings emerged that may be useful in the development of dietary assessment instruments and methods.
Beverages appeared to be less frequently omitted overall than most foods. Beverages such as carbonated drinks have been considered a commonly misestimated item (49). As such, 24-h dietary recall protocols are designed to contain probes for forgotten beverages (50), which may have contributed to the lower omission among beverages observed in this review. Despite lower frequency of omission, beverages appear to be one of the most difficult items to quantify accurately, possibly because of the variation in sizes and shapes of containers they are served in.
Among some key food groups, the way foods are served appears to be a more important driver of measurement error than the food itself. For example, meats had a tendency for over- or underestimation depending on the form (e.g., single unit, slices) in which they were served. Some vegetable and condiment items were omitted more than half of the time in some studies (15, 28, 47). The high omission rates of some vegetables seemed to be related to their inclusion as part of a composite dish such as a salad or sandwich, rather than as a side of a main meal. For example, Kirkpatrick et al. reported that vegetables, cheese, and condiments in salads and sandwiches were the most frequently omitted items (14). Conceivably, participants may not have noticed such items within mixed dishes, self-report dietary assessment instruments may not have asked for details of individual ingredients, or participants may not have been aware of the need to report them. This combination of factors represents a challenge in the future development of dietary assessment instruments, particularly in populations frequently consuming complex mixed dishes.
There was little consistency between studies on the magnitude of portion misestimation errors within groups of specific foods and beverages. For example, the between-study variation in reporting amounts of some foods and beverages [such as rice pilaf: +47 g; 95% CI: 16, 79 g (27) compared with rice: −28 g; 95% CI: −2, −54 g (26)] was greater than the variation between some food groups. Large between-person variation, indicated by wide CIs, is often due to the high SEs seen with small sample sizes. However, we did not observe a consistent pattern whereby food/beverage items examined with larger sample sizes had narrower CIs. In fact, in some cases, the width of the CI appeared to be related to the food rather than the sample size. For example, with rice, pasta, and other grains, the CI width in each study was similar despite sample sizes ranging from 21 to 132. This finding suggests that portion size estimation accuracy between individuals for some foods is highly variable, and not mitigated by larger sample sizes. In support of this, a recent study reported that almost 90% variability in portion size estimation accuracy was unexplained or random, and not accounted for by food group or individual (51).
In the comparison of omission rates across food groups in this review, there was no indication that cakes, desserts, and puddings; savory snacks; or confectionery were more commonly omitted than healthier items such as fruits and vegetables. This finding suggests that items omitted from 24-h dietary recalls are not those perceived to be unhealthy or socially undesirable to report. In contrast, several studies have suggested that participants selectively omit high-fat or “unhealthy” foods (13, 52, 53). Taken together with the findings on beverages and vegetables, the evidence in this review suggests that omissions from self-reported dietary data are items that are less visible to participants, as opposed to items that are perceived as being unhealthy. The implication for developers of dietary assessment instruments is that items which are consumed unnoticed cannot be retrieved from memory and are outside the scope of what a participant can detail while reporting dietary intake.
Evidence on demographic correlates of measurement error were sought in this review, but few were identified. Six of the 9 studies in this review examining gender/sex found no association with measurement error, whereas 2 found evidence of poorer portion size estimation among men (14, 30). Similarly, there was inconsistency among studies that asked participants to estimate the quantities of unconsumed food, with some reports of women being better at estimating food portions than men (54–56). Why gender would be associated with portion size estimation accuracy is unclear, although a suggested reason is differences in time spent on food preparation and cooking (55). Further research is needed on the cause of this variation and how such factors can be accounted for in the design of dietary assessment instruments.
Overall, a low risk of bias was identified among included studies, with small sample sizes and lack of reporting on investigator blinding the most common sources of bias. Controlled feeding studies typically have small sample sizes given the cost and burden of study procedures. As most feeding studies in this review allowed ad libitum intake, not every participant consumed every food item, so sample sizes for individual food items were often lower than the total study sample. However, there seemed to be a trend for more recent studies to use larger samples sizes, >300 participants (28, 34, 46). The other potential source of bias among included studies was that investigators conducting and analyzing 24-h dietary recalls may have been aware what items and amounts participants had actually consumed. In most studies, this part of the study design was not explained, so it could have been accounted for but not reported, and it is recommended that in future studies the authors explicitly state this component of the study design. The essential element of a study design that would best assess the contributions to systematic error is a controlled feeding design, in which the true weight of the prepared food/beverage is known, as this approach is the least biased, and this design was utilized by most studies included in this review. Observational studies in which the food and beverage weight is estimated but items are not weighed are likely to have errors, particularly in portion size estimation by the trained observer. It is our recommendation that future studies use a controlled feeding study design to minimize errors in portion size estimation and allow a more comprehensive data interrogation.
Strengths and Limitations
To our knowledge, this is the first systematic review of contributors to error in self-reported food and beverage intake. The review included a comprehensive search of several large databases, and despite narrow inclusion criteria, included 29 studies and 2964 participants from 15 countries, covering all continents. We did not include studies conducted in children, as such data would warrant separate consideration given the specific nuances involved in collecting dietary intake data from this population.
Most of the included studies did not explicitly aim to compare error contributors across food groups but were methodological studies that aimed to evaluate 24-h dietary recall instruments or portion size estimation aids. As such, studies did not usually conduct analyses to a level of detail that enabled cross–food group comparisons to be made, which was the level sought in this review. Controlled feeding studies generate rich information with multiple uses, which can be approached from multiple angles to answer an array of research questions. This review illustrates how such data could be further utilized to understand mechanisms of measurement error arising from short-term dietary assessment instruments, and to tailor these instruments appropriately to the targeted populations.
Some limitations require highlighting. Inconsistencies in food grouping across studies and how researchers group or categorize food globally may have influenced the results in this review. The assessment of mixed dishes is another area of potential inconsistency, especially in community studies with self-selected foods, and observation studies. With mixed dishes, sandwiches, and salads, researcher judgement is required in assigning the contributor to error, and more than one may occur simultaneously, for example misclassification as well as portion misestimation. In all included studies, participants may have been more aware of their dietary intake than in nonexperimental conditions, and thus it is possible that reported intake is more accurate than would be expected in other contexts. We focused on errors during the process of reporting food and beverage intake. However, there are other potential sources of error, such as data entry error, challenges in finding matching foods in self-administered 24-h recalls, and food composition database errors, as well as biases in the comparator data. These less-addressed error sources have implications for the interpretation of results in this review, as it is unlikely that these additional sources of error are present in equal magnitude among all included studies.
Conclusions and Recommendations
In conclusion, some evidence exists of patterns in contributors to error across food groups, but identification of patterns was limited by inconsistency in measures across studies. Portion misestimation made a large contribution to dietary intake measurement error, however, more variation in error existed within food groups and within individual studies, than between food groups. Better understanding of contributors to systematic error (omissions, intrusions, misclassifications, and portion misestimations), which will lead to taking appropriate actions to mitigate them, may be derived from the following:
Well-designed studies using controlled feeding methods, the components of which have been comprehensively described elsewhere (3), that are powered to examine all contributors of error across food groups. Controlled feeding studies are the least biased method of measuring true intake since food/beverage weights are measured rather than estimated. Future studies should report averages with a measure of variation rather than counts (which was often the case with omissions), in order that between-person variation in systematic error can be better understood.
Partitioning of measurement error within groups of foods and beverages according to all 4 contributors (omissions, intrusions, misclassifications, and portion misestimations). Error due to intrusion and misclassification of types of foods/beverages was examined in only 3 included studies, indicating these are severely understudied issues.
Consideration and reporting of all details that influence the assessment of measurement errors, such as the physical form (e.g., diced, amorphous), the serving container (size, shape, packaging) from which the foods and beverages are consumed, participant familiarity with the food, the detail provided on the menu, the use of standardized recipes, how many other foods are served simultaneously, and the impact of these variables on the cognitive load of reporting intake are recommended.
Supplementary Material
Acknowledgements
The authors’ responsibilities were as follows—CW, DAK: conceived the study; CW, CRG: screened studies and extracted data; CW, CRG: conducted bias assessments; MER: arbitrated assessments; SSD: provided statistical advice; CW: drafted and edited the manuscript; DAK, CJB, CEC, MER, SIK, JDH: critically reviewed and edited the manuscript; and all authors: read and approved the final manuscript.
Notes
CW and JDH are supported by an Australian Research Training Programme scholarship.
Author disclosures: The authors report no conflicts of interest.
Supplemental Table 1 is available from the “Supplementary data" link in the online posting of the article and from the same link in the online table of contents at https://academic.oup.com/advances/.
Abbreviations used: ASA24, Automated Self-Administered 24-h dietary recall system; AMPM, Automated Multiple-Pass Method; Int 24HR, interviewer-administered 24-h recall; R24W, self-administered web-based 24-h dietary recall
Contributor Information
Clare Whitton, Curtin School of Population Health, Curtin University, Perth, WA, Australia; Curtin Health Innovation Research Institute, Curtin University, Perth, WA, Australia.
César Ramos-García, Curtin School of Population Health, Curtin University, Perth, WA, Australia; Division of Health Sciences, Tonalá University Center, University of Guadalajara, Guadalajara, Mexico.
Sharon I Kirkpatrick, School of Public Health Sciences, University of Waterloo, Waterloo, ON, Canada.
Janelle D Healy, Curtin School of Population Health, Curtin University, Perth, WA, Australia; Curtin Health Innovation Research Institute, Curtin University, Perth, WA, Australia.
Satvinder S Dhaliwal, Curtin Health Innovation Research Institute, Curtin University, Perth, WA, Australia; Duke-NUS Medical School, National University of Singapore, Singapore; Institute for Research in Molecular Medicine (INFORMM), Universiti Sains Malaysia, Pulau Pinang, Malaysia; Singapore University of Social Sciences, Singapore.
Carol J Boushey, Epidemiology Program, University of Hawaii Cancer Center, Honolulu, HI, USA.
Clare E Collins, School of Health Sciences, College of Health, Medicine and Wellbeing, University of Newcastle, Callaghan, NSW, Australia; Food and Nutrition Research Program, Hunter Medical Research Institute, New Lambton, NSW, Australia.
Megan E Rollo, Curtin School of Population Health, Curtin University, Perth, WA, Australia.
Deborah A Kerr, Curtin School of Population Health, Curtin University, Perth, WA, Australia; Curtin Health Innovation Research Institute, Curtin University, Perth, WA, Australia.
References
- 1. Subar AF, Freedman LS, Tooze JA, Kirkpatrick SI, Boushey C, Neuhouser MLet al. Addressing current criticism regarding the value of self-report dietary data. J Nutr. 2015;145:(12):2639–45. [DOI] [PMC free article] [PubMed] [Google Scholar]
- 2. Souverein OW, Dekkers AL, Geelen A, Haubrock J, de Vries JH, Ocké MCet al. Comparing four methods to estimate usual intake distributions. Eur J Clin Nutr. 2011;65:S92–101. [DOI] [PubMed] [Google Scholar]
- 3. Kirkpatrick SI, Baranowski T, Subar AF, Tooze JA, Frongillo EA.. Best practices for conducting and interpreting studies to validate self-report dietary assessment methods. J Acad Nutr Diet. 2019;119:1801–16. [DOI] [PubMed] [Google Scholar]
- 4. Black A. Critical evaluation of energy intake using the Goldberg cut-off for energy intake: basal metabolic rate. A practical guide to its calculation, use and limitations. Int J Obes. 2000;24:1119–30. [DOI] [PubMed] [Google Scholar]
- 5. Goldberg GR, Black AE, Jebb SA, Cole TJ, Murgatroyd PR, Coward WAet al. Critical evaluation of energy intake data using fundamental principles of energy physiology: 1. Derivation of cut-off limits to identify under-recording. Eur J Clin Nutr. 1991;45:569–81. [PubMed] [Google Scholar]
- 6. Tooze JA, Krebs-Smith SM, Troiano RP, Subar AF.. The accuracy of the Goldberg method for classifying misreporters of energy intake on a food frequency questionnaire and 24-h recalls: comparison with doubly labeled water. Eur J Clin Nutr. Nature Publishing Group; 2012;66:569–76.. [DOI] [PMC free article] [PubMed] [Google Scholar]
- 7. DeLany J. Energy requirement methodology. In: Coultson A, Boushey C, Ferruzzi M, editors. Nutrition in the prevention and treatment of disease. 4th ed.San Diego, CA: Elsevier Press; 2017.p. 85–102. [Google Scholar]
- 8. Westerterp KR. Doubly labelled water assessment of energy expenditure: principle, practice, and promise. Eur J Appl Physiol. 2017;117:1277–85. [DOI] [PMC free article] [PubMed] [Google Scholar]
- 9. Burrows TL, Ho YY, Rollo ME, Collins CE.. Validity of dietary assessment methods when compared to the method of doubly labeled water: a systematic review in adults. Front Endocrinol (Lausanne). 2019;10:850. [DOI] [PMC free article] [PubMed] [Google Scholar]
- 10. Freedman LS, Commins JM, Moler JE, Willett W, Tinker LF, Subar AFet al. Pooled results from 5 validation studies of dietary self-report instruments using recovery biomarkers for potassium and sodium intake. Am J Epidemiol. 2015;181:473–87. [DOI] [PMC free article] [PubMed] [Google Scholar]
- 11. Freedman LS, Commins JM, Moler JE, Arab L, Baer DJ, Kipnis Vet al. Pooled results from 5 validation studies of dietary self-report instruments using recovery biomarkers for energy and protein intake. Am J Epidemiol. 2014;180:172–88. [DOI] [PMC free article] [PubMed] [Google Scholar]
- 12. Gemming L, Ni Mhurchu C. Dietary under-reporting: what foods and which meals are typically under-reported?. Eur J Clin Nutr. 2016;70:640–1. [DOI] [PubMed] [Google Scholar]
- 13. Poppitt S, Swann D, Black A, Prentice A.. Assessment of selective under-reporting of food intake by both obese and non-obese women in a metabolic facility. Int J Obes. 1998;22:303–11. [DOI] [PubMed] [Google Scholar]
- 14. Kirkpatrick SI, Subar AF, Douglass D, Zimmerman TP, Thompson FE, Kahle LLet al. Performance of the automated self-administered 24-hour recall relative to a measure of true intakes and to an interviewer-administered 24-h recall. Am J Clin Nutr. 2014;100:233–40. [DOI] [PMC free article] [PubMed] [Google Scholar]
- 15. Lafrenière J, Lamarche B, Laramée C, Robitaille J, Lemieux S.. Validation of a newly automated web-based 24-hour dietary recall using fully controlled feeding studies. BMC Nutr. 2017;3:34. [DOI] [PMC free article] [PubMed] [Google Scholar]
- 16. Baranowski T, Domel SB.. A cognitive model of children's reporting of food intake. Am J Clin Nutr. 1994;59:212S–7S. [DOI] [PubMed] [Google Scholar]
- 17. Hébert JR. Social desirability trait: biaser or driver of self-reported dietary intake?. J Acad Nutr Diet. 2016;116:1895–8. [DOI] [PubMed] [Google Scholar]
- 18. Nelson M, Atkinson M, Darbyshire S.. Food photography I: the perception of food portion size from photographs. Br J Nutr. 1994;72:649–63. [DOI] [PubMed] [Google Scholar]
- 19. Rumpler WV, Kramer M, Rhodes DG, Moshfegh AJ, Paul DR.. Identifying sources of reporting error using measured food intake. Eur J Clin Nutr. 2008;62:544–52. [DOI] [PubMed] [Google Scholar]
- 20. Page MJ, McKenzie JE, Bossuyt PM, Boutron I, Hoffmann TC, Mulrow CDet al. The PRISMA 2020 statement: an updated guideline for reporting systematic reviews. BMJ. 2021;372:n71. [DOI] [PMC free article] [PubMed] [Google Scholar]
- 21. Campbell M, McKenzie JE, Sowden A, Katikireddi SV, Brennan SE, Ellis Set al. Synthesis without meta-analysis (SWiM) in systematic reviews: reporting guideline. BMJ. 2020;368:l6890. [DOI] [PMC free article] [PubMed] [Google Scholar]
- 22. Veritas Health Innovation. Covidence systematic review software [Internet]. Melbourne, Australia. Available from: http://www.covidence.org/(accessed 2022). [Google Scholar]
- 23. Kmet L, Cook L, Lee R.. Standard quality assessment criteria for evaluating primary research papers from a variety of fields. [Internet]. Edmonton, Alberta; 2004. Available from: https://era.library.ualberta.ca/items/48b9b989-c221-4df6-9e35-af782082280e(accessed 2022). [Google Scholar]
- 24. Altman DG, Bland JM.. How to obtain the confidence interval from a P value. BMJ. 2011;343:d2090. [DOI] [PubMed] [Google Scholar]
- 25. Harris-Fry H, Paudel P, Karn M, Mishra N, Thakur J, Paudel Vet al. Development and validation of a photographic food atlas for portion size assessment in the southern plains of Nepal. Public Health Nutr. 2016;19:2495–507. [DOI] [PMC free article] [PubMed] [Google Scholar]
- 26. Huybregts L, Roberfroid D, Lachat C, Van Camp J, Kolsteren P.. Validity of photographs for food portion estimation in a rural West African setting. Public Health Nutr. 2008;11:581–7. [DOI] [PubMed] [Google Scholar]
- 27. Kirkpatrick SI, Potischman N, Dodd KW, Douglass D, Zimmerman TP, Kahle LLet al. The use of digital images in 24-hour recalls may lead to less misestimation of portion size compared with traditional interviewer-administered recalls. J Nutr. 2016;146:2567–73. [DOI] [PMC free article] [PubMed] [Google Scholar]
- 28. Kirkpatrick SI, Guenther PM, Douglass D, Zimmerman T, Kahle LL, Atoloye Aet al. The provision of assistance does not substantially impact the accuracy of 24-hour dietary recalls completed using the automated self-administered 24-h dietary assessment tool among women with low incomes. J Nutr. 2019;149:114–22. [DOI] [PMC free article] [PubMed] [Google Scholar]
- 29. Lazarte CE, Encinas ME, Alegre C, Granfeldt Y.. Validation of digital photographs, as a tool in 24-h recall, for the improvement of dietary assessment among rural populations in developing countries. Nutr J. 2012;11:61. [DOI] [PMC free article] [PubMed] [Google Scholar]
- 30. Nelson M, Atkinson M, Darbyshire S.. Food photography II: use of food photographs for estimating portion size and the nutrient content of meals. Br J Nutr. 1996;76:31–49. [DOI] [PubMed] [Google Scholar]
- 31. Robson PJ, Livingstone MBE.. An evaluation of food photographs as a tool for quantifying food and nutrient intakes. Public Health Nutr. 2000;3:183–92. [DOI] [PubMed] [Google Scholar]
- 32. Subar AF, Crafts J, Zimmerman TP, Wilson M, Mittl B, Islam NGet al. Assessment of the accuracy of portion size reports using computer-based food photographs aids in the development of an automated self-administered 24-hour recall. J Am Diet Assoc. 2010;110:55–64. [DOI] [PMC free article] [PubMed] [Google Scholar]
- 33. Widaman A, Keim N, Burnett D, Miller B, Witbracht M, Widaman Ket al. A potential tool for clinicians; evaluating a computer-led dietary assessment method in overweight and obese women during weight loss. Nutrients. 2017;9:218. [DOI] [PMC free article] [PubMed] [Google Scholar]
- 34. Amougou N, Cohen E, Mbala ML, Grosdidier B, Bernard JY, Saïd-Mohamed Ret al. Development and validation of two food portion photograph books to assess dietary intake among adults and children in Central Africa. Br J Nutr. 2016;115:895–902. [DOI] [PubMed] [Google Scholar]
- 35. Bouchoucha M, Akrout M, Bellali H, Bouchoucha R, Tarhouni F, Mansour ABet al. Development and validation of a food photography manual, as a tool for estimation of food portion size in epidemiological dietary surveys in Tunisia. Libyan J Med. 2016;11:32676. [DOI] [PMC free article] [PubMed] [Google Scholar]
- 36. Blake AJ, Guthrie HA, Smiciklas-Wright H.. Accuracy of food portion estimation by overweight and normal-weight subjects. J Am Diet Assoc. 1989;89:962–4. [PubMed] [Google Scholar]
- 37. Chambers E, McGuire B, Godwin S, McDowell M, Vecchio F.. Quantifying portion sizes for selected snack foods and beverages in 24-hour dietary recalls. Nutr Res. 2000;20:315–26. [Google Scholar]
- 38. Godwin SL, Chambers E, Cleveland L.. Accuracy of reporting dietary intake using various portion-size aids in-person and via telephone. J Am Diet Assoc. 2004;104:585–94. [DOI] [PubMed] [Google Scholar]
- 39. Harnack L, Steffen L, Arnett DK, Gao S, Luepker RV. Accuracy of estimation of large food portions. J Am Diet Assoc. 2004;104:804–6. [DOI] [PubMed] [Google Scholar]
- 40. Hernández T, Wilder L, Kuehn D, Rubotzky K, Moser-Veillon P, Godwin Set al. Portion size estimation and expectation of accuracy. J Food Compos Anal. 2006;19:S14–21. [Google Scholar]
- 41. Wein EE, Sabry JH, Evers FT.. Recalled estimates of food portion size. J Can Diet Assoc. 1990;51:400–3. [Google Scholar]
- 42. Chan V, Davies A, Wellard-Cole L, Lu S, Ng H, Tsoi Let al. Using wearable cameras to assess foods and beverages omitted in 24 hour dietary recalls and a text entry food record app. Nutrients. 2021;13:1806. [DOI] [PMC free article] [PubMed] [Google Scholar]
- 43. Kim S, Lee B, Park CY.. A short education session increases the accuracy of estimated food records in young Korean women during a controlled-feeding study. Nutr Res Pract. 2021;15:613. [DOI] [PMC free article] [PubMed] [Google Scholar]
- 44. De Keyzer W, Huybrechts I, De Maeyer M, Ocké M, Slimani N, van ’t Veer Pet al. Food photographs in nutritional surveillance: errors in portion size estimation using drawings of bread and photographs of margarine and beverages consumption. Br J Nutr. 2011;105:1073–83. [DOI] [PubMed] [Google Scholar]
- 45. Faggiano F, Vineis P, Cravanzola D, Pisani P, Xompero G, Riboli Eet al. Validation of a method for the estimation of food portion size. Epidemiology. 1992;3:379–82. [DOI] [PubMed] [Google Scholar]
- 46. Flax VL, Thakwalakwa C, Schnefke CH, Stobaugh H, Phuka JC, Coates Jet al. Validation of a digitally displayed photographic food portion-size estimation aid among women in urban and rural Malawi. Public Health Nutr. 2019;22:3140–50. [DOI] [PMC free article] [PubMed] [Google Scholar]
- 47. Garden L, Clark H, Whybrow S, Stubbs RJ.. Is misreporting of dietary intake by weighed food records or 24-hour recalls food specific?. Eur J Clin Nutr. 2018;72:1026–34. [DOI] [PubMed] [Google Scholar]
- 48. Gewa CA, Murphy SP, Neumann CG.. A comparison of weighed and recalled intakes for schoolchildren and mothers in rural Kenya. Public Health Nutr. 2009;12:1197–204. [DOI] [PubMed] [Google Scholar]
- 49. Krebs-Smith S, Graubard B, Kahle L, Subar A, Cleveland L, Ballard-Barbash R. Low energy reporters vs others: a comparison of reported food intakes. Eur J Clin Nutr. 2000;54:281–7. [DOI] [PubMed] [Google Scholar]
- 50. Thompson FE, Subar AF.. Dietary assessment methodology. In: Coultson A, Boushey C, Ferruzzi M, eds. Nutrition in the prevention and treatment of disease. 4th ed.San Diego, CA: Elsevier Press; 2017. p. 5–46. [Google Scholar]
- 51. Kirkpatrick SI, Guenther PM, Durward C, Douglass D, Zimmerman TP, Kahle LLet al. The accuracy of portion size reporting on self-administered online 24-hour dietary recalls among women with low incomes. J Acad Nutr Diet. 2022. doi: 10.1016/j.jand.2022.03.018. [DOI] [PubMed] [Google Scholar]
- 52. Lafay L, Mennen L, Basdevant A, Charles M, Borys J, Eschwège Eet al. Does energy intake underreporting involve all kinds of food or only specific food items? Results from the Fleurbaix Laventie Ville Santé (FLVS) study. Int J Obes. 2000;24:1500–6. [DOI] [PubMed] [Google Scholar]
- 53. Goris AHC, Westerterp-Plantenga MS, Westerterp KR.. Undereating and underrecording of habitual food intake in obese men: selective underreporting of fat intake. Am J Clin Nutr. 2000;71:130–4. [DOI] [PubMed] [Google Scholar]
- 54. Almiron-Roig E, Solis-Trapala I, Dodd J, Jebb SA.. Estimating food portions. Influence of unit number, meal type and energy density. Appetite. 2013;71:95–103. [DOI] [PMC free article] [PubMed] [Google Scholar]
- 55. Ovaskainen M-L, Paturi M, Reinivuo H, Hannila M-L, Sinkko H, Lehtisalo Jet al. Accuracy in the estimation of food servings against the portions in food photographs. Eur J Clin Nutr. 2008;62:674–81. [DOI] [PubMed] [Google Scholar]
- 56. Yuhas JA, Bolland JE, Bolland TW.. The impact of training, food type, gender, and container size on the estimation of food portion sizes. J Am Diet Assoc. 1989;89:1473–4. [PubMed] [Google Scholar]
- 57. Lafrenière J, Lamarche B, Laramée C, Robitaille J, Lemieux S.. Validation of a newly automated web-based 24-hour dietary recall using fully controlled feeding studies. BMC Nutr. 2017;3: 34. [DOI] [PMC free article] [PubMed] [Google Scholar]
- 58. Gemming L, Ni Mhurchu C. Dietary under-reporting: what foods and which meals are typically under-reported?. Eur J Clin Nutr. 2016;70:640–1. [DOI] [PubMed] [Google Scholar]
Associated Data
This section collects any data citations, data availability statements, or supplementary materials included in this article.