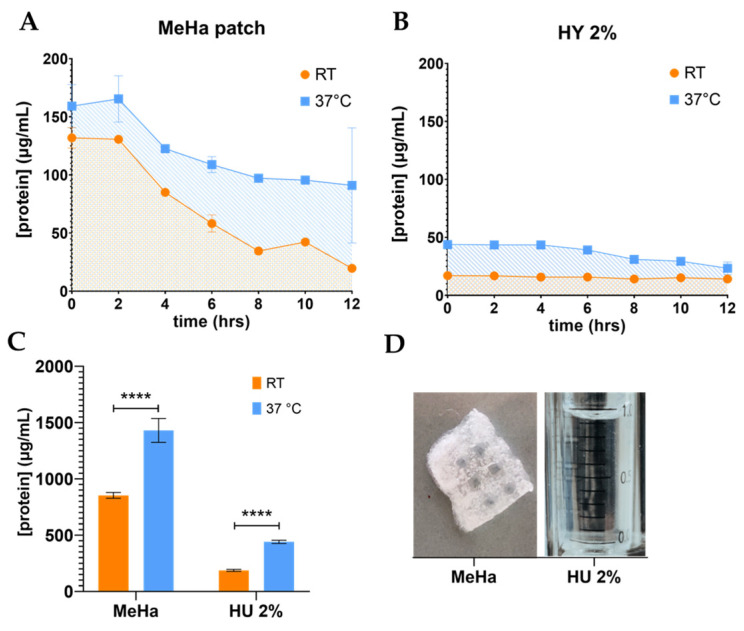
Figure 2.
(A,B) Release curve of ADNVs from hyaluronic-acid-based materials, MeHA patch and HY 2% gel, at room temperature (RT = 25 °C) and physiological temperature (37 °C). ADNV release is expressed in form of protein concentration (μg/mL) in time (hours). (C) Values corresponding to the area underneath each curve in (A,B) (SE). (D) Illustrative image of MeHA patch and HY 2% gel. **** p < 0.0001.

