Figure 1.
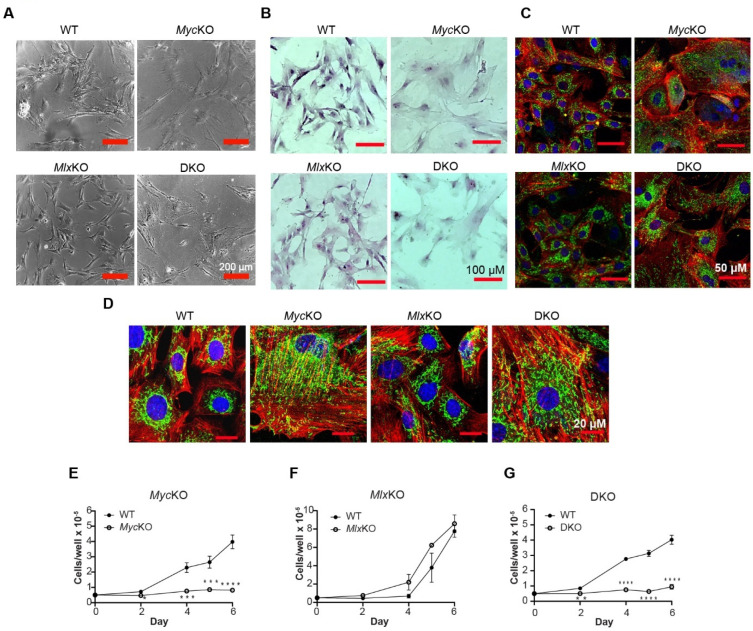
Morphological features and growth curves of MEFs: (A) Phase-contrast images of live, day 14 MEFs. (B) The same cells grown on coverslips, fixed, and stained with H & E. (C) Confocal micrographs of day 14 MEFs after staining of nuclei with Hoechst 33342, mitochondria with MitoTracker™ Green, and the cytoskeleton with Cell Mask Orange Actin Tracker. (D) Higher-magnification live confocal images of the indicated cells obtained on day 21, showing an apparent increase in mitochondrial mass in MycKO and DKO MEFs (green). In A-D, red bars are included as sizing references as indicated in the rightmost/lower rightmost images (E–G) Growth curves of MycKO (E), MlxKO (F), and DKO MEFs (G), each performed in parallel with WT cells. All cells were plated in 4OHT-free medium on day 7. Each point represents the mean of three replicas ± 1 S.E. Significance was determined by multiple ratio paired t-tests; * p < 0.1, ** p < 0.01, *** p < 0.001, **** p < 0.0001.

