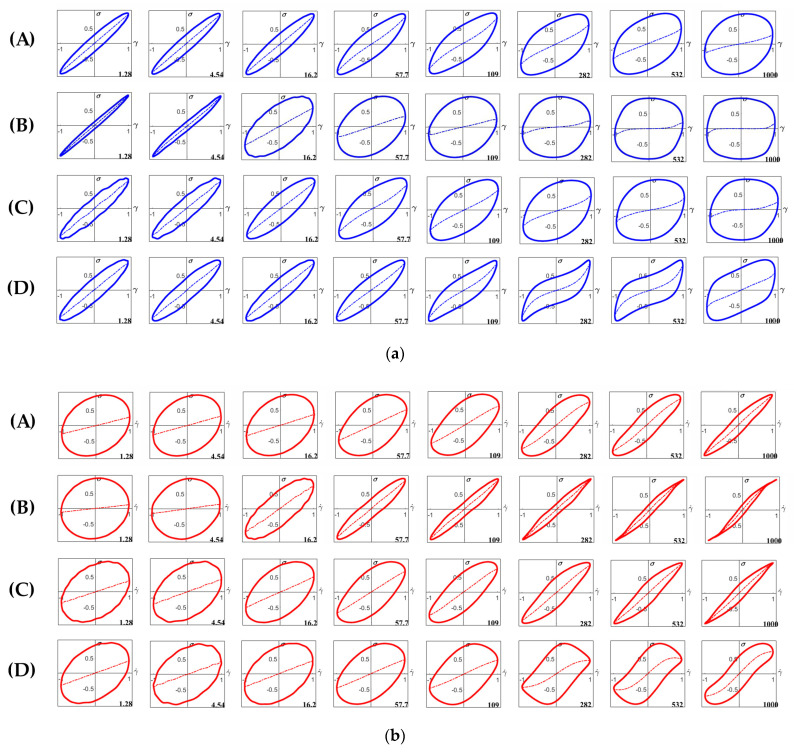
Figure 10.
(a) Lissajous plots of stress versus strain (τ (γ)) for starch gels in the sugar–acid system with shear strains (γ) of (from left to right) 1.28%, 4.54%, 16.2%, 57.7%, 109%, 282%, 532% and 1000% at 25 °C: (A) TS, (B) RS, (C) WTS, and (D) WRS. Dashed curves inside the loops indicate the contribution of the elastic stress to the total stress [34]. (b) Lissajous plots of stress versus strain rate (τ ()) for starch gels in the sugar–acid system with shear strains (γ) of (from left to right) 1.28%, 4.54%, 16.2%, 57.7%, 109%, 282%, 532% and 1000% at 25 °C: (A) TS, (B) RS, (C) WTS, and (D) WRS. Dashed curves inside the loops indicate the contribution of the viscous stress to the total stress [34].

