

Abstract
During tissue development, stem and progenitor cells form functional tissue with high cellular diversity and intricate micro- and macro-architecture. Current approaches have attempted to replicate this process with materials cues or through spontaneous cell self-organization. However, cell-directed and materials-directed organization are required simultaneously to achieve biomimetic structure and function. Here, it is shown how integrating live adipose derived stem cells with gradient microgel suspensions steers divergent differentiation outcomes. Microgel matrices composed of small particles are found to promote adipogenic differentiation, while larger particles fostered increased cell spreading and osteogenic differentiation. Tuning the matrix formulation demonstrates that early cell adhesion and spreading dictate differentiation outcome. Combining small and large microgels into gradients spatially directs proliferation and differentiation over time. After 21 days of culture, osteogenic conditions foster significant mineralization within the individual microgels, thereby providing cell-directed changes in composition and mechanics within the gradient porous scaffold. Freeform printing of high-density cell suspensions is performed across these gradients to demonstrate the potential for hierarchical tissue biofabrication. Interstitial porosity influences cell expansion from the print and microgel size guides spatial differentiation, thereby providing scope to fabricate tissue gradients at multiple scales through integrated and printed cell populations.
Keywords: Biofabrications, differentiations, gradients, mesenchymal stem cells, microgels
Graphical Abstract

Granular microgels were synthesised in variable sizes and used to form spatial gradients. Adipose derived stem ells are integrated uniformly within the microgel suspension or printed as high-density aggregates with an interstitial matrix to bind the construct together. The properties of the microgels and the intervening matrix both contribute to guiding adipogenesis and osteogenesis
1. Introduction
Human organs are comprised of complex tissues with gradient properties across multiple length scales which underlie form and function. Mimicking the gradient hierarchies in vitro during biofabrication requires capturing and controlling spatiotemporal cellular and extracellular diversity. There have been numerous bioengineering efforts in developing techniques and materials that replicate some of these properties such as vasculature,[1–3] tissue form,[4–6] tissue function,[7–9] innervation,[10,11] and cellular organization and hierarchy. However, combining those properties within one system has remained a fundamental and unresolved goal in tissue biofabrication. To tackle this challenge, significant attention is required for the materials and the cells used as well as their organization. For two decades, the dominant focus in biofabrication has been establishing materials and techniques that align towards faithful recapitulation of tissue-level structure, while the cells are often integrated within these structures all at once with less control. This limits the temporal establishment of desirable heterogeneity accomplished through natural tissue development.
A key driver in orchestrating this hierarchy during in vivo tissue development are stem cells. They have become the standard candidate for attempts to build in vitro tissues, as their multipotency can give rise to a broad range of cellular diversity. Critically, however, guiding stem cells down the correct differentiation paths with spatial and temporal control has remained a chief challenge in the field.[12–14] Gradient biomaterials have emerged as a promising tool to build in hierarchical material organization prior to cellular involvement. Fabrication techniques for forming gradients range from additive manufacturing to component redistribution to post modification.[15,16] Gradients of mechanics, cells, material compositions, morphogens, and architecture have been produced with applications across osteochondral interfaces and, cardiac, neural, and vascular engineering.[17,18]
In addition to these examples, biofabricated constructs of microgels have emerged as a promising 3D cellular matrix to emulate tissue structure. These materials are composed of hydrogel microparticles (1–1000 um) and have the advantage of an interdigitated porosity that enhances nutrient and oxygen diffusion, cell proliferation, and cell motility.[19–23] Microgel suspensions show promise as a hierarchical gradient biomaterial given their inherent modularity, where particles can have different sizes, materials, mechanics, porosity, and loaded contents—including live cells.[24,25] Dino Di Carlo and colleagues harnessed this modularity and demonstrated the first gradient microgel system by tuning microscale stiffness.[26]
A unique property of microgels is their ability to pack tightly to create granular solids. When packed at a high enough density, microgel suspensions enter a jammed state where they hold their shape under equilibrium conditions but flow and move when shear forces are applied. This allows for the granular gels to be used as support baths for freeform 3D bioprinting as print needles can freely move throughout a material to deposit ink, while the printed ink subsequently locks in place. Jammed microgel suspensions were demonstrated to yield high resolution prints with complex architectures from jelly fish mimics[27] to functional heart valves.[4,28] These initial works used sacrificial support baths where the granular gel is removed after the print is complete. Subsequent studies have explored methods where cells are either printed directly into the suspension, or the suspension is made of cellular solids.[29,30] More recently, we demonstrated how the suspension could be used as a matrix for live cells with means to “lock” the microparticles in place through adding various chemical handles to the base polymer.[24,25] In this way, the granular suspension is stabilized thereby providing a bulk scaffolding with microscale porosity for cells to proliferate and migrate throughout.
Microgels have been shown to enhance stem cell differentiation by fostering high spread cell morphologies, increasing cell proliferation, and providing adequate nutrient diffusion.[31,32] In this paper, we demonstrate size gradient microgels to explore how uniformly embedded adipose derived stem cells (ADSCs) and 3D printed populations respond to the properties of the matrix. Changes in microparticle size and the corresponding interstitial porosity induced cellular and nuclear morphological changes, which coincided with differentiation when exposed to osteogenic and/or adipogenic supplements. In addition to uniformly dispersed cells, the properties of the suspension allow 3D printing of high density cell inks, with the surrounding gradient microgels dictating proliferation, migration and differentiation outward from the defined cell aggregates. The intersttitial porosity contains a soft “filler” hydrogel that accommodates cell migration and proliferation around the microgels, thereby providing a unique model system to study stem cell differentiation within a 3D structured matrix. The benefit of our this approach is the ability to create multiple, modular, nonlinear gradients spanning the micro to macro scale with flexibility to incorporate cells with spatial organization that is independent to the direction of the material’s gradient.
2. Results and Discussion
2.1. Creating Size Gradients with GelMa Microparticles
Jammed microgel suspensions hold their shape under static conditions but flow when shear force is applied. By conjugating pendant methacrylate groups to our microgels, the jammed suspensions can be photocrosslinked, locking all particles into one cohesive matrix (Figure 1A). This permanent stitching enables us to add cells in two distinct ways: 1) they can be dispersed throughout the suspension, similar to conventional bulk 3D matrices; or 2) they can be directly written into the suspension with spatial control. To create cell-laden jammed suspensions with gradients, two different types of microgel suspensions are simply placed next to each other. This creates coarse gradients with little interparticle diffusion across the boundary; however, mechanically mixing at the boundary transforms it into a gradual gradient (Figure 1Bi-iii). The microgels can be manually added, or even 3D printed to control higher spatial organization (Figure 1Biv). Once the desired gradient type is achieved, the suspension can be photocrosslinked to stich everything together.
Figure 1.

Design for gradient microgels. A) A schematic describing the methodology for creating gradient microgel suspensions with different sized particles for stem cell culture and differentiation. B) Optical images of microgels with two (i) or three (ii) different particle types, with a soft gradient between two particle types (iii), and with spatially organized particle separations (iv). Scale Bars: 2 mm.
Medium sized GelMa microgels were synthesized with the same method as previously described.[25] Briefly, an oil bath was heated up to 40 °C and liquid GelMa (10 wt%) was added dropwise under rapid stirring to yield small particle droplets. The suspension was cooled to 10 °C to physically crosslink the microparticles before they were washed and dehydrated with acetone for long-term storage. To create smaller particles, an amphiphilic surfactant (Span 80) was added. This coats the liquid gelatin droplets and reduces the interfacial tension of the oil and water phases, allowing the droplets to stabilize at smaller sizes. For larger particles, the emulsion spinning speed was halved. Here, lower shear forces reduce particle breakup while enabling more droplet aggregation.[36,37] One caveat with lowering rotation speed is that the slower it spins, the less stable the emulsion will be—leading to high polydispersity. Therefore, spin speed was reduced by no more than 50% (˜600 – ˜300 rpm). Together, these three procedures created small, medium, and large particles with 48, 83, and 260 μm diameters, respectively. The standard deviations of the mean particle diameters were 25, 31, and 150 μm, respectively (Figure 2A). Using Equation (1), the polydispersity values for the three particle sizes were 0.24 (small), 0.15 (medium), and 0.34 (large) (Table S3, Supporting Information). In addition, the average particle diameters give the respective curvature values of 0.021 ± 0.011, 0.012 ± 0.05, and 0.004 ± 0.002 μm−1.
Figure 2.

Characterization of different sized microgels. A) Size distributions of large (top), medium (middle), and small (bottom) microparticles. Insert images are optical microscope images of particles. B) Shear strain rate (log ramp of 0.02–10 s−1, over 8 min) versus viscosity plot for three different particles sizes run on a parallel plate rheometer. C) Rheology gelation curves (0.02% strain, 1 Hz) with 60 s of UV light (between the 180 and 240 s mark of the test). Scale Bars: 100 μm.
Once the particles are washed and stored in acetone, they must be rehydrated for at least 24 h in phosphate buffered saline (PBS) or cell media prior to use.[25] To create reproducible suspensions, dried particles were weighed out and a specific ratio of pure cell media, a photocrosslinker solution (0.05 wt% final of LAP), and a 1 wt% GelMa solution were added to rehydrate the particles consistently. The 1 wt% GelMa solution was added to act as a “filler” that helps stich all the particles together, while aiding in the handleability and printability of the jammed suspension.[25] To quantify porosity, the void fraction of the microgel suspensions was calculated by taking confocal z-stacks of microgel suspensions, a commonly used method for granular gels,[38–40] with void space calculated from fluorescein tagged GelMa filler. No statistical differences were found across all three sizes (Figure S2, Supporting Information).
When assessing the rheological properties of all three particle sizes, each was found to have the characteristic shear thinning behavior of jammed suspensions (Figure 2B).[19,20,41] Upon photocrosslinking, all three particle suspensions were found to have a final bulk storage modulus of roughly 2–4 kPa (Figure 2C). This is particularly interesting as the rheology of the GelMa used for each individual particle is roughly 50 kPa (Figure S1B, Supporting Information). We have also previously shown that interstitial filler creates a soft environment directly around the particles. These data taken together highlight one of the challenges with mechanical characterization of jammed heterogeneous solutions, where it is difficult to quantify specific matrix forces and mechanics acting on a single embedded cell. Atomic force microscopy is also limited to measuring a shallow depth of less than one micron past the surface of a microgel suspension. This suggests that more complex methods may be needed to probe the local mechanics near cells within the microgel suspensions.
2.2. Microgel Sizes Influence Adipose Derived Stem Cell Morphologies
Cell spread area on hydrogels will vary from 1000 to 10 000 μm2. This corresponds to a median cell diameter of roughly 70 μm. Therefore, our fabricated particles ranging from small (48 ± 25 μm), medium (83 ± 31 μm), and large (264 ± 154 μm) diameters range from approximately the size of a spread cell to multiple times their diameter. To investigate how particle size influences adipose derived stem cells (ADSCs), we seeded one million cells per mL within microgel suspensions composed of small, medium, or large particles. Cells were cultured and subsequently fixed after 1, 3, or 7 days. For this and all subsequent experiments, cells were mixed into a prehydrated microgel suspension such that cells are located within the interstitial space between particles and not within individual particles. Confocal z-stack projection images of actin qualitatively showed higher cell spreading on larger particles overtime (Figure 3A). Z-stack images were then input into Imaris to segment individual cells for quantification (Figure 3B). Cell volume plots indicated increasing cell size and spreading correlated with increased particle size as well as increased length of time in culture (Figure 3C). Notably, cell sphericity and nuclear sphericity decreased with increasing particle sizes (Figure 3C; and Figure S3A, Supporting Information). To understand how particle geometry plays a role, the average cell volume at each time point was plotted against the mean particle curvature for each particle size (Figure S3B, Supporting Information). After day 1, a clear trend of decreasing cell volume with increase particle curvature can be seen. However, there is no trend in changing cell volume at early timepoints, suggesting that cells remain within the interstitial filler space, and are not directly influenced by the properties of the microgels in the suspensions. In addition, while the interparticle spacing was highest for large particle suspensions, cells in all three particle size conditions were able to reach full spreading after 7 days. This suggests that the interparticle spacing has little effect on the time required for cells to migrate and conform to the microgel surface.
Figure 3.
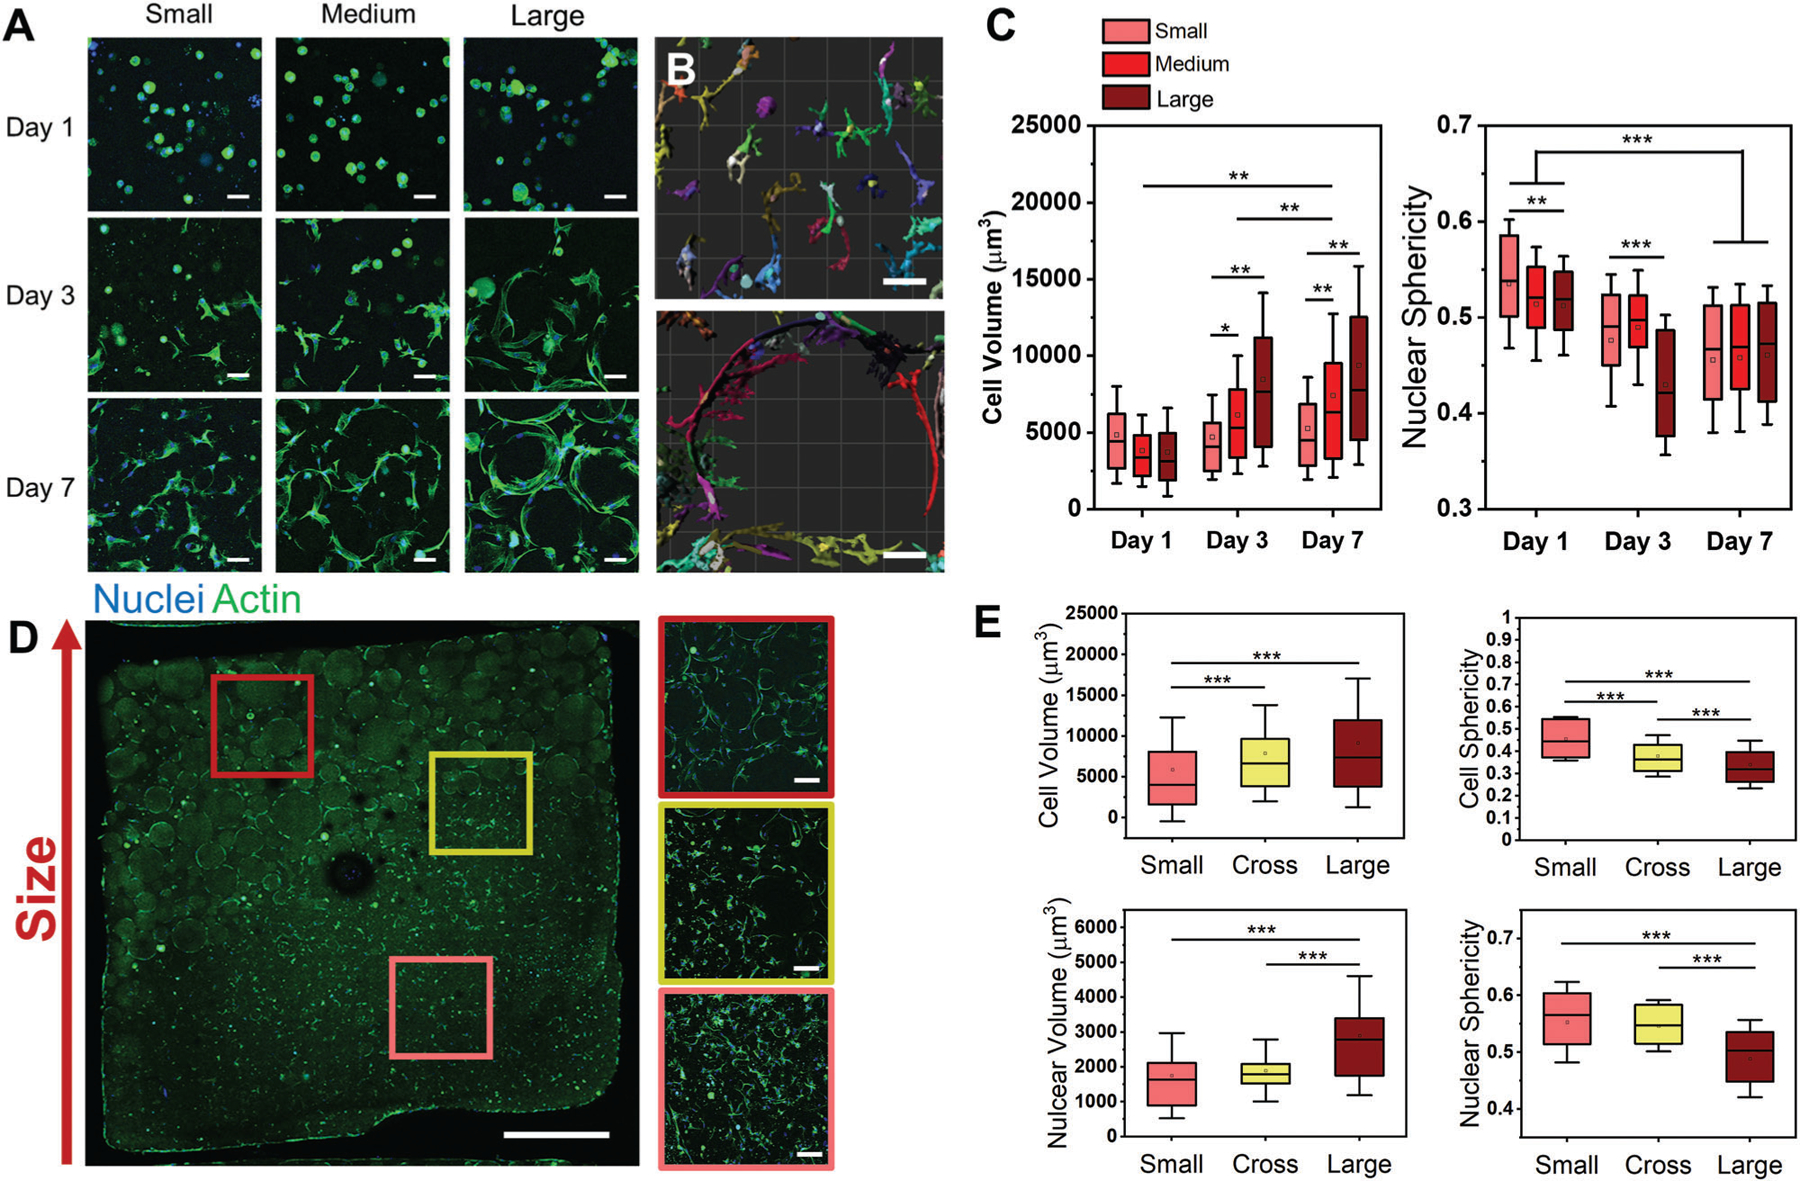
Adipose derived stem cells (ADSCs) seeded in microgels with expansion media. A) Confocal z-stack projection images (51 slices over 100 μm) of nuclear and actin stains ADSCs seeded in microgels with small, medium, and large particles over 1, 3, and 7 days. B) Imaris reconstructions of cell volumes from confocal z stacks of microgels made with small (top) and large (bottom) particles. C) Morphometric analysis plots of cell volume (left) and nuclear sphericity (right) of cells in microgel suspensions with varied sized particles. D) Confocal z-stack projections of ADSCs stained for actin and nuclear stains in a small to large particle gradient suspension. E) Morphometric analysis plots for the three regions highlighted from (D). Scale Bars: 50 μm A,B), 100 μm D (right)), and 1 mm D (left)). *P < 0.05, **P < 0.01, ***P < 0.001, ANOVA. Error bars represent s.d.
To verify if the morphometric differences were maintained across a gradient suspension, we created a spatial gradient of small and large particles through simple mixing (Figure 3D). We observed the same trends in cell morphometrics from the small particle suspension to the large particle suspension, with no clear changes at the interface. Specifically, cells adherent to larger particles maintained higher spreading and volume, lower cell sphericity, lower nuclear sphericity, and increased nuclear volume relative to those adherent to small particles (Figure 3E). Consistent cell counts between regions suggest little particle size-induced cell taxis.
It is well established that cell area and shape are linked to mesenchymal stem cells (MSC) differentiation outcomes.[42–44] Large and more spread cells tend to have more robust stress fibers and focal adhesions, which help trigger focal adhesion kinase mediated activation of ERK1/2 and p38 which in turn activate RUNX2 to induce Osteogenesis.[45] On the flip side, cell confinement and sphericity has been tied to adipogenic differentiation outcomes.[43,46] There has also been work suggesting that nuclear shape plays a role in differentiation outcomes.[47,48] These findings highlight the importance of cell morphology during lineage specification and suggests that changing morphometrics may correspond to varied differentiation outcomes.
2.3. Smaller Microgel Particles Guide Adipogenesis Lineage Specification
Since our morphometric analyses suggested changes in cell shape with changes in microgel size, we next investigated adipogenic differentiation outcomes of ADSC laden microgel suspensions. These suspensions were subjected to either growth media (control media) or adipogenic differentiation media. An initial look at day 7 cell morphometrics reveals less cell spreading in all cells exposed to adipogenic media compared to those cultured in growth media (Figure 4A). Cells were also significantly rounder in adipogenic media when compared to control media, and cells within the small microgel suspensions were significantly rounder than those cultured within the larger microgel suspensions (Figure 4B). We also confirmed higher nuclear sphericity for cells cultured within small microgel suspensions (Figure 4A,B). These findings correlate well with previous work demonstrating that MSCs undergoing adipogenesis have lower cell area and high cell sphericity.[43,44,42] However, previous work on 2D substrates has found that adipogenic differentiation caused a slight reduction in nuclear sphericity (6%),[49] while previous work in 3D found no correlation between nuclear shape and adipogenesis.[50] Further work is required to understand the relationship between nuclear shape and adipogenesis.
Figure 4.

Adipose derived stem cells (ADSCs) differentiated into adipocytes. Morphometric analysis plots of cell volume A) and Cell sphericity B) of cells in microgel suspensions with varied sized particles exposed to control media or adipogenic media. C) Confocal z-stack projection images (51 slices over 100 μm) of nuclear, actin, and FABP4 stained ADSCs seeded in microgel suspensions with small, medium, and large particles over 7, and 21 days in control or adipogenic media. D) Plot of fraction of FABP4 positive cells after 21 days of differentiation in adipogenic media. E) Brightfield optical images of Oil red O stained MSCs after 21 days of adipogenic differentiation. F) Normalized mRNA expression levels of CEBPA (left) and PPARG (right) of ADSCs after 14 days of differentiation on either glass or within small-microgel suspensions exposed to control media or adipogenic media. Scale bars: 50 μm C,E). *P < 0.05, ***P < 0.001, ANOVA. Error bars represent s.d.
To evaluate adipogenesis, we fixed and stained cells for FABP4 (Figure 4C), a late stage adipogenic marker that binds to hydrophobic ligands in lipid droplets of mature adipocytes.[51] At day 7, we saw negligible expression of FABP4, which is consistent with the literature.[52,53] However, after 21 days of culture we found significantly higher FABP4 expression in cells exposed to adipogenic media with no expression in cells cultured in growth media (Figure 4C). When counting the fraction of cells that expressed FABP4 in the three different size conditions, there was significantly more cells expressing FABP4 in small particle suspensions (82%) compared to medium (57%, P = 0.027) and large (65%, N.S., P = 0.098) suspensions (Figure 4D). These findings are consistent with the morphometrics where smaller microgel suspensions contained smaller and rounder cells. At day 21, adipogenic cells in small microgel suspensions were more spherical than cells in medium and large microgel suspensions. There were no differences in cell volume at day 21 irrespective of culture conditions (Figure S5A, Supporting Information) suggesting the tight packing of cells at this later timepoint normalizes cell volume.
To further confirm differentiation, we sectioned and stained microgel suspensions with Oil red O, a histological stain for lipid droplets. While red cells can be seen in adipogenic media conditions and not in control media (providing a semiquantitative measure of adipogenesis), the particles obfuscated the light which severely limited our ability to quantify cell counts (Figure 4E). Therefore, we ran real time quantitative PCR (RT-qPCR) on small particle samples after 14 days. The adipogenic small microgel suspensions were found to have significantly higher expression of PPAR-gamma and CEBP-alpha, common adipogenic lineage markers, when compared to control media and glass controls (Figure 4F). Taken together, ADSCs cultured within a jammed suspension of small particles were more conducive to adipogenesis compared to larger microparticle suspensions.
2.4. Larger Microgels Promote Osteogenic Lineage and Mineralization of Microgels
We next cultured ADSC laden suspensions with osteogenic media. Day 7 morphometrics show higher cell spreading on medium and large particles in osteogenic media when compared to the growth media (Figure 5A). Surprisingly, the medium microgel suspensions lead to higher cell spreading and lower cell sphericity when compared to large microgel suspensions under both media conditions. This may be due to the high polydispersity of the large microgel solutions, leading to broad variability in the surrounding cell morphologies (Table S3, Supporting Information). Additionally, the small microgel suspensions contained more spherical cells compared to the medium and large microgel suspensions, with increased cell and nuclear sphericity on account of osteogenic media (Figure 5A; and Figure S4B, Supporting Information). Since there were fewer differences between control and osteogenic media by day 7, we evaluated expression of the early osteogenic marker runt-related transcription factor 2 (RUNX2) (Figure 5B). When counting the fraction of RUNX2 positive cells, medium microgel suspensions showed a higher fraction of positive cells (67%, P = 0.030) compared to cells cultured in the small microgel suspensions (46%) (Figure 5C). Large microgel suspensions also contained cells with lower RUNX2 expression (62%, N.S. P = 0.34) which is consistent with the higher cell sphericity and lower cell volume compared to medium particles.
Figure 5.

Adipose derived stem cells (ADSCs) undergoing osteogenesis. A) Morphometric analysis plots of cell volume (top) and Cell sphericity (bottom) of cells in microgel suspensions with varied sized particles exposed to control media or osteogenic media. B) Confocal z-stack projection images (51 slices over 100 μm) of nuclear, actin, and RUNX2 stained ADSCs seeded in microgels with small, medium, and large particles after 7 days in control or osteogenic media. C) Plot of fraction of cells with Nuclear RUNX2 after 7 days of differentiation in osteogenic media. D) Photographs of ADSC loaded microgel suspensions after 21 days in either control (left) or osteogenic (right) media. E) MicroCT analysis heatmap of the density of microgel matrices. F) Percentage of microgel matrices with density higher than 300 Hounsfield values (from MicroCT analyses). G) Normalized mRNA expression levels of osteopontin in ADSCs after 14 days of differentiation on either glass or within medium-microgel suspensions exposed to control media or osteogenic media. H) Scanning electron microscopy images of a mineralized particle at 750x (left), 2000x (middle), and 5000x (right) magnification. I) Young’s moduli calculated from compressive stress tests on small and medium microgel suspensions after 7 or 21 days in osteogenic media. Scale bars: 100 μm B), 2 mm D), 1 mm E), 25 μm H, left), 10 μm H, mid), 5 μm, H, right). *P < 0.05, ***P < 0.001, ANOVA. Error bars represent s.d.
As we continued to differentiate the cells to 21 days, we noticed the osteogenic gels began to turn opaque between days 10 and 14, and significantly so by day 21 (Figure 5D). To investigate if this opacity was due to mineralization, we ran Micro Computed Tomography (MicroCT) at days 7 and 21. Bone levels of mineralization was classified by a Hounsfield of 300 or more,[54] and these volumes were segmented from the main gel to calculate percentage of the gel volume that was mineralized (Figure 5E). All day 7 gels and all control media day 21 gels had no volumes with HU values greater than 300. However, day 21 osteogenic media conditions had substantial mineralization (Figure 5F). We found that the medium microgel suspensions had up to 3% the total volume as mineral (Average 2.92 vol%, STD: 0.11%) which was 4 times higher than the small microgel suspensions (Average 0.78 vol%, STD: 0.43%, P = 0.0012). The large microgel suspensions was found to have a 2.5-fold increase of mineral content compared to the small particles (Average 2.1 vol%, STD: 0.31%, P = 0.010). To verify that mineralization corresponds with osteogenic differentiation, we performed RT-qPCR of the late osteogenic marker osteopontin, demonstrating robust expression in the osteogenic condition alone (Figure 5G).
To further evaluate osteogenesis, we probed alkaline phosphatase (ALK) activity in our microgel matrices over time, including a condition with mixed (half adipogenic and half osteogenic) media. We found that day 7 ALK levels were higher in the osteogenic and mixed media conditions compared to control gels. Control and mixed media conditions also lead to higher ALK content at day 21 when compared to day 7 (Figure S6, Supporting Information). Interestingly, the mixed media conditions had the highest ALK levels by day 21. However, MicroCT scans confirm higher mineral content in the osteogenic condition when compared to the mixed media condition. ALK is an early marker of osteogenesis and previous work has demonstrated a reduction in activity with osteoblast maturation.[55–57] Therefore, it is likely that cells cultured in pure osteogenic media have developed a more mature osteogenic phenotype as indicated by decreased ALK and increased mineralization.
When looking at these mineralized gels under the optical microscope, it is clear that mineralization is occurring within the individual particles rather than the softer, less dense, surrounding interstitial space (Figure S7A, Supporting Information). While the entire gel is noticeably darker, it is the mineral within particles that is dense enough to be classified as bone mineral via MicroCT (Video S1, Supporting Information). [58,59,60,61]To supplement these results, samples were dried and imaged via scanning electron microscopy (SEM). A clear nanoporous architecture containing hemispherical nodules is evident on the interior of the microparticles (Figure 5H). A similar architecture was found in GelMa gels by Ning and colleagues where they manually mineralized hydroxyapatite within the gel structure by soaking the gels in ionic solutions.[62] We verified that these dark dense regions are calcium phosphate deposits using Energy-dispersive X-ray spectroscopy (EDX) (Figure S8, Supporting Information).
In vivo the osteoblasts first deposit collagen fibers followed by deposition of calcium and phosphate ions to nucleate hydroxyapatite crystals at the intrafibrillar gaps.[58] The mineralization of collagen matrices has been applied in vitro to create bone mimics,[59,60] and the use of gelatin as a hydrogel template for mineralization has been previously demonstrated.[61] However, direct mineralization by osteoblasts within a hydrogel has not been rigorously studied. Here we see that MSCs undergoing osteogenesis completely envelope the medium sized particles (Figure S7B, Supporting Information), which could provide conditions for preferential mineralization within the dense microgel core. This is consistent with the periodic arrangement of mineralized nodules we observed.
Mineralization is a key step in providing the robust mechanical properties of bone. To probe the effect of mineralization on hydrogel mechanics, compression tests were performed on gels prior to fixation. Since there was little difference in mineralization between large and medium microgel suspensions, and the medium particles showing improved osteogenesis, all following experiments were performed on suspensions of small and medium particles only. We found that hydrogels fabricated from small and medium microparticles had a stiffness of around 5.7 kPa when compressed at day 7 prior to mineralization (Figure 5I; and Figure S9, Supporting Information), which corelates well with the rheological measurements. By day 21 there was a 650% and 410% increase in stiffness for the medium (P < 0.0001) and small (P = 0.0012) particles, respectively, with medium microgel suspensions having 63% higher stiffness compared to small microgel suspensions (P = 0.016). This result correlates well with the higher mineral content found in the medium particle conditions. Considering the correspondence between gene and protein expression, as well as mineralized content through MicroCT, we found that medium microgel suspensions are optimal matrices for inducing osteogenic differentiation.
2.5. Initial Biophysical Cues Guide Stem Cell Differentiation
It is well appreciated that early mechanics and cell-matrix interactions can play an important role in guiding stem cell fate.[63,64] After integrating cells within the microgel suspensions, we showed how cells are initially confined to the soft interstitial space followed by engraftment and conformation to the surface of the microgels. Subsequently, the size and spacing of the microgels direct the degree of cell spreading and associated shape descriptors. To gain a better understanding of initial conditions underlying differentiation, we probed the role of the interstitial filler in directing cellular processes. When filler is present, cells first experience the soft interstitial matrix before migrating towards the stiffer microgel particles (50 kPa stiffness) and spread out across the particle surface over 3–7 days (Figure 2). By removing the interstitial filler, we hypothesized that the cells would engage with the microgel earlier, thereby enhancing the mechanochemical signals preceding lineage specification.
To evaluate the role of filler in early adhesion, ADSCs were seeded within medium microgel suspensions with either 0, 0.5, or 1 wt% GelMa as the interstitial filler (Figure S10A, Supporting Information). Cells were first cultured for 1, 3, or 7 days to assess differences in initial morphologies. By day 1, it was clear that suspensions with lower filler percentage promoted faster cell spreading onto particle surfaces (Figure S10A, Supporting Information). No statistical difference was found for cell volume between conditions at the day 1 and 7 time points. However, within each condition, day 7 cells had a higher volume than their day 1 counterpart (Figure S10B, Supporting Information). In addition, there were pronounced difference in cell sphericity with 0.47 ± 0.07, 0.36 ± 0.08, and 0.26 ± 0.06 for the 1.0%, 0.5%, and 0% filler conditions respectively (Figure S10C, Supporting Information). This difference was statistically significant by day 3 (P < 0.0001), but the change in magnitude diminished and was no longer statistically significant at day 7 (1 vs 0%: P = 0.16; 1 vs 0.5%: P = 1; 0.5 vs 0%: P = 0.11). This experiment shows how the presence of filler prevents early adhesion, taking >3 days for cells to fully engage with the microgels.
To evaluate the role of early adhesion in guiding adipogenesis, cells were embedded in medium microgel suspensions with varied filler conditions (0, 0.5, or 1 wt% GelMa as filler) and exposed to adipogenic media for 21 days (Figure 6A). Immunostaining for FABP4 demonstrates that cells integrated with filler had a significantly higher percentage of adipocytes compared to no filler (0 vs 1%: P = 0.02; 0 vs 0.5%: P = 0.003) (Figure 6B). However, there was no significant difference between the 1% and 0.5% filler condition (P = 0.20). Quantifying cell numbers indicates a 420 ± 90% and 190 ± 70% increase in cell counts for the 0.5% and 1% filler condition, respectively, compared to no filler. When normalizing the number of FABP4 positive cells (in adipogenic media) to the number of total cells (from control media), the microgel suspensions with 0.5% filler had a 198 ± 28% increase in cells undergoing adipogenesis compared to the 1% and no filler condition, suggesting that more time within a soft interstitial matrix is optimal for ADSC differentiation (Figure S11A, Supporting Information). These results align with previous studies demonstrating softer matrices enhance adipogenesis.[63,65]
Figure 6.

Controlling cell matrix interactions to guide ADSC differentiation. A) Confocal z-stack projection images (51 slices over 100 μm) of nuclear, actin, and FABP4 stained ADSCs seeded in medium sized particle microgel suspensions with 0%, 0.5%, or 1.0% GelMa filler for 21 days in control or adipogenic media. B) Plot of fraction of FABP4 positive cells after 21 days of differentiation in adipogenic media. C) Right: Photographs of ADSC loaded microgel suspensions after 21 days in either 1% filler (top) or 0% filler (bottom). Left: Percentage of microgel matrices with density higher than 300 Hounsfield values (from MicroCT analyses) after 21 days. D) Confocal z-stack projection images (51 slices over 100 μm) of nuclear, actin, and FABP4 stained ADSCs seeded in small or medium sized particle microgel suspensions with 0%, 0.5%, or 1.0% GelMa filler for 14 days with 0 or 50 μm Blebbistatin added. Fraction of FABP4 positive cells in small E) or medium F) particle sized microgel suspensions that were untreated or treated with 50 μm Blebbistatin for 14 days. G) rt-PCR of PLIN1 expression of MSCs after 7 days in adipogenic media with or without Blebbistatin treatment. H) rt-PCR of RUNX2 expression of MSCs after 7 days in osteogenic media with or without Blebbistatin treatment. Percentage of microgel matrices with density higher than 300 Hounsfield values (from MicroCT analyses) for small I) and medium J) sized microgel suspensions after 21 days. J) Right: Photographs of ADSC loaded microgel suspensions after 21 days in either control media (bottom) or Blebbistatin treatment (top). Scale bars: 50 μm A,D), 4 mm C,G). *P < 0.05, **P < 0.01, ***P < 0.001, ANOVA. Error bars represent s.d.
To evaluate the role of early adhesion in guiding osteogenesis, cells were embedded in medium microgel suspensions with varied filler conditions (0 or 1 wt% GelMa as filler) and exposed to osteogenic media for 21 days (Figure 6A). Quantification of mineral content via MicroCT showed that the 0% filler condition had a 3000% increase in mineral content when compared to the 1% filler condition (P = 0.0077), with the sample becoming completely opaque by day 21 (Figure 6C). Compression tests demonstrated an 800% increase in stiffness for the no filler compared to the 1% filler microgel suspension (40 ± 29 vs 5.4 ± 2 kPa; P = 0.035). These results demonstrate how initial spreading on a rigid matrix is optimal for ADSC osteogenic differentiation. These results align with previous studies demonstrating spreading on stiff surfaces promotes osteogenesis.[63,65]
To further test the relationship between matrix properties, cell morphometrics, and differentiation, we used pharmacological inhibitors to perturb cell morphology through actomyosin contractility. For these studies, Blebbistatin, a Myosin II inhibitor, was chosen as it has been readily shown to attenuate MSC spreading.[66] Previous work has demonstrated that reduced myosin-based contractility can lead to rounder cells with a higher propensity for adipogenesis.[63] ADSCs were first embedded within microgel suspensions (either medium or small particles) and exposed to control media supplemented with either 0 or 50 μm of Blebbistatin for up to 7 days (Figure S12A, Supporting Information). Treatment of ADSCs with Blebbistatin leads to reduction in cell spreading with increased cell sphericity after 7 days (Figure S12B–D, Supporting Information) (P < 0.001). However, there was no overall decrease in cell volume (Figure S12E,F, Supporting Information). Next, ADSCs in microgel matrices were exposed to adipogenic or osteogenic media that was supplemented with either 0 or 50 μm of Blebbistatin. At day 14 of adipogenesis, the suspensions were fixed and stained for FABP4 (Figure 6D). Blebbistatin treatment led to increased adipogenesis for cells cultured within small (control 41 ± 5% vs +Bleb 69 ± 7%; P = 0.0003) and medium (control 52 ± 6% vs +Bleb 67 ± 9%; P = 0.032) microgel suspensions (Figure 6E,F). However, Blebbistatin treatment did not show evidence for enhanced adipogenesis at the transcript level using RT-PCR (Figure 6G; and Figure S12G, Supporting Information). Next, microgel suspensions were exposed to osteogenic media conditions for 7 days followed by fixation and staining for RUNX2. Blebbistatin treatment of cells cultured in the medium particle condition led to a decrease in RUNX2 expression (N = 3, P = 0.0264; Figure 6H). After 21 days, treatment with Blebbistatin under osteogenic conditions led to a 95% reduction in mineralization for cells cultured in both the small (P = 0.025) and medium (P = 0.0074) microgel suspensions. These results show how inhibiting actomyosin contractility increases adipogenesis and decreases osteogenesis by modulating cell adhesion and shape characteristics.
2.6. 3D Bioprinting Adipose Derived Stem Cells with Controlled Architectures
Controlling stem cell differentiation within a suspension of microgels is important for developing cell delivery materials and for establishing microporous scaffold materials for tissue engineering. However, an additional advantage to these suspensions is the ability to direct write materials and cells within the suspension.[4,28,29] To evaluate the potential for biofabrication, we first sought to characterize the printability of cells within the granular suspensions. Preliminary tests were first performed in medium sized particle suspensions to determine optimal printing parameters. Live dead analyses for printed lines showed no noticeable cell death after 24 h of printing (Figure S13, Supporting Information). Next, the diameter of printed lines of cells using a 22-gauge nozzle (410 μm inner diameter, Nordson EFD) was assessed at a variety of print speeds (0.5, 1, 2.5, and 10 mm s−1) (Figure 7A). For each print speed, four volumes of cell output were tested (0.25x, 0.5x, 1x, and 2.5x) with “1x” referring to the calculated ideal volume per distance to create a print with the same dimeter of the nozzle tip. Between each print volume group, at the 0.5 to the 1 mm s−1 speeds, there was a statistical difference (P < 0.05) of line diameter amongst all groups except the 0.25x versus the 0.5x (Figure 7A, D). To aid in assessment of print quality, matrices were fixed immediately after crosslinking to prevent cell movement and proliferation. Within each of the four print volume groups, there was no statistical difference among the line diameters as the speed increased from 0.5 to 2.5 mm s−1. However, for all groups aside from 0.25x, there was no evidence of deposited cells when printing at 10 mm s−1, suggesting that the print speed is too high. Even for the 0.25x group, only 3 out of 8 prints deposited cells and with significant gaps along the print length.
Figure 7.
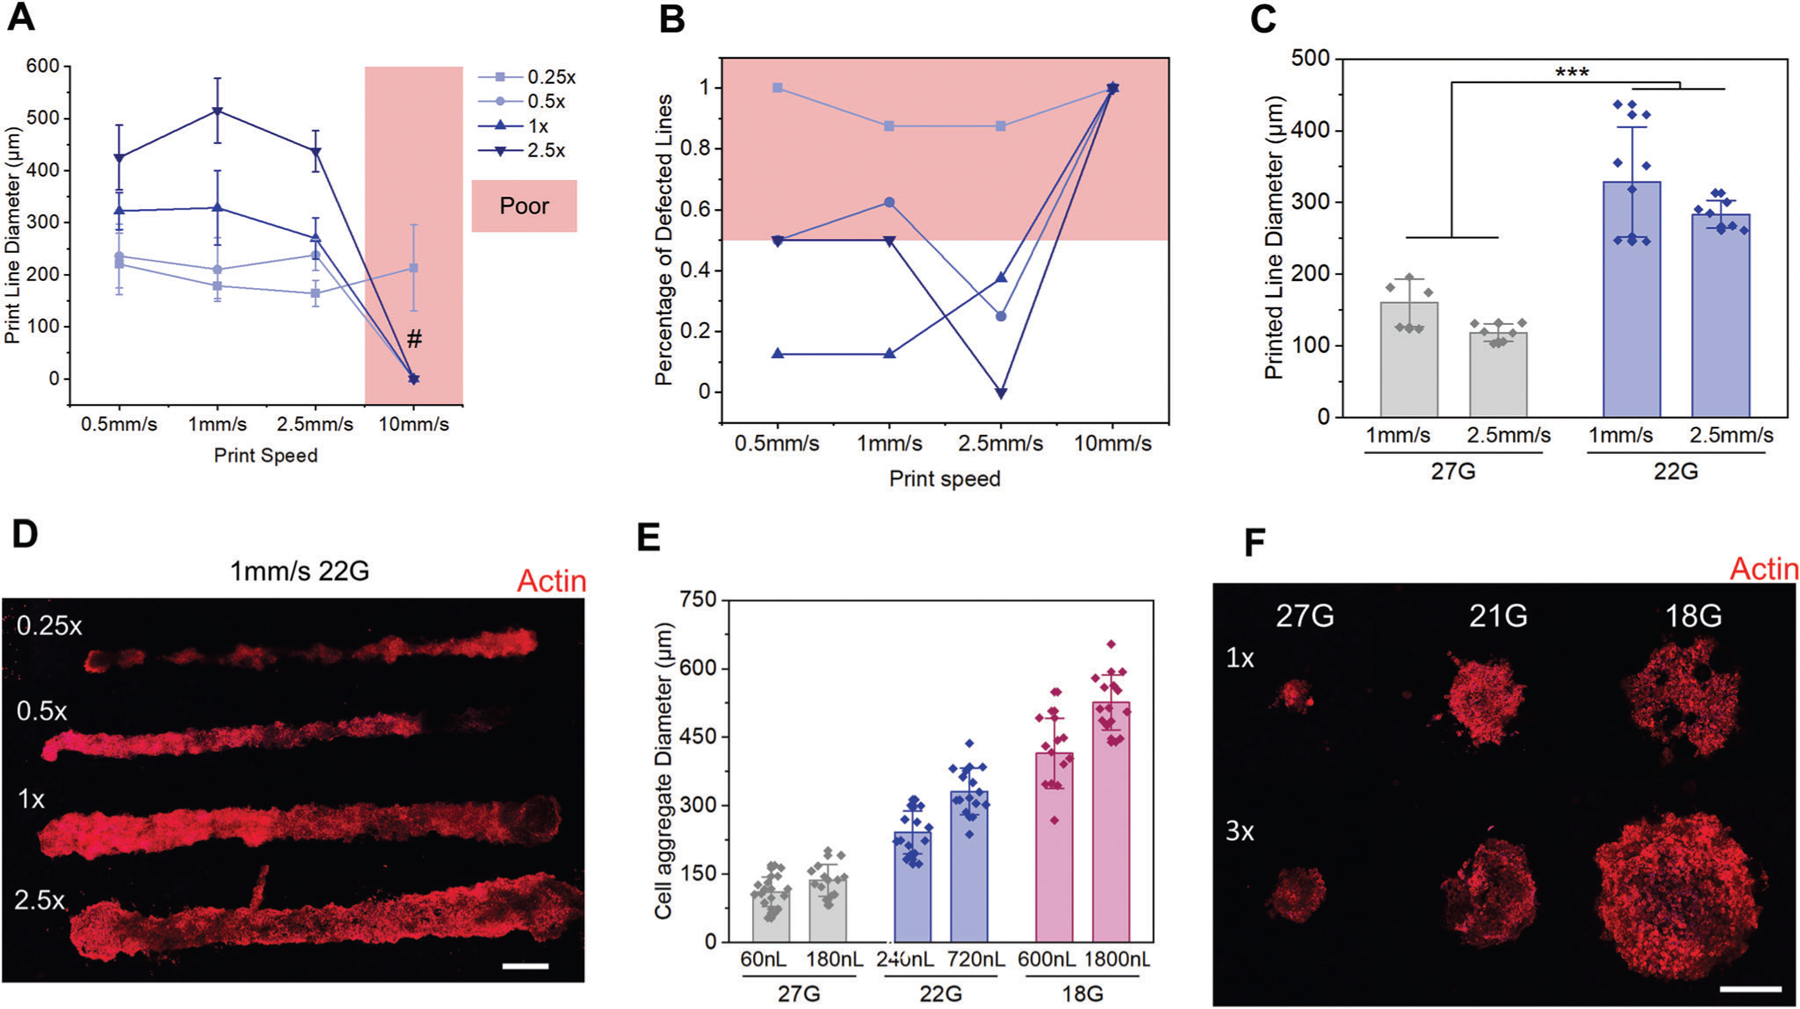
Characterization of 3D printed ADSCs into the microgel suspension when fixed immediately post print. A) Diameters of printed lines of cells (n = 8) as a function of print speed and print volume. B) Percentage of lines (n = 8) with defects when printed at varied speeds with varied volume. Anything with 50% or more defects is classified as a poor parameter choice. C) The printed cell line diameters when using either a 22G or a 27G nozzle. D) Confocal z-stack projection images of lines of ADSCs printed at varied volumes with a 22G nozzle at 1 mm s−1. E) Diameter of printed cell droplets using either a 27G, 22G, or an 18G nozzle. F) Confocal z-stack projection images of printed cell droplets with varied volumes and nozzle sizes. Scale bars: 300 μm D,F). # = not enough samples to compare, ***P < 0.001, ANOVA. Error bars represent s.d.
To better assess the quality of the prints produced, we aimed to determine what percentage of prints had defects. Two criteria were chosen: 1) the lines had breaks that created a segmented line; 2) the lines had gaps on the inside where little to no cells had printed, making them hollow tubes. When quantifying the number of defective lines, as expected, the 1x volume performed the best (Figure 7B), particularly at low speeds (1 mm s−1 or less), and the 0.25x volume performed the worst with more than 80% of all lines containing significant gaps. To create prints with less defects but at smaller or larger sizes, varied print nozzles can be used. A 27-gauge nozzle (200 μm inner diameter, Nordson EFD) created prints with less than 20% defect while having about 40% the width of the 22-gauge nozzle (Figure 7C). To demonstrate versatility, droplet architectures were also tested. Live dead results demonstrate high viability for droplets prints, comparable to the printed lines (Figure S14, Supporting Information). And by spanning of 3 different nozzles and two volume outputs, tight control over droplet diameter can be achieved (Figure 7E,F). These optimization studies suggest that 2.5 mm s−1 at a 1x volume produces the best line while little difference in droplet quality is found between nozzle sizes and volumes. Therefore, to maintain line integrity, all future tests were performed with the 22G nozzle at 2.5 mm s−1 speed and 1x volume for lines along with the 1x volume for droplets.
2.7. Directed Stem Cell Fate Across Size Gradients
The ability to spatially direct stem cell differentiation during biofabrication has remained a prominent challenge for tissue engineers.[67,68] With our optimized microgel size gradient matrices for adipogenic and osteogenic differentiation, we sought to create gradient microgel suspension for spatiotemporal control of differentiation. Small microgel suspensions were chosen to better guide adipogenic differentiation, with medium microgel suspensions chosen to direct osteogensis. After exposure to adipogenic media conditions, gradient microgel suspensions had a higher fraction of adipogenesis on the smaller microgel side when compared to the medium microgel side (Figure 8A,B). There was no statistically significant difference in the number of cells on either side of the gradients, suggesting materials properties were the main driver of differentiation (Figure S15 (Supporting Information), P = 0.51). In contrast, when exposed to osteogenic conditions, significantly higher mineralization was found on the medium microgel side of the gradient gels (Figure 8C). To direct both lineages simultaneously, gradient microgel matrices were exposed to mixed differentiation media. After 21 days, there was a higher fraction of FABP4 positive cells on the small microgel side when compared to the medium microgel side (52% small particles vs 35% medium particles, P = 0.023) (Figure 8D,E). However, when analyzing the mineral content of each side of the gel, there was no significant difference between the two sides (Figure S16B, Supporting Information). When analyzing the samples, it was found that the side with smaller microgels had over twice the number of cells when compared to the medium microgel side, and three times the number of cells when compared to samples cultured with control media (Figure S16C, Supporting Information). We hypothesize that this significant difference in cell number may lead to a higher overall mineral content, but lower mineralization per cell. Nevertheless, more work is needed to understand the influence of gradient microgel suspensions on cell proliferation.
Figure 8.
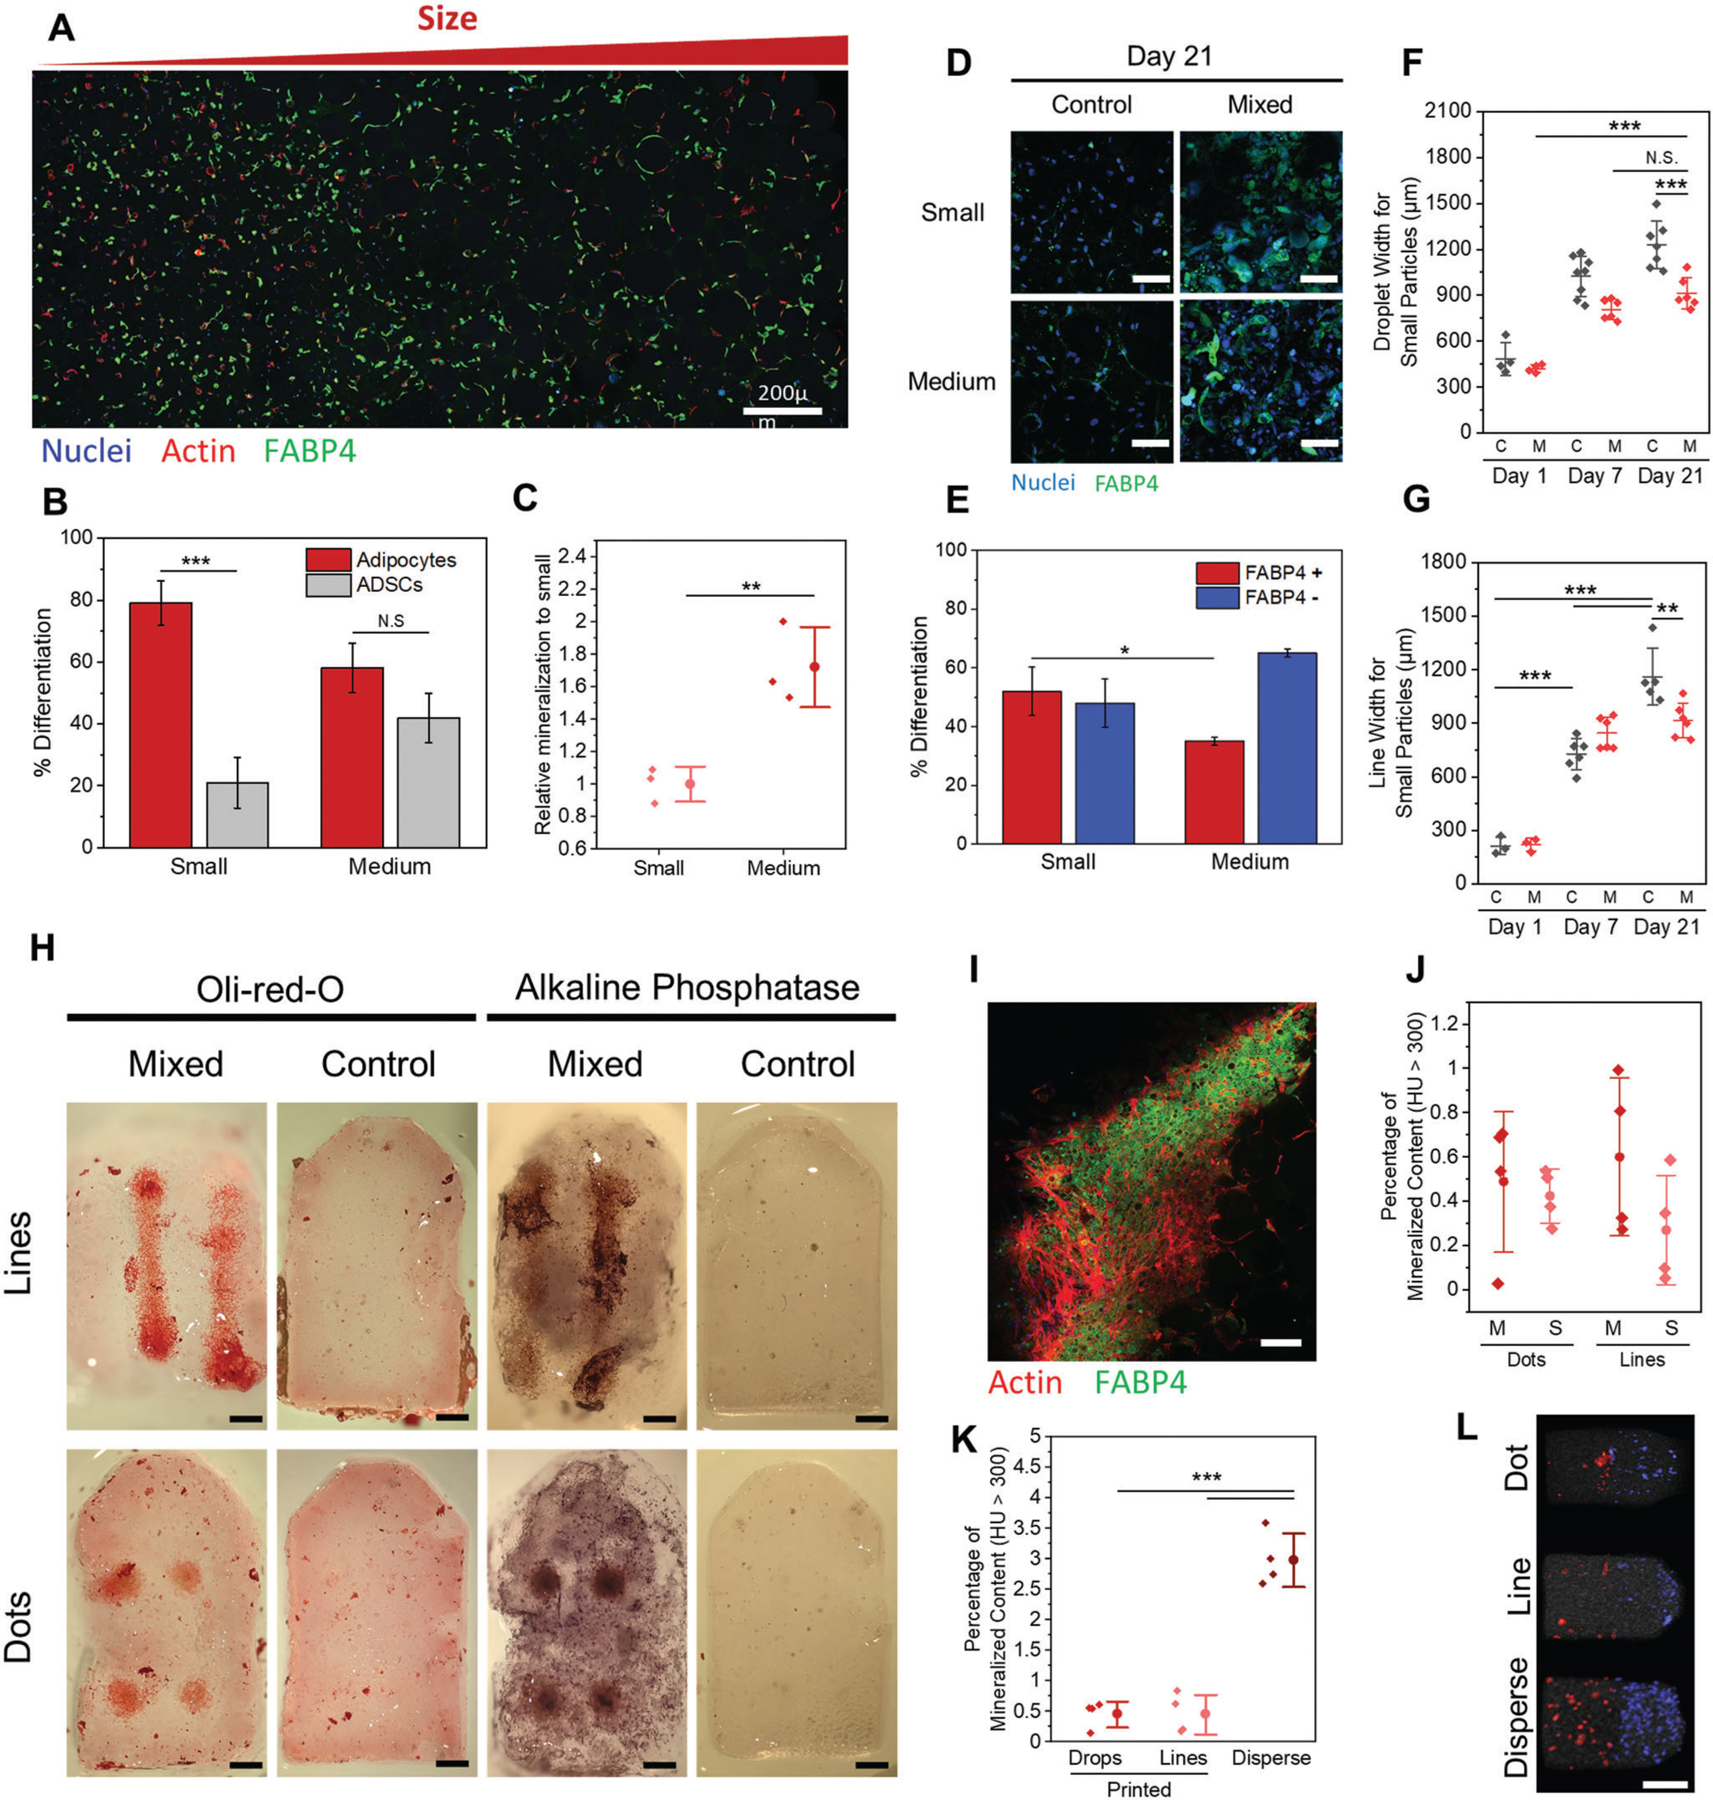
Differentiation of ADSCs within gradient microgel matrices. A) Confocal z-stack tile projection of ADSCs in a gradient microgel post 21 days in adipogenic media. B) Fraction of cells on each side of a gradient microgel that are adipocytes after 21 days in adipogenic media. C) Relative percentage of gel mineralization per side of gradient microgels exposed to osteogenic media for 21 days. D) Confocal image Z-stack projections of nuclear and FABP4 expression in small and medium microgel suspensions after 21 days in mixed media. E) Fraction of cells that are or are not expressing FABP4 after 21 days in mixed media. Printed cell droplet F) and line G) diameters after 1, 7, or 21 days in culture with control or mixed medium. H) Photographs of histology stains (Oil Red O and BCIP/NBT) on printed cell constructs within gradient microgel matrices (top side is small particles) that were in either control or mixed media for 21 days. I) Confocal z-stack zoom in projection image of a printed cell line after 21 days of culture in mixed media. J) Percentage of mineralized material in either side of printed cell gradient suspensions after 21 days in mixed media. K) Comparison of the percentage of mineralized gel for printed versus dispersed cells after 21 days in mixed media. L) MicroCT segmentation analysis for volume regions with a density higher than 300 Hounsfield values for the small (blue) and medium (red) particle halves of the gradient microgels after 21 days. Scale bars: 200 μm A), 50 μm D), 400 μm H), 100 μm I), and3 mm L). **P < 0.01, ***P < 0.001, ANOVA. Error bars represent s.d.
Finally, we aimed to differentiate printed cell constructs within the gradient microgel matrices. When looking at outgrowth of cell prints, there was a significant reduction in cell migration for the mixed media conditions when compared to the control growth media, for both lines and droplets as well as for conditions of medium and small microgel suspensions (Figure 8F,G; and Figures S17 and S18, Supporting Information). Under mixed media conditions, differentiation of printed constructs were verified first with Oil red O and alkaline phosphatase staining (Figure 8H). Significantly more alkaline phosphatase positive cells were seen throughout the matrix when compared to the Oil red O positive cells. Staining for the adipogenic marker FABP4 revealed dense clusters of FABP4 positive cells within the center of prints (Figure 8I). Additionally, when comparing the day 21 mineral content of each side of the gradient suspensions, there was a trend of increased mineralization in regions with medium microgels compared to small ones, but no significant difference was found (Figure 8I, P = 0.12). When comparing matrices with dispersed cells to those with printed cells at approximately equal cell numbers, the dispersed cell matrices have almost an order of magnitude more mineral content (Lines: 650% increase, droplets: 660% increase, P < 0.0001) (Figure 8K,L). It is important to note here that while initial cell numbers were roughly similar at day 0, it was not possible to perform accurate cell counts of the entire construct at the final time point, making it difficult to establish quantitative trends. Nevertheless, these data indicate that the more confined cells are predisposed to undergo adipogenic differentiation compared to osteogenic differentiation, while the reverse is true for microenvironments where cells are allowed to spread and elongate. There has been ample evidence in the literature supporting the role of confinement and cell density on MSC adipogenesis.[43] Our work supports these findings and provides an extension to how cell density influences differentiation in a biofabricated 3D matrix.
Early work using model systems demonstrated the importance of interfacial parameters—stiffness, ligand presentation, topography, and geometry—in directing cell adhesion and the development of cytoskeletal tension to steer MSC lineage specification.[69] In subsequent years, model systems have evolved into 3D platforms, with demonstrations of similar matrix structure-cell function relationships underlying cell lineage determination.[50,70,71] Huck and colleagues demonstrated how precisely controlling the 3D microenvironment can tune adhesion and mechanotransduction,[72] thereby directing corresponding lineage specification with high similar to early work with planar assays.[43,73] For instance, circular cells in 3D prefer adipogenesis while elongated cells prefer osteogensis. Similarly, in our work the periodic arrangement of microgels controls cell adhesion and morphometrics. Using large microgels without interstitial filler, cells gravitate to the microgel surface and elongate reminiscent of 2D adhesion, with corresponding preferential osteogenesis. In contrast, small microgels with interstitial filler promotes round cells with preferential adipogenesis. However, after prolonged culture and unrestricted growth in 3D, the cell shape characteristics normalize while maintaining the materials-directed bias in differentiation outcome. This is important because it highlights the importance of initial adhesion conditions in directing stem cell differentiation. As demonstrated by Yang et al. and Lee et al., initial adhesive conditions can trigger differentiation, and lineage-specific mechanical memory persists after changing the biophysical microenvironment.[70,74] Understanding how the properties of 3D matrices influence cellular processes at early timepoints is critical for the design of biofabricated constructs, to ensure the emergence of the desired lineage with spatiotemporal control.
3. Conclusions
We have presented a new method for creating gradient hydrogel biomaterials by combining granular microgel suspensions with different physical properties, with dispersed and 3D printed live cells. We demonstrated that microgel suspensions cause increased cell spreading and decreased sphericity in adipose derived stem cells as microgel size increased. When combined with adipogenic or osteogenic media, these initial cues dictate differentiation, where small suspensions promote adipogenesis and large suspensions promote osteogenesis. Tuning the interstitial filler content demonstrated soft filler enhances adipogenesis, while no filler facilitates fast adhesion and enhanced osteogenesis. Microgel size gradients were demonstrated with uniformly dispersed cells and high density 3D printed aggregates, where the microgel properties directed gradient differentiation outcomes. Overall, this platform provides hierarchical control over matrix properties, cell density and morphology, and associated differentiation within a tunable 3D suspension to direct in situ tissue assembly during biofabrication.
4. Experimental Section
GelMa Synthesis:
GelMa was synthesized as previously shown.[33] Briefly, type A gelatin from porcine skin (Bloom strength 300, Sigma-Aldrich) was dissolved to 10 w/v% in 1x PBS (pH 7.4) at 50 °C under stirring. Methacrylic anhydride was added (5 v/w% of the total mixture) and stirred for 90 min, while kept at 50 °C. The solution was then diluted twofold with PBS and centrifuged at 3000rcf (3 min) to pellet and remove excess methacrylic anhydride. The supernatant was then dialyzed with a 14 kDa cutoff at 40 °C for 5–7 days with daily water changes. The GelMa was then lyophilized for 5 days before long term storage at −20 °C.
GelMa Microparticle Synthesis:
| (1) |
Here, d is the mean particle diameter, and σ is the standard deviation of the mean. This index ranges from the values of 0–1 where a PDI of less than 0.1 is defined as monodisperse particles.
When hydrating the dried particles, the acetone was removed via evaporation. The microparticles were weighed and rehydrated with the following ratio of 1:22:8.7:0.6 for dried particles:1% GelMa solution:Pure cell media:Photocrosslinker (2.5 wt% LAP, Sigma-Aldrich, 900 889 (creates final concentration of 0.05 wt%)). After 24 h, the particles were fully hydrated and ready for use. To calculated void fraction, dried microgel particles (small, medium, or large) were rehydrated with 1X PBS and varied concentrations of 1% FITC-GelMa to form a jammed suspension. The solutions were allowed 24 h at room temperature to fully rehydrate. The gels were subsequently photocrosslinked and imaged on a confocal microscope (Zeiss LSM 800) using a 488 laser. Images were imported into ImageJ where thresholding was used to segregate the particles from the interstitial space. The area of particles in each image was then calculated and repeated across 3 other gels.
Gradient Gel Formations:
To make gradient gels, a plastic 3D printed mold was first placed onto a glass slide. For harsh gradients, two different hydrated microgel suspensions were pipetted onto either side of the mold until they meet in the middle. To aid in reproducibility, a divider was used to ensure that both solutions meet directly in the middle with equal volumes on either side of the divider. The divider is then pulled out and the molds are lightly tapped to connect both sides. A UV/Purple light flashlight with 395 nm (40 mW cm−2 at a height of 5 cm from the sample) was shined over the gels for 1 min to crosslink. For softer gradients, the same procedure was followed, but with mechanical agitation at the middle point to induce mixing. For more controlled gradient/deposition, one microgel suspension was pipetted into the mold completely, and the other was loaded into a 1 mL syringe with a 18G needle and place into a custom built bioprinter with a Replistruder head (Built from a Lulzbot mini-2)[25] (https://3dprint.nih.gov/discover/3dpx-009853). The printer was then used to deposited controlled volumes of microgel suspensions in desired locations. For colored gradient gel images for figure one, Createx fluorescent color paints were added into the hydrated microparticles for a final concentration on 0.1 wt%. A UV torch in a dark room was used to illuminate the paints.
Rheology:
Rheology measurements were performed on an Anton Paar MCR 302 Rheometer with a parallel plate geometry (25 mm Smooth Disk, 0.8–1 mm measuring distance). Shear strain rate sweeps were performed with a log ramp from 0.01 to 10 (1/s) shear rate over 6 min. Strain amplitude sweep tests were performed under oscillatory shear (frequency of 1 Hz) with a log ramp up rate from 0.2% to 200% shear strain over 8 min. For in situ UV crosslinking for the GelMa baths, Oscillatory measurements were performed with 0.02% strain and a 1 Hz frequency for the duration of gelation at 20 °C, and a UV light (with 395 nm UV light at 40 mW cm−2 for 60 s (starting at the 180 s time point)) was placed underneath to illuminate the sample through the quartz crystal stage. For the cold gel crosslinking, warm 10 wt% GelMa was placed onto the instrument, and then allowed to cool to 20 °C for 20 min before photocrosslinking with the same method as above.
Cell Culture and Seeding in Microgel Suspensions:
ADSCs were cultured with low glucose Dulbecco’s Modified Eagle Medium (DMEM) supplemented with 10% Fetal Bovine Serum (FBS) and 1% Penicillin/Streptomycin and 10 ng mL−1 FGF-2 (expansion media). All cultures were maintained at 37 °C, 5% CO2 and used between passages 5 and 8. For ADSCs seeding in the hydrogel matrices, the cells were detached with trypsin, counted, centrifuged down, and resuspended to 2 × 10⁷ cells mL−1. Cells were then added to prehydrated microgel suspensions (1:20 ratio for 1 million cells per mL final concentration) and mixed thoroughly via pipetting. 90 μL of cell loaded suspension was added to 2.5 × 6 × 6 mm plastic molds, and photocrosslinked with 395 nm light for 60 s. For all experiments, the gels were then placed in 24 well plates with 500 μL of control media (expansion media without FGF-2 added) and placed in the incubator overnight. Media changes for preliminary control media experiments were performed every 2–3 days, and gels were fixed with 4% Paraformaldehyde after 1, 3, or 7 days of culture. For glass controls, ADSCs were seeded on 18 mm glass coverslips in 12 well plates with 50 000 cells mL−1. For differentiation, all cell media was changed after the 24 h, and replaced with either more control media, StemPro Adipogenic differentiation media (Thermo Fisher Scientific, A1007001), StemPro Osteogenic differentiation media (Thermo Fisher Scientific, A1007201), or a 1:1 ratio of adipogenic and osteogenic media. Media changes for all samples were made on days 4, 7, 11, 14, and 17.
Immunofluorescence Staining and Tissue Culture:
Clearing solutions were prepared as done previously with slight modifications.[34,35] Briefly, Cubic solution 2 was prepared by mixing 50 wt% sucrose (Sigma-Aldrich, 584 173), 25 wt% urea, 10 wt% triethanolamine (Sigma-Aldrich, 90278–100 mL) with DI water at 55 °C until also fully dissolved. Microgel suspensions were fixed using a 4 wt% paraformaldehyde (PFA) (Chem-Supply) for 1–4 days at room temperature to ensure fully penetration of PFA into thick constructs. The gels were then rinsed with PBS followed by 3 PBS washes at 2–4 h intervals (standard washing procedure). A 0.5 wt% solution of Triton x-100 in DI water was added to the gels and allowed to sit at RT overnight. The gels were then rinsed with PBS followed by 3 washed with 3 wt% Bovine Serum Albumin (BSA) in PBS for blocking (2 h wash intervals). Primary antibody solutions were prepared in a 3 wt% BSA solution with the dilution factor in Table S1 (Supporting Information), and the solution was added to cells on a rocker overnight at room temperature. The gels were again rinsed and washed 3 times with 3 wt% BSA PBS. Then a secondary antibody solution was made with the addition of Hoechst (1:1000) and 488 or 647 Phalloidin (1:200). The staining was then added and kept overnight at room temperature under rocking. The gels were washed with PBS three final times before the addition of the Cubic 2 clearing solution for 2–5 days. All confocal imaging was performed with a Zeiss LSM 800. A 10x objective with a 2.5 mm working distance was used to see deeper into the samples. Samples were coated with clearing 2 solution throughout the duration for the imaging to prevent drying.
Cell Volume Segmentation Analysis and Cell Counting Analysis:
Confocal z-stacks (10x objective, 51 slices over 100 μm) were taken of representative regions in each gel. 1 z-stack was taken on each replicate. The images were imported in Imaris 9.5.1 for analysis. Cell segmentations were created using the Cell module with the phalloidin stain as the cell body and Hoechst for the cell nuclei. Each z-stack was analyzed using identical thresholding values per gel with each independent nucleus as a seed for the cells. Cell statistics from each of the three replicates were pooled together for total cell morphometric analysis.
Histological Staining:
Fixed samples were sliced with feather blades on a mold to widths of 200–300 μm. For Oil Red-O staining, a stock solution of Oil Red-O (3 mg mL−1) was prepared in 100% Isopropyl alcohol (IPA). A working solution of Oil Red-O was prepared by mixing 3 parts of the stock solution with 2 parts of DI water. After 20 min, the solution was filtered through a 0.22 μm filter.A 60 vol% solution of IPA in DI water was added to individual sample slices and allowed to incubate for 20 min. The IPA solution was then removed, and the working Oil Red-O solution was added over the gels and incubated for 30 min at room temp. The Oil Red-O was removed and then the samples were washed with DI water 5–7 times. Samples were then imaged under brightfield with a 10x objective.
For alkaline phosphatase activity (ALK), a BCIP/NBT tablet (Sigma-Aldrich, B5655) was dissolved in DI water via sonication. The BCIP/NBT solution was then added on top of microgel slices and allowed to incubate for 18 h. The gels were subsequently washed with DI water 5 times before imaging on a brightfield microscope with a 10x objective. For printed cells histology, images were instead taken with a Leica Macroscope and a phone camera (Pixel 4a).
RNA Isolation and Real-Time PCR:
To extract cellular RNA, the day 14 microgels were first rinsed twice with PBS and then placed into a cell culture incubator for 40 min to exact excess media. The gels were immediately snap frozen in liquid nitrogen and crushed into a powder with still frozen in a cold mortar and pestle. RNA was then extracted from the tissue powder using a RNeasy plant mini kit (Qiagen, 74 903) as per instructions. cDNA preparation was performed using the High-Capacity cDNA Reverse Transcription Kit (Applied Biosystems, 4 368 814) kit. The cDNA was added to the TaqMan Real-Time PCR Master mix (Applied Biosystems, 4 304 437) with the necessarily primer (list found in Table S2, Supporting Information) and added to wells of a fast 96 well plate (10 ng of cDNA per test, 20 μL solution volume). The qPCR program was run on a QuantStudio 7 Flex Real-Time PCR System (Applied Biosystems 4 485 701). The software generated automatic CT values per replicate which were then converted into ΔΔCT values using Glyceraldehyde 3-phosphate dehydrogenase (GAPDH) as the internal control. Three biological replicates were used for statistical analysis.
MicroCT and Mineral Volume Segmentation:
The gels were sealed in parafilm and placed on the mouse holder for MicroCT imaging. MicroCT images for the gels were acquired at 50 KV, 0.24 mA, 75 ms exposure, 360°, and 720 projections with the Milabs U-CT scanner (Houten, Netherlands) under mouse total body accurate settings. The images were reconstructed with Milabs.Rec 10.16 software at 30 μm voxel size. The MicroCT data were analyzed with Inveon Research Workplace 4.2 (Siemens, Australia). Dicom data was loaded into the Multimodal 3D visualization module and segmented manually. The extent of calcification with Hounsfield unit (HU) greater than 300 or 1000 was applied to each gel and the volume and surface area computed with the statistics function.
Scanning Electron Microscopy (SEM) and Energy Dispersive X-Ray Analysis (EDX):
Fixed mineralized samples were air dried at 40 °C until no water remained. The samples were subsequently fixed to aluminum stubs with adhesive carbon discs. The samples and stubs were then sputter coated once with platinum (Emitech K575x Pt sputter coater). A Hitachi S3400 (7–10 kV, probe current of 40) scanning electron microscope was used for all imaging. For EDX measurements, the probe current was bumped to 60 and 15 kV was used to increase the electron counts.
Compression Testing:
The compression tests were performed on a universal testing instrument (ElectroPlus E1000, Instron) with a 250 N load cell (Instron). The test speed was 5 mm min−1, and the samples were compressed to 25% strain. Engineering stress–strain curves were presented after tests. The strain and stress were calculated using the two equations and , where ho and Ao were the original height and cross-sectional area of the uncompressed sample, ∆h was the change in height, F was the applied force. The compressive modulus was defined as the ratio of stress to strain in the initial compression region and was determined using the average slope of fitting line within 5–10% strain region.
Bioprinting ADSCs:
ADSCs were treated with trypsin, centrifuged, washed, and then pelleted. The cell pellets were lightly broken up via pipetting up and down, and care was taken to not introduce air bubbles. The pellet was then pulled into a 1 mL syringe (Livingston), and the syringe was loaded directly into a 3D printed fitting on the bioprinter. The desired syringe needle was then primed with cell solution and printed into molds filled with a microgel suspension. The samples were then UV crosslinked and subsequently treated identically bulk cell laden microgels. All GCODE used can be found at this repository: https://github.com/tmolley2/Gradient-Microgels
Fidelity of Cell Prints:
Once printed, the microgels were either immediately fixed with 4% PFA, or they were cultured for 7 days. The gels were washed 3 times in PBS and stained with Hoechst and Phalloidin before z-stack tile scans of the gels were taken. Analysis was performed in ImageJ. First, the z-stacks were projected into one slice with using the maximum brightness. The images were then thresholded in the phalloidin channel to outline the lines, followed by 8 length measurements taken across the length of the cell lines.
Statistical Analysis:
All whiskers in box plots are one standard deviation (s.d.). Statistical significance was determined using a one-way ANOVA with Tukey’s Post Hoc HSD analysis with a 0.05 alpha using Origin Pro 2020b. A sample size of 100 particles was used for particle size. For all cell morphometrics, triplicate, or quadruplicate samples were used and the morphometrics of at least 200 individual cells was pooled across the replicates. In addition, Levene’s test was performed to check for normality of cell morphometrics prior to running ANOVA with a Tukey’s post hoc test. All Mineralization samples were done in triplicate or quadruplicate, and all PCR was performed with 3 biological replicates. Fractions of positive cells form confocal was performed by averaging positive cells in z-stacks of 100 μm with three replicates. For compression testing, 6 samples were used for day 6, and 3 for each day 21 condition. A population size of 8–12 was used when calculating 3D printing fidelity statistics. For PCR tests, the expression was normalized to the control sample for each relative group. For cell fraction counting, z-stack projections were performed on the z-stack prior to counting. Differences were considered significant when P < 0.05. Statistical significance was highlighted in figures with the following convention: * = P < 0.05; ** = P < 0.01; *** = P < 0.001, **** = P < 0.001.
Supplementary Material
Acknowledgements
This work was supported through funding from the National Health and Medical Research Council Grant No. APP1185021. The authors acknowledge the help and support of staff at the Katharina Gaus Light Microscopy Facility and the Biological Specimen Preparation Laboratory of the UNSW Mark Wainwright Analytical Centre. The authors also acknowledge the facilities, and the scientific and technical assistance of the UNSW node of the National Imaging Facility.
Footnotes
Supporting Information
Supporting Information is available from the Wiley Online Library or from the author.
Conflict of Interest
The authors declare no conflict of interest.
Contributor Information
Thomas G. Molley, School of Materials Science and Engineering, University of New South Wales, Sydney, NSW 2052, Australia; Australian Centre for NanoMedicine, University of New South Wales, Sydney, NSW 2052, Australia
Tzong-tyng Hung, Biological Resources Imaging Laboratory, Mark Wainwright Analytical Centre, University of New South Wales, Sydney, NSW 2052, Australia.
Kristopher A. Kilian, School of Materials Science and Engineering, University of New South Wales, Sydney, NSW 2052, Australia; Australian Centre for NanoMedicine, University of New South Wales, Sydney, NSW 2052, Australia; School of Chemistry, University of New South Wales, Sydney, NSW 2052, Australia
Data Availability Statement
The data that support the findings of this study are available from the corresponding author upon reasonable request.
References
- [1].Grigoryan B, Paulsen SJ, Corbett DC, Sazer DW, Fortin CL, Zaita AJ, Greenfield PT, Calafat NJ, Gounley JP, Ta AH, Johansson F, Randles A, Rosenkrantz JE, Louis-Rosenberg JD, Galie PA, Stevens KR, Miller JS, Science 2019, 364, 458. [DOI] [PMC free article] [PubMed] [Google Scholar]
- [2].Kolesky DB, Homan KA, Skylar-Scott MA, Lewis JA, Proc. Natl. Acad. Sci. USA 2016, 113, 3179. [DOI] [PMC free article] [PubMed] [Google Scholar]
- [3].Miller JS, Stevens KR, Yang MT, Baker BM, Nguyen D-HT, Cohen DM, Toro E, Chen AA, Galie PA, Yu X, Chaturvedi R, Bhatia SN, Chen CS, Nat. Mater 2012, 11, 768. [DOI] [PMC free article] [PubMed] [Google Scholar]
- [4].Lee A, Hudson AR, Shiwarski DJ, Tashman JW, Hinton TJ, Yerneni S, Bliley JM, Campbell PG, Feinberg AW, Science 2019, 365, 482. [DOI] [PubMed] [Google Scholar]
- [5].Perez-Castillejos R, Mater. Today 2010, 13, 32. [Google Scholar]
- [6].Naftulin JS, Kimchi EY, Cash SS, PLoS One 2015, 10, e0136198. [DOI] [PMC free article] [PubMed] [Google Scholar]
- [7].Nikolaev M, Mitrofanova O, Broguiere N, Geraldo S, Dutta D, Tabata Y, Elci B, Brandenberg N, Kolotuev I, Gjorevski N, Clevers H, Lutolf MP, Nature 2020, 585, 574. [DOI] [PubMed] [Google Scholar]
- [8].Lancaster MA, Renner M, Martin C-A, Wenzel D, Bicknell LS, Hurles ME, Homfray T, Penninger JM, Jackson AP, Knoblich JA, Nature 2013, 501, 373. [DOI] [PMC free article] [PubMed] [Google Scholar]
- [9].Fatehullah A, Tan SH, Barker N, Nat. Cell Biol 2016, 18, 246. [DOI] [PubMed] [Google Scholar]
- [10].Wang S, Ghezzi CE, Gomes R, Pollard RE, Funderburgh JL, Kaplan DL, Biomaterials 2017, 112, 1. [DOI] [PMC free article] [PubMed] [Google Scholar]
- [11].Loffet E, Brossard L, Mahe MM, Methods Cell Biol 2020, 159, 175. [DOI] [PubMed] [Google Scholar]
- [12].Nishida K, Yamato M, Hayashida Y, Watanabe K, Yamamoto K, Adachi E, Nagai S, Kikuchi A, Maeda N, Watanabe H, Okano T, Tano Y, Engl N J. Med 2004, 351, 1187. [DOI] [PubMed] [Google Scholar]
- [13].Horner CB, Maldonado M, Tai Y, K Rony RMI, Nam J, ACS Appl. Mater. Interfaces 2019, 11, 45479. [DOI] [PubMed] [Google Scholar]
- [14].Warmflash A, Sorre B, Etoc F, Siggia ED, Brivanlou AH, Nat. Methods 2014, 11, 847. [DOI] [PMC free article] [PubMed] [Google Scholar]
- [15].Li C, Ouyang L, Armstrong JPK, Stevens MM, Trends Biotechnol 2021, 39, 150. [DOI] [PubMed] [Google Scholar]
- [16].Jo H, Yoon M, Gajendiran M, Kim K, Macromol. Biosci 2020, 20, 1900300. [DOI] [PubMed] [Google Scholar]
- [17].Hadden WJ, Young JL, Holle AW, Mcfetridge ML, Y Kim D, Wijesinghe P, Taylor-Weiner H, Wen JH, Lee AR, Bieback K, Vo B-N, Sampson DD, Kennedy BF, Spatz JP, Engler AJ, Choi YS, Proc. Natl. Acad. Sci. USA 2017, 114, 5647. [DOI] [PMC free article] [PubMed] [Google Scholar]
- [18].Soliman BG, Major GS, Atienza-Roca P, Murphy CA, Longoni A, Alcala-Orozco CR, Rnjak-Kovacina J, Gawlitta D, Woodfield TBF, Lim KS, Adv. Healthcare Mater 2021, 11, 2101873. [DOI] [PubMed] [Google Scholar]
- [19].Griffin DR, Weaver WM, Scumpia PO, Di Carlo D, Segura T, Nat. Mater 2015, 14, 737. [DOI] [PMC free article] [PubMed] [Google Scholar]
- [20].Sideris E, Griffin DR, Ding Y, Li S, Weaver WM, Di Carlo D, Hsiai T, Segura T, ACS Biomater. Sci. Eng 2016, 2, 2034. [DOI] [PubMed] [Google Scholar]
- [21].Daly AC, Riley L, Segura T, Burdick JA, Nat. Rev. Mater 2020, 5, 20. [DOI] [PMC free article] [PubMed] [Google Scholar]
- [22].Qazi TH, Wu J, Muir VG, Weintraub S, Gullbrand SE, Lee D, Issadore D, Burdick JA, Adv. Mater 2022, 34, 2109194. [DOI] [PMC free article] [PubMed] [Google Scholar]
- [23].Sheikhi A, De Rutte J, Haghniaz R, Akouissi O, Sohrabi A, Di Carlo D, Khademhosseini A, Biomaterials 2019, 192, 560. [DOI] [PMC free article] [PubMed] [Google Scholar]
- [24].Romanazzo S, Molley TG, Nemec S, Lin K, Sheikh R, Gooding JJ, Wan B, Li Q, Kilian KA, Roohani I, Adv. Funct. Mater 2021, 31, 2008216. [Google Scholar]
- [25].Molley TG, Jalandhra GK, Nemec SR, Tiffany AS, Patkunarajah A, Poole K, Harley BAC, Hung T-T, Kilian KA, Biomater. Sci 2021, 9, 4496. [DOI] [PMC free article] [PubMed] [Google Scholar]
- [26].De Rutte JM, Koh J, Di Carlo D, Adv. Funct. Mater 2019, 29, 1900071. [Google Scholar]
- [27].Bhattacharjee T, Zehnder SM, Rowe KG, Jain S, Nixon RM, Sawyer WG, Angelini TE, Sci. Adv 2015, 1, e150065. [DOI] [PMC free article] [PubMed] [Google Scholar]
- [28].Hinton TJ, Jallerat Q, Palchesko RN, Park JH, Grodzicki MS, Shue H-J, Ramadan MH, Hudson AR, Feinberg AW, Sci. Adv 2015, 1, e1500758. [DOI] [PMC free article] [PubMed] [Google Scholar]
- [29].Skylar-Scott MA, Uzel SGM, Nam LL, Ahrens JH, Truby RL, Damaraju S, Lewis JA, Sci. Adv 2019, 5, eaaw2459. [DOI] [PMC free article] [PubMed] [Google Scholar]
- [30].Jeon O, Lee YB, Jeong H, Lee SJ, Wells D, Alsberg E, Mater. Horiz 2019, 6, 1625. [DOI] [PMC free article] [PubMed] [Google Scholar]
- [31].Hayashi K, Tabata Y, Acta Biomater 2011, 7, 2797. [DOI] [PubMed] [Google Scholar]
- [32].Sung B, Krieger J, Yu B, Kim MH, J. Biomed. Mater. Res., Part A 2018, 106, 2753. [DOI] [PubMed] [Google Scholar]
- [33].Loessner D, Meinert C, Kaemmerer E, Martine LC, Yue K, Levett PA, Klein TJ, Melchels FPW, Khademhosseini A, Hutmacher DW, Nat. Protoc 2016, 11, 727. [DOI] [PubMed] [Google Scholar]
- [34].Molley TG, Wang X, Hung T.-t., Jayathilaka PB, Yang J-L, Kilian KA, Adv. Biosyst 2020, 4, 2000056. [DOI] [PubMed] [Google Scholar]
- [35].Susaki EA, Tainaka K, Perrin D, Kishino F, Tawara T, Watanabe TM, Yokoyama C, Onoe H, Eguchi M, Yamaguchi S, Abe T, Kiyonari H, Shimizu Y, Miyawaki A, Yokota H, Ueda HR, Cell 2014, 157, 726. [DOI] [PubMed] [Google Scholar]
- [36].Nour AH, Int. J. Res. Eng. Technol 2014, 3, 2321. [Google Scholar]
- [37].Aravand MA, Semsarzadeh MA, Macromol. Symp 2008, 274, 141. [Google Scholar]
- [38].Hsu RS, Chen PY, Fang JH, Chen YY, Chang CW, Lu YJ, Hu SH, Adv. Sci 2019, 6, 1900520. [DOI] [PMC free article] [PubMed] [Google Scholar]
- [39].Muir VG, Qazi TH, Shan J, Groll J, Burdick JA, ACS Biomater. Sci. Eng 2021, 7, 4269. [DOI] [PMC free article] [PubMed] [Google Scholar]
- [40].Truong NF, Kurt E, Tahmizyan N, Lesher-Pérez SC, Chen M, Darling NJ, Xi W, Segura T, Acta Biomater 2019, 94, 160. [DOI] [PMC free article] [PubMed] [Google Scholar]
- [41].Skylar-Scott MA, Mueller J, Visser CW, Lewis JA, Nature 2019, 575, 330. [DOI] [PubMed] [Google Scholar]
- [42].Song W, Lu H, Kawazoe N, Chen G, Langmuir 2011, 27, 6155. [DOI] [PubMed] [Google Scholar]
- [43].Mcbeath R, Pirone DM, Nelson CM, Bhadriraju K, Chen CS, Dev. Cell 2004, 6, 483. [DOI] [PubMed] [Google Scholar]
- [44].Gao L, Mcbeath R, Chen CS, Stem Cells 2010, 28, 564. [DOI] [PMC free article] [PubMed] [Google Scholar]
- [45].Chen Q, Shou P, Zheng C, Jiang M, Cao G, Yang Q, Cao J, Xie N, Velletri T, Zhang X, Xu C, Zhang L, Yang H, Hou J, Wang Y, Shi Y, Cell Death Differ 2016, 23, 1128. [DOI] [PMC free article] [PubMed] [Google Scholar]
- [46].Oliver-De La Cruz J, Nardone G, Vrbsky J, Pompeiano A, Perestrelo AR, Capradossi F, Melajovãj KN, Filipensky P, Forte G, Biomaterials 2019, 205, 64. [DOI] [PubMed] [Google Scholar]
- [47].Nathan AS, Baker BM, Nerurkar NL, Mauck RL, Acta Biomater 2011, 7, 57. [DOI] [PMC free article] [PubMed] [Google Scholar]
- [48].Thomas CH, Collier JH, Sfeir CS, Healy KE, Proc. Natl. Acad. Sci. USA 2002, 99, 1972. [DOI] [PMC free article] [PubMed] [Google Scholar]
- [49].Stachecka J, Walczak A, Kociucka B, Ruszczycki B, Wilczyński G, Szczerbal I, Histochem. Cell Biol 2018, 149, 113. [DOI] [PubMed] [Google Scholar]
- [50].Huebsch N, Arany PR, Mao AS, Shvartsman D, Ali OA, Bencherif SA, Rivera-Feliciano J, Mooney DJ, Nat. Mater 2010, 9, 518. [DOI] [PMC free article] [PubMed] [Google Scholar]
- [51].Furuhashi M, Saitoh S, Shimamoto K, Miura T, Clin. Med. Insights Cardiol 2014, 8, 23. [DOI] [PMC free article] [PubMed] [Google Scholar]
- [52].Liu L, Liu H, Chen M, Ren S, Cheng P, Zhang H, Sci. Rep 2017, 7, 1160. [DOI] [PMC free article] [PubMed] [Google Scholar]
- [53].Aldridge A, Kouroupis D, Churchman S, English A, Ingham E, Jones E, Cytotherapy 2013, 15, 89. [DOI] [PMC free article] [PubMed] [Google Scholar]
- [54].Adler RA, Osteoporosis: Pathophysiology and Clinical Management, Humana Press, Totowa, NJ: 2010, 1. 10.1007/978-1-59745-459-9. [DOI] [Google Scholar]
- [55].Teyssier C, Gallet MN, Rabier BD, Monfoulet L, Dine J, Macari C, Espallergues J, Horard BA, Giguère V, Cohen-Solal M, Chassande O, Vanacker J-M, PLoS One 2009, 4, e7942. [DOI] [PMC free article] [PubMed] [Google Scholar]
- [56].Shao D, Lu M, Xu D, Zheng X, Pan Y, Song Y, Xu J, Li M, Zhang M, Li J, Chi G, Chen L, Yang B, Biomater. Sci 2017, 5, 1820. [DOI] [PubMed] [Google Scholar]
- [57].Lee MS, Lee DH, Jeon J, Oh SH, Yang HS, ACS Appl. Mater. Interfaces 2018, 10, 38780. [DOI] [PubMed] [Google Scholar]
- [58].Murshed M, Cold Spring Harbor Perspect. Med 2018, 8, a031229. [DOI] [PMC free article] [PubMed] [Google Scholar]
- [59].Ficai A, Andronescu E, Voicu G, Ghitulica C, Vasile BS, Ficai D, Trandafir V, Chem. Eng. J 2010, 160, 794. [Google Scholar]
- [60].Lian K, Lu H, Guo X, Cui F, Qiu Z, Xu S, Biomatter 2013, 3, e27250. [DOI] [PMC free article] [PubMed] [Google Scholar]
- [61].Bleek K, Taubert A, Acta Biomater 2013, 9, 6283. [DOI] [PubMed] [Google Scholar]
- [62].Zhou L, Tan G, Tan Y, Wang H, Liao J, Ning C, RSC Adv 2014, 4, 21997. [Google Scholar]
- [63].Engler AJ, Sen S, L Sweeney H, Discher DE, Cell 2006, 126, 677. [DOI] [PubMed] [Google Scholar]
- [64].Li CX, Talele NP, Boo S, Koehler A, Knee-Walden E, Balestrini JL, Speight P, Kapus A, Hinz B, Nat. Mater 2016, 16, 379. [DOI] [PubMed] [Google Scholar]
- [65].Reilly GC, Engler AJ, J. Biomech 2010, 43, 55. [DOI] [PubMed] [Google Scholar]
- [66].Maharam E, Yaport M, Villanueva NL, Akinyibi T, Laudier D, He Z, Leong DJ, Sun HB, Bone Res 2015, 3, 15015. [DOI] [PMC free article] [PubMed] [Google Scholar]
- [67].Ma Y, Lin M, Huang G, Li Y, Wang S, Bai G, Lu TJ, Xu F, Adv. Mater 2018, 30, 1705911. [DOI] [PubMed] [Google Scholar]
- [68].Ahn EH, Kim Y, Kshitiz S. S. An, Afzal J, Lee S, Kwak M, Suh K-Y, Kim D-H, Levchenko A, Biomaterials 2014, 35, 2401. [DOI] [PMC free article] [PubMed] [Google Scholar]
- [69].Nemec S, Kilian KA, Nat. Rev. Mater 2021, 6, 69. [Google Scholar]
- [70].Lee J, Abdeen AA, Kilian KA, Sci. Rep 2014, 4, 5188. [DOI] [PMC free article] [PubMed] [Google Scholar]
- [71].Ma Y, Neubauer MP, Thiele J, Fery A, Huck WTS, Biomater. Sci 2014, 2, 1661. [DOI] [PubMed] [Google Scholar]
- [72].Bao M, Xie J, Piruska A, Huck WTS, Nat. Commun 2017, 8, 1962. [DOI] [PMC free article] [PubMed] [Google Scholar]
- [73].Kilian KA, Bugarija B, Lahn BT, Mrksich M, Proc. Natl. Acad. Sci. USA 2010, 107, 4872. [DOI] [PMC free article] [PubMed] [Google Scholar]
- [74].Yang C, Tibbitt MW, Basta L, Anseth KS, Nat. Mater 2014, 13, 645. [DOI] [PMC free article] [PubMed] [Google Scholar]
Associated Data
This section collects any data citations, data availability statements, or supplementary materials included in this article.
Supplementary Materials
Data Availability Statement
The data that support the findings of this study are available from the corresponding author upon reasonable request.