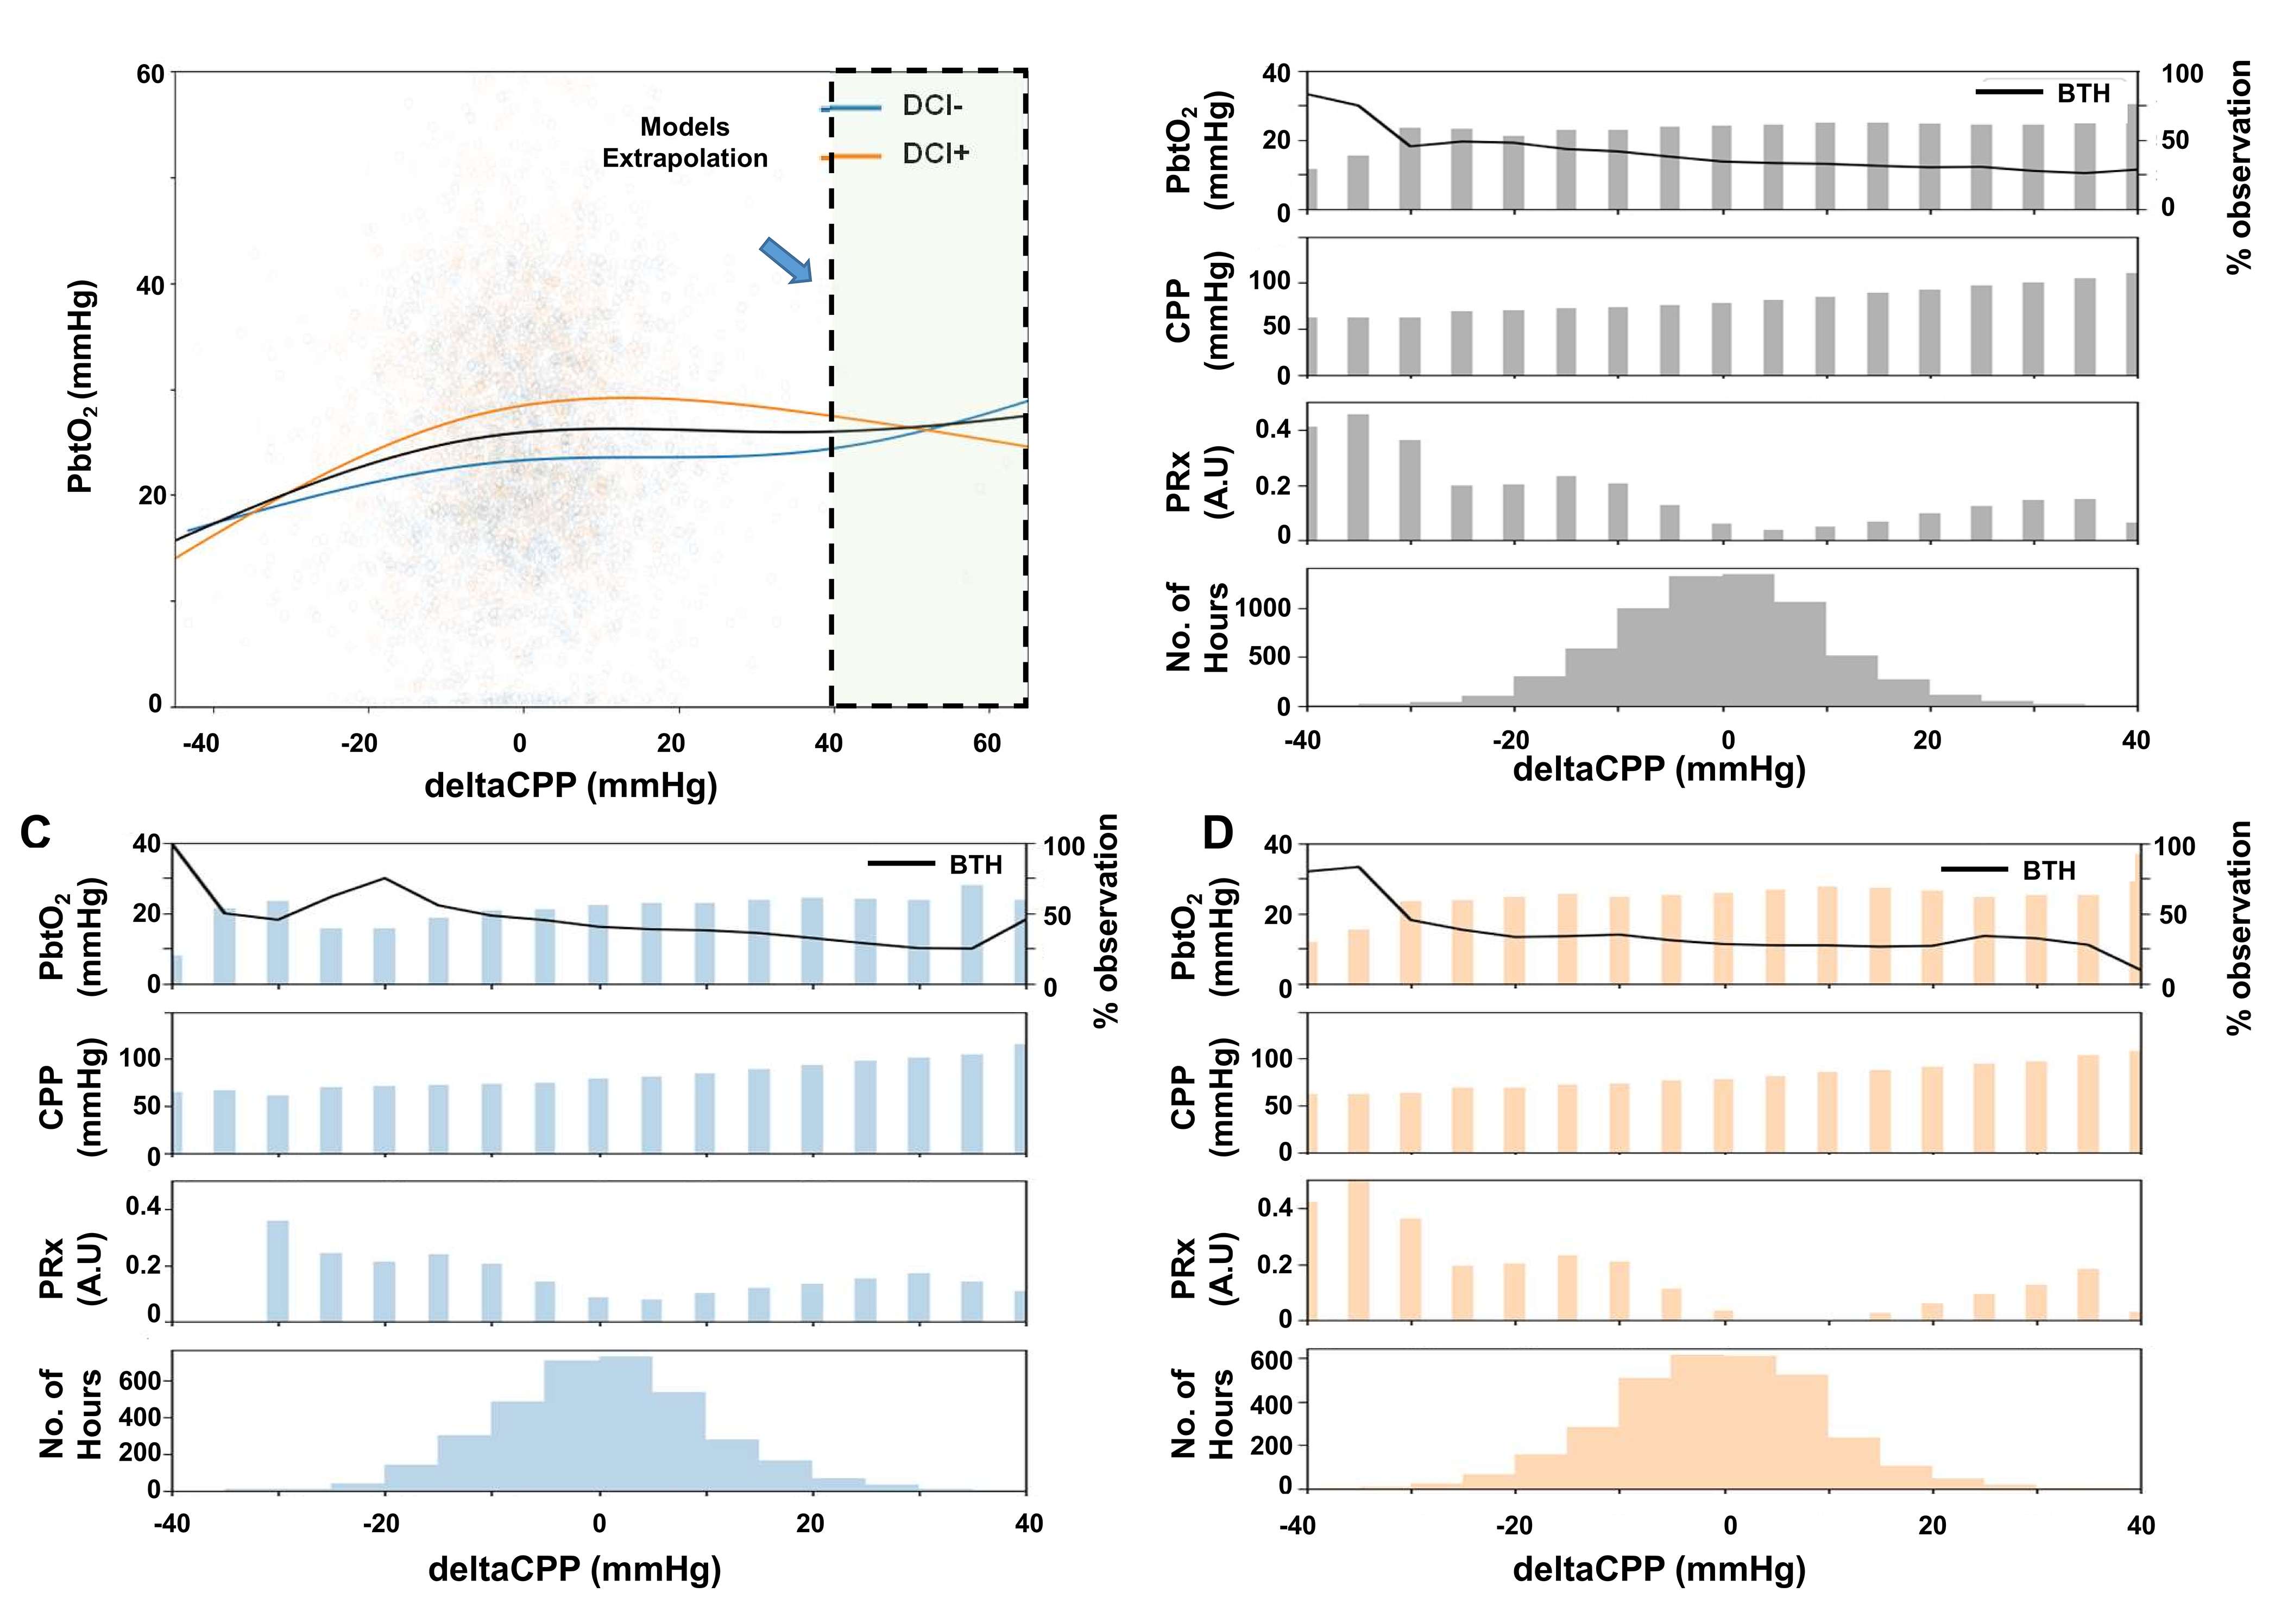
Figure 1.

The relationship between PbtO2 and deltaCPP. A: Natural spline regression analysis of hourly deltaCPP and PbtO2 pairs. B: PbtO2, CPP, PRx values and data availability separated by 5mmHg deltaCPP bins. Black line indicates the proportion of brain tissue hypoxia (BTH) from all measurements within a bin. C+D: Data separated by patients without DCI (C) or with (D) DCI.
