

Abstract
Introduction
To determine whether a pelvis is wide enough for spontaneous delivery has long been the subject of obstetric research. A number of variables have been proposed as predictors, all with limited accuracy. In this study, we use a novel three‐dimensional (3D) method to measure the female pelvis and assess which pelvic features influence birth mode. We compare the 3D pelvic morphology of women who delivered vaginally, women who had cesarean sections, and nulliparous women. The aim of this study is to identify differences in pelvic morphology between these groups.
Material and methods
This observational study included women aged 50 years and older who underwent a CT scan of the pelvis for any medical indication. We recorded biometric data including height, weight, and age, and obtained the obstetric history. The bony pelvis was extracted from the CT scans and reconstructed in three dimensions. By placing 274 landmarks on each surface model, the pelvises were measured in detail. The pelvic inlet was measured using 32 landmarks. The trial was registered at the German Clinical Trials Register DRKS (DRKS00017690).
Results
For this study, 206 women were screened. Exclusion criteria were foreign material in the bony pelvis, unknown birth mode, and exclusively preterm births. Women who had both a vaginal birth and a cesarean section were excluded from the group comparison. We compared the pelvises of 177 women between three groups divided by obstetric history: vaginal births only (n = 118), cesarean sections only (n = 21), and nulliparous women (n = 38). The inlet area was significantly smaller in the cesarean section group (mean = 126.3 cm2) compared with the vaginal birth group (mean = 134.9 cm2, p = 0.002). The nulliparous women were used as a control group: there was no statistically significant difference in pelvic inlet area between the nulliparous and vaginal birth groups.
Conclusions
By placing 274 landmarks on a pelvis reconstructed in 3D, a very precise measurement of the morphology of the pelvis is possible. We identified a significant difference in pelvic inlet area between women with vaginal delivery and those with cesarean section. A unique feature of this study is the method of measurement of the bony pelvis that goes beyond linear distance measurements as used in previous pelvimetric studies.
Keywords: birth mode, female pelvic morphology, fetopelvic disproportion, geometric morphometrics, pelvic inlet area, pelvimetry
Women who delivered by cesarean section have a significantly smaller pelvic inlet area. With this 3D measurement method, not only distances at the pelvic inlet but the complete three‐dimensional pelvic morphology can be recorded.

Abbreviations
- CS
cesarean section
- 3D
three‐dimensional
- CT
computed tomography
- MRI
magnetic resonance imaging
Key message.
Women who delivered by cesarean section have a significantly smaller pelvic inlet area. With this 3D measurement method, not only distances at the pelvic inlet but the complete 3D pelvic morphology can be recorded.
1. INTRODUCTION
Researchers in obstetrics have long been trying to predict the probability of cesarean section in individual women and to determine whether a woman's pelvis is sufficiently spacious for vaginal delivery. Several predictors have been proposed in the obstetric literature, including maternal stature and even maternal shoe size, parental height difference, maternal body mass index (BMI), maternal age, estimated fetal weight, fetal abdominal circumference, and fetal head circumference. 1 , 2 , 3 , 4 , 5 A recent Cochrane review concluded that further research is needed to demonstrate whether pelvimetry is useful in predicting fetopelvic disproportion. 6 Existing studies report limited diagnostic accuracy of biometric predictors and pelvimetric indices, implying that it is unclear to what extent morphological features of the maternal body in general and the mother's bony pelvis in particular can predict the risk for cesarean section.
Pelvimetry, the measurement of the maternal pelvis, is traditionally performed by measuring a series of linear distances in the maternal birth canal. Pelvic measurements can be acquired either by clinical examination or by conventional X‐ray imaging, which produces a two‐dimensional (2D) projection of the pelvis. Alternatively, computed tomography (CT) or magnetic resonance imaging (MRI) producing three‐dimensional (3D) images of the pelvis can be used for subsequent measurement. 2 , 7 , 8 , 9 , 10 , 11 , 12 Outside research studies, pelvimetry plays a minor role in clinical practice. When applied, it is usually used in non‐standard situations, such as before a planned vaginal breech delivery. 9 , 12 However, recent global efforts to reduce cesarean section rates have brought pelvimetry back into the research spotlight.
In this study, we used a novel 3D method to measure the female pelvis. We analyzed the differences in 3D pelvic morphology between groups of women divided by obstetric history: vaginal birth vs cesarean section and nulliparous women as a control group. We applied tools from geometric morphometrics to measure female pelvic morphology by acquiring a dense set of 3D landmark coordinates on surface models of bony pelvises exported from CT scans of women. We then compared the pelvic morphology of women who delivered vaginally, women who had a cesarean section, and nulliparous women. The group of nulliparous women was used as a control group and we expected them to be a mixture of the other two groups in terms of their pelvic shape and size. The aim of this study was to identify differences in 3D pelvic morphology between these groups.
2. MATERIAL AND METHODS
2.1. Study design and recruitment
A total of 206 women aged 50 years and older who underwent CT with a complete imaging of the bony pelvis for any medical indication participated in the study between December 2019 and November 2020.
Study participants completed a detailed obstetric questionnaire and consented to the use of the CT data set in this study. Standard biometric data such as height, body weight, and age were recorded. Obstetric data including number of infants born, incidence of stillbirth, date of delivery, duration of pregnancy, mode of delivery (vaginal delivery, vacuum extraction, forceps delivery, or cesarean section), indication for mode of delivery, and neonatal weight and height were collected by questionnaire. We subsequently completed this information by contacting patients individually by telephone after their CT appointment and asking them to look up missing variables in written records (pediatric examination booklet, maternity record), if available.
Exclusion criteria were injuries and foreign material in the pelvic bone region, as this affects the quality of the CT images. Women who could not adequately answer the questionnaire because of a language barrier or dementia were not included.
All data were collected on questionnaires and transferred to a spreadsheet (excel, Microsoft). For data analysis, patient names were replaced with anonymized IDs.
2.2. CT scans, 3D reconstruction, and measurement of the bony pelvis
The CT scans were acquired on spiral CT scanners with routine abdominal protocols in the venous phase after intravenous application of contrast; 64‐slice CT scanners (Siemens Somatom Volume Zoom, Sensation 64) were used. Images were reconstructed with a slice thickness of 3 mm and incremented with a standard medium‐soft convolution kernel. Women were not exposed to radiation for study purposes. All examinations were performed based on an existing medical indication independent of this research study.
3D slicer, an image processing software, was used to visualize the CT images. The bony pelvis was segmented semi‐automatically from the scans by setting a global threshold for gray intensity that corresponded to the boundary between bone and soft tissue, and this threshold was applied to each CT scan. Automatic segmentation was supplemented by manual segmentation at the acetabulum to remove the femoral head, and at the sacrum and coccyx where adjacent bone and remaining soft tissue had to be manually removed. The resulting surface models of the pelvis were exported as stl‐files. In a next step, 3D landmarks were measured on these surface models using the software checkpoint.
Our landmark scheme consisted of 274 3D landmarks per pelvis, measured on each surface model (Figure 1A). This scheme was modified according to Reynolds and Young, 13 Fischer and Mitteroecker 26 and Waltenberger et al. 14 The list of landmark points and their descriptions are included in Table S1. Of these 274 points, 83 were anatomical landmarks and 191 were curve semi‐landmarks, which were placed along bony edges of the pelvis such as the pelvic inlet, iliac crest, ischial tuberosity, and obturator foramen. Very few landmarks (0.8% of all landmarks) could not be measured on some of the women's pelvises. These were imputed by thin‐plate spline interpolation of the mean pelvis shape of the sample.
FIGURE 1.

(A) Three‐dimensional landmarks and semi‐landmarks. The 274 landmarks (83 anatomical landmarks in red, 191 semi‐landmarks in magenta) are shown on the mean female pelvis in our sample in anterior, superior, and lateral views. (B) Inlet landmarks. The 32 inlet landmarks shown on the mean female pelvis.
2.3. Statistical analyses
Centroid size, a common size measure in geometric morphometrics, was calculated for each woman based on all pelvic landmarks. Centroid size is defined as the square root of the sum of squared distances of all the landmarks from their centroid (center of gravity, average of all landmarks). To assess pelvic shape differences between the birth mode groups, the landmark configurations were standardized by Procrustes superimposition. 15 This standardization step removes variation that is due to position, orientation, and size of the measured objects. Subsequently, the sliding landmarks algorithm was applied to all curve semi‐landmarks in 3D, which allows these points to slide along predefined curves while minimizing the bending energy between each specimen and the sample mean. 16 , 17 Sliding of the landmarks reduces shape differences resulting from the arbitrary placement of landmark points along the curves. Subsequently, overall pelvic shape differences between groups were assessed using permutation tests. 18 To calculate the shape and area of the pelvic inlet, the 32 inlet landmarks were placed along the curve from the upper margin of the pubic symphysis along the pectineal line to the promontorium of the sacrum and back (Figure 1B) and were extracted from the total set of landmarks and projected onto a 2D plane (least‐squares fitted plane to the 3D landmarks) for each pelvis. The resulting coordinates were then once again subjected to the sliding landmarks algorithm in 2D. Shape differences of the inlet between groups were assessed using permutation tests. To assess size differences in the pelvic inlet, inlet area was calculated as the area of the polygon delimited by the 32 inlet landmarks for each pelvis (Figure 1B). As differences in inlet area might be an immediate consequence of differences in overall maternal body size, we additionally controlled for body size by regressing inlet area on maternal height. Differences in inlet area independent of height were then analyzed using the residuals from this regression. Statistical significance of mean group differences was assessed using permutation tests. Data analysis was performed in wolfram mathematica 12.
2.4. Ethics statement
This study was approved by the ethics committee at LMU Munich (#19–601) on September 25, 2019 and performed according to the standards of the Helsinki Declaration of 1975 (revised in 2008). Personal and detailed information about the participation in the study were provided, and the requirements of data protection were complied with. The trial was registered at the German Clinical Trials Register (DRKS) on December 10, 2019 (trial registration number DRKS00017690, URL https://www.drks.de, date of initial participant enrollment: December 18, 2019).
3. RESULTS
3.1. Sample characteristics
A total of 206 CT scans of women were reviewed. Of these, three cases were excluded because of foreign material or previous injury of the bony pelvis. Of the remaining 203 women, the bony pelvises were measured. The indications for CT scans in our sample were staging and follow up of malignant diseases (78.3%), cardiovascular (5.0%) or orthopedic (0.5%) diseases, benign diseases (11.3%), and routine scans before or after organ transplantation (4.9%). To compare pelvis shape and size between women who gave birth via cesarean section and women who delivered vaginally at term, we excluded all study participants with unknown birth mode, with unknown gestational age at delivery, with preterm delivery or who had experienced both a vaginal and a cesarean delivery. We divided the remaining sample of 177 women into three groups with respect to obstetric history: vaginal births only, cesarean sections only, and nulliparous women. This resulted in sample sizes of 21 for the cesarean section group, 118 for the vaginal birth group, and 38 nulliparous women. A flow chart of the selection process is shown in Figure 2.
FIGURE 2.
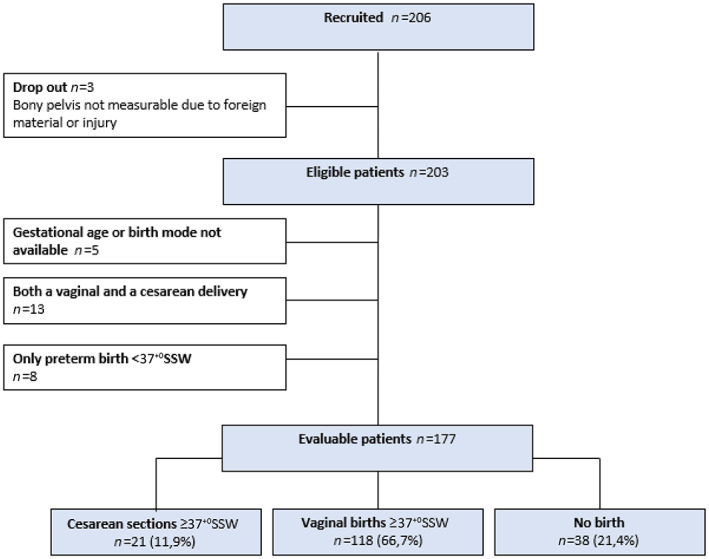
Flowchart illustrating case selection for this study; indicated are case numbers (n) and, for the final group comparison, the percentages (%) for each group. In all, 177 women were included in the final group comparison between cesarean delivery (n = 21), vaginal delivery (n = 118), and nulliparous women (n = 38).
The vaginal birth group (exclusively vaginal childbirths for children born at full term meaning in gestational week 37 and later) consisted of 118 persons and 217 children were born in this group. Of those, 209 children were born at full term (96.3% of all births in this group), five were born before week 37, and for three births, gestational duration was not indicated. The average duration of the pregnancies in this group was 39.7 weeks (standard deviation [SD] 2.3 weeks). Birthweight data were available for 184 children in this group (84.8%) and the average birthweight was 3364.3 g (SD 504.6 g).
The cesarean section group (exclusively cesarean sections for children born at full term) consisted of 21 women and 40 children were born in this group. Of those, 39 were born at full term (97.5%) and one child was born in gestational week 36. The average duration of the pregnancies in this group was 39.7 weeks (SD 1.4 weeks). Birthweight data were available for 39 children in this group (97.5%) and the average birthweight was 3379.2 g (SD 600.4 g).
There was no significant difference between the two groups in terms of average pregnancy duration and mean children's birthweight (permutation tests with 5000 permutations, p = 0.91 and p = 0.97, respectively). Neonatal weight showed a strong correlation with gestation length in our sample. For all firstborns (n = 141) the correlation was r = 0.73.
3.2. Differences in pelvic morphology
Pelvis size, calculated as pelvic centroid size (see Material and methods), was on average slightly but significantly smaller in the cesarean section group than in the vaginal birth group (2% smaller, permutation test with 5000 permutations, p = 0.045). There was a larger difference in inlet area between these groups, which was 7% smaller in the cesarean section group (mean ± SD 126.3 ± 11.3 cm2) compared with the vaginal birth group (mean ± SD 134.9 ± 11.6 cm2; permutation test for difference in group means with 5000 permutations, p = 0.002). Despite clear average differences, the distributions of inlet area in the cesarean section and vaginal birth groups showed large overlap (Figure 3). There was no significant difference between the nulliparous and vaginal birth groups regarding mean inlet area (Figure 3). For all 177 patients from this group comparison (nulliparous group, cesarean section group, and vaginal birth group together), inlet area was correlated with body height (r = 0.56), indicating that tall women had a larger pelvic inlet, on average (Figure 4). We found no significant differences in overall 3D pelvic shape and in inlet shape between vaginal birth, cesarean section, and nulliparous groups (permutation tests for mean group differences with 5000 permutations).
FIGURE 3.

Distributions of inlet area. Left panel: Vaginal birth group (orange) vs cesarean section group (blue); Right panel: Vaginal birth group (orange) vs nulliparous group (magenta). Mean inlet area was 7% smaller in the cesarean section group compared with the vaginal birth group.
FIGURE 4.

Pelvic inlet area plotted against body height for all three groups (177 women), indicating that tall women had a more spacious pelvic inlet, on average. Colors indicate birth mode groups: vaginal birth group (orange), cesarean section group (blue), nulliparous group (magenta).
Average body height was similar in the cesarean section group (mean ± SD 164.4 ± 7.9 cm) and in the vaginal birth group (mean ± SD 166.0 ± 6.0 cm; Figure 5). Women in the cesarean section group were slightly heavier than women in the vaginal birth group (mean ± SD: cesarean section group 71.5 ± 19.8 kg; vaginal birth group 65.9 ± 19.8 kg). Note that the weight measurements of these women were collected at the time of the CT scan, not during pregnancy or at delivery. Neither the differences in body height nor in body weight were statistically significant between the vaginal birth and cesarean section groups (permutation test with 5000 permutations, p = 0.18 and p = 0.33, respectively).
FIGURE 5.
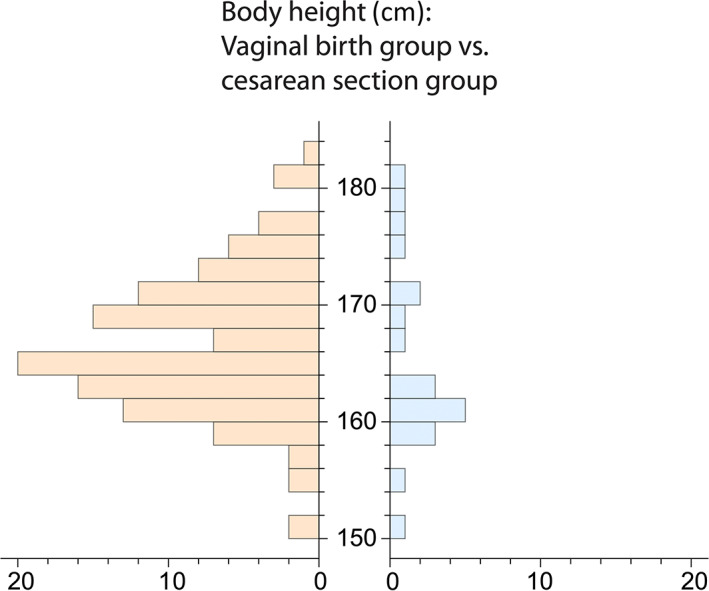
Maternal height distributions for the vaginal birth group (orange) and the cesarean section group (blue).
4. DISCUSSION
Our results indicate that the area of the pelvic inlet was on average 7% smaller in the cesarean section group compared with the vaginal birth group. Consistent with previous studies, 19 , 20 we found that the size of the pelvic inlet was positively correlated with body height, implying that shorter women, on average, had a smaller inlet and an increased probability of giving birth by cesarean section. Several previous studies have shown a correlation between body height and the probability of delivery by cesarean section. 21 , 22 However, group differences in inlet size persisted after controlling for body height, implying that inlet area cannot be reliably predicted for individual cases by measuring maternal body height.
The bony pelvis, and especially the dimensions of the birth canal, is the only part of the human skeleton that is absolutely larger, on average, in women than in men. 23 It has previously been shown that the area of the pelvic inlet is on average 11% larger in women compared with men. 23 This puts the effect size of the difference in inlet size between cesarean section and vaginal birth groups, which we detected here to be 7%, into context and identifies it as quite substantial.
Despite the detected differences in inlet area between birth mode groups, we did not find any differences in overall pelvis shape or in inlet shape between the birth mode groups. This implies that inlet size seems to matter for birth mode rather than its shape.
A unique feature of this study is the method of measurement of the bony pelvis. By placing 274 landmarks on a three‐dimensionally reconstructed pelvis, a very precise measurement of different planes and the consideration of the complete 3D shape of the pelvis is possible. Previously, conventional radiographs were often used for pelvimetry, and studies focused primarily on linear distances such as diameter transversa, conjugata vera obstetrica, and interspinous distance. 6 Pelvimetric analyses using CT and MRI imaging also measured mainly linear distances at the pelvic inlet and mid‐pelvis. 9 , 10 , 24 Capelle et al not only measured distances but considered the circumference of the pelvic inlet and mid‐pelvis on CT pelvic images, which was calculated by manual drawing. 25 There is no previous study on the association between 3D pelvic morphology and birth mode that analyzes areas of the pelvis and directly uses 3D measurements as well as women's obstetric records.
The measurement method used in this study has been established on pelvises from skeletal collections 13 , 14 , 26 and has previously been used on CT scans in primates. 23 Using a contemporary patient population with a known obstetric history, we demonstrate that this measurement method is applicable, that common hypotheses can be tested, and that new knowledge can be gained that goes beyond linear distance measurements.
We chose a collective of women aged 50 years and older who gave birth between the years of 1955 and 2011. At that time, the cesarean section rate in Germany was significantly lower than it is today, including elective and secondary cesarean sections. 27 The cesarean section rate in our collective was 19.3% (for the sample of 203 women), implying that this sample is representative of the cesarean section rate in the 1970s to the 1990s. However, the precise indication for cesarean section for the women in our sample, and whether it was fetopelvic disproportion, cannot reliably be determined from our data in all cases. By including only births with a gestational age of 37 weeks and more, and by excluding women with both a vaginal and a cesarean delivery from the group comparison, we tried to maximize the number of cesarean sections that were most likely due to fetopelvic disproportion. Cesarean sections that were due to other indications might contribute to a dilution of the morphological signal in our group comparison. We therefore suggest that the effect size (difference in average inlet area between groups) would probably be even stronger if we compared only women who had cesarean sections due to fetopelvic disproportion with women who delivered vaginally. However, the fact that we found average differences between the groups in the expected direction confirms that the identified morphological differences are meaningful for birth outcomes and can be identified by this method.
A potential limitation of our study is the size of the cesarean section group: Only 21 women gave birth exclusively by cesarean section and were therefore included in this group, although our total group size (n = 203) was substantially larger. This was partly a consequence of the lower cesarean section rate at that time, and of the fact that our inclusion criteria were quite strict. Our sample size (n = 203) seemed to be sufficient to analyze the variation in pelvic shape and size in women with cesarean section and vaginal birth. Other researchers based their analyses on similar sample sizes: Frémondière et al. based their analysis on a sample of 114 individuals and Korhonen et al studied the fetal pelvic index to predict cephalopelvic disproportion based on a sample size of 274 individuals. 11 , 28
In this study, we concentrated solely on the effect of the bony pelvis on birth mode. However, a successful vaginal birth is not determined solely by maternal birth canal morphology, but also depends on fetal variables, including fetal weight and head circumference, on the strength and frequency of uterine contractions, and potentially also on soft‐tissue variables such as pelvic floor muscle strength. 29 , 30 Most importantly, birth is a dynamic process and its outcome cannot be predicted by one morphological variable alone. Although our findings confirm that inlet area is an important variable, reliable individual predictions of birth mode should not be made based on inlet area alone. Future studies should address whether cut‐off values can be formed with regard to which pelvises are clearly sufficiently spacious for vaginal birth and which pelvises might be too small in terms of the space of the inlet of the bony birth canal. For example, in this study, all women with an inlet area less than 110 cm2 gave birth only by cesarean section, whereas all women with an inlet area greater than 150 cm2 gave birth only vaginally (Figure 3). However, we caution against overestimating the general applicability of the values estimated here because of the small sample size of the cesarean section group in our study. Potential cut‐off values need to be rigorously tested in larger studies before clinical application.
For this study, we measured the 3D morphology of the entire bony pelvis, not just the inlet. Placement of the detailed landmark set on each individual pelvis was time consuming, but fewer landmarks are needed if one limits the measurement of the pelvis to the inlet area.
This method to precisely measure inlet area is currently not yet available for use in the clinical routine. Yet, it is reasonable to assume that artificial intelligence methods will soon be available to measure inlet area with high precision in everyday clinical practice based on MRI images. This could give women considering vaginal birth after a previous cesarean section due to fetopelvic disproportion important information to choose the appropriate mode of delivery.
5. CONCLUSION
This observational study shows with the help of an elaborate and very accurate 3D measurement method of the female pelvis that women who delivered by cesarean section had a smaller pelvic inlet area than women who delivered vaginally. Future studies could address whether cut‐off values can be formed to predict whether pelvises are clearly sufficiently spacious for vaginal birth or too small in terms of the area of the inlet of the bony birth canal.
AUTHOR CONTRIBUTIONS
TS, BF, and UH designed the study. BF and LS designed the landmark scheme. TS, LS, LE, and VK collected the landmark and biometric data. BF analyzed the data. TS and BF interpreted the data and wrote the paper. SM, CH, TK, and JB contributed to the interpretation of the data and wrote specific parts of the manuscript. All authors critically revised the manuscript.
FUNDING INFORMATION
BF acknowledges funding from the Austrian Science Fund FWF (grant no. 826‐B).
CONFLICT OF INTEREST
TS reports a lecture fee by Ferring GmbH. SM reports research funding, advisory board, honorary or travel expenses: AbbVie, AstraZeneca, Clovis, Eisai, GlaxoSmithKline, Hubro, Medac, MSD, Novartis, Nykode, Olympus, PharmaMar, Pfizer, Roche, Sensor Kinesis, Teva, Tesaro. TK reports a relative employed at Roche, holds stock of Roche, Biontech, Valneva. The other authors declare that they have no competing interests.
Supporting information
Table S1
Starrach T, Schmidhuber L, Elger L, et al. Pelvic inlet area is associated with birth mode. Acta Obstet Gynecol Scand. 2023;102:59‐66. doi: 10.1111/aogs.14478
DATA AVAILABILITY STATEMENT
The data that support the findings of this study are openly available in an OSF repository: https://osf.io/463k7/.
REFERENCES
- 1. Baird D. The cause and prevention of difficult labour. Am J Obstet Gynecol. 1952;63:1200‐1212. [DOI] [PubMed] [Google Scholar]
- 2. Hofmeyr GJ. Obstructed labor: using better technologies to reduce mortality. Int J Gynaecol Obstet. 2004;85(Suppl 1):S62‐S72. [DOI] [PubMed] [Google Scholar]
- 3. Stulp G, Verhulst S, Pollet TV, Nettle D, Buunk AP. Parental height differences predict the need for an emergency caesarean section. PLoS One. 2011;6:e20497. [DOI] [PMC free article] [PubMed] [Google Scholar]
- 4. Burke N, Burke G, Breathnach F, et al. Prediction of cesarean delivery in the term nulliparous woman: results from the prospective, multicenter genesis study. Am J Obstet Gynecol. 2017;216:598.e1‐e11. [DOI] [PubMed] [Google Scholar]
- 5. Bresler JB. Maternal height and the prevalence of stillbirths. Am J Phys Anthropol. 1962;20:515‐517. [DOI] [PubMed] [Google Scholar]
- 6. Pattinson RC, Cuthbert A, Vannevel V. Pelvimetry for fetal cephalic presentations at or near term for deciding on mode of delivery. Cochrane Database Syst Rev. 2017;3:Cd000161. [DOI] [PMC free article] [PubMed] [Google Scholar]
- 7. Mengert WF. Estimation of pelvic capacity. Jama. 1948;138:169‐174. [DOI] [PubMed] [Google Scholar]
- 8. Friedman EA, Taylor MB. A modified nomographic aid for x‐ray cephalopelvimetry. Am J Obstet Gynecol. 1969;105:1110‐1115. [DOI] [PubMed] [Google Scholar]
- 9. Zaretsky MV, Alexander JM, McIntire DD, Hatab MR, Twickler DM, Leveno KJ. Magnetic resonance imaging pelvimetry and the prediction of labor dystocia. Obstet Gynecol. 2005;106:919‐926. [DOI] [PubMed] [Google Scholar]
- 10. Lenhard MS, Johnson TRC, Weckbach S, Nikolaou K, Friese K, Hasbargen U. Pelvimetry revisited: analyzing cephalopelvic disproportion. Eur J Radiol. 2010;74:e107‐e111. [DOI] [PubMed] [Google Scholar]
- 11. Korhonen U, Taipale P, Heinonen S. Fetal pelvic index to predict cephalopelvic disproportion ‐ a retrospective clinical cohort study. Acta Obstet Gynecol Scand. 2015;94:615‐621. [DOI] [PubMed] [Google Scholar]
- 12. Franz M, von Bismarck A, Delius M, et al. MR pelvimetry: prognosis for successful vaginal delivery in patients with suspected fetopelvic disproportion or breech presentation at term. Arch Gynecol Obstet. 2017;295:351‐359. [DOI] [PubMed] [Google Scholar]
- 13. Reynolds HM SC, Young JW. Spatial geometry of the human pelvis, memorandum report prepared for the U.S. Department of Transportation, Federal Aviation Administration, Office of Aviation Medicine (National Technical Information Service, Washington, DC). 1982. [Google Scholar]
- 14. Waltenberger L, Pany‐Kucera D, Rebay‐Salisbury K, Mitteroecker P. The association of parturition scars and pelvic shape: a geometric morphometric study. Am J Phys Anthropol. 2021;174:519‐531. [DOI] [PMC free article] [PubMed] [Google Scholar]
- 15. Gower JC. Generalized procrustes analysis. Psychometrika. 1975;40:33‐51. [Google Scholar]
- 16. Gunz P, Mitteroecker P, Bookstein FL. Semilandmarks in three dimensions. In: Slice DE, ed. Modern morphometrics in physical anthropology. Springer US; 2005:73‐98. [Google Scholar]
- 17. Gunz P, Mitteroecker P. Semilandmarks: a method for quantifying curves and surfaces. Hystrix it J Mammal. 2013;24:103‐109. [Google Scholar]
- 18. Good P. Permutation tests: a practical guide to resampling methods for testing hypotheses. Springer Science & Business Media; 2013. [Google Scholar]
- 19. Benjamin SJ, Daniel AB, Kamath A, Ramkumar V. Anthropometric measurements as predictors of cephalopelvic disproportion: can the diagnostic accuracy be improved? Acta Obstet Gynecol Scand. 2012;91:122‐127. [DOI] [PubMed] [Google Scholar]
- 20. Tague RG. Do big females have big pelves? Am J Phys Anthropol. 2000;112:377‐393. [DOI] [PubMed] [Google Scholar]
- 21. Merchant KM, Villar J, Kestler E. Maternal height and newborn size relative to risk of intrapartum caesarean delivery and perinatal distress. BJOG. 2001;108:689‐696. [DOI] [PubMed] [Google Scholar]
- 22. Marbaniang SP, Lhungdim H, Chaurasia H. Effect of maternal height on the risk of caesarean section in singleton births: evidence from a large‐scale survey in India. BMJ Open. 2022;12:e054285. [DOI] [PMC free article] [PubMed] [Google Scholar]
- 23. Fischer B, Grunstra NDS, Zaffarini E, Mitteroecker P. Sex differences in the pelvis did not evolve de novo in modern humans. Nat Ecol Evol. 2021;5:625‐630. [DOI] [PMC free article] [PubMed] [Google Scholar]
- 24. Kjeldsen LL, Blankholm AD, Jurik AG, Salvig JD, Maimburg RD. Pelvic capacity in pregnant women, identified using magnetic resonance imaging. Acta Obstet Gynecol Scand. 2021;100:1454‐1462. [DOI] [PubMed] [Google Scholar]
- 25. Capelle C, Devos P, Caudrelier C, et al. How reproducible are classical and new CT‐pelvimetry measurements? Diagn Interv Imaging. 2020;101:79‐89. [DOI] [PubMed] [Google Scholar]
- 26. Fischer B, Mitteroecker P. Covariation between human pelvis shape, stature, and head size alleviates the obstetric dilemma. Proc Natl Acad Sci U S A. 2015;112:5655‐5660. [DOI] [PMC free article] [PubMed] [Google Scholar]
- 27. Antoine C, Young BK. Cesarean section one hundred years 1920‐2020: the Good, the bad and the ugly. J Perinat Med. 2020;49:5‐16. [DOI] [PubMed] [Google Scholar]
- 28. Frémondière P, Thollon L, Adalian P, Delotte J, Marchal F. Which foetal‐pelvic variables are useful for predicting caesarean section and instrumental assistance? Med Princ Pract. 2017;26:359‐367. [DOI] [PMC free article] [PubMed] [Google Scholar]
- 29. Liao JB, Buhimschi CS, Norwitz ER. Normal labor: mechanism and duration. Obstet Gynecol Clin North Am. 2005;32:145‐164. [DOI] [PubMed] [Google Scholar]
- 30. Davenport MH, Ruchat SM, Sobierajski F, et al. Impact of prenatal exercise on maternal harms, labour and delivery outcomes: a systematic review and meta‐analysis. Br J Sports Med. 2019;53:99‐107. [DOI] [PubMed] [Google Scholar]
Associated Data
This section collects any data citations, data availability statements, or supplementary materials included in this article.
Supplementary Materials
Table S1
Data Availability Statement
The data that support the findings of this study are openly available in an OSF repository: https://osf.io/463k7/.